Nueva York · Anual
Año 2025
Descargas
1 Mensajes clave y sinopsis climática
Fuente: NOAA NCEI
Fuente: NOAA NCEI
2 Condiciones globales y forzantes climáticos
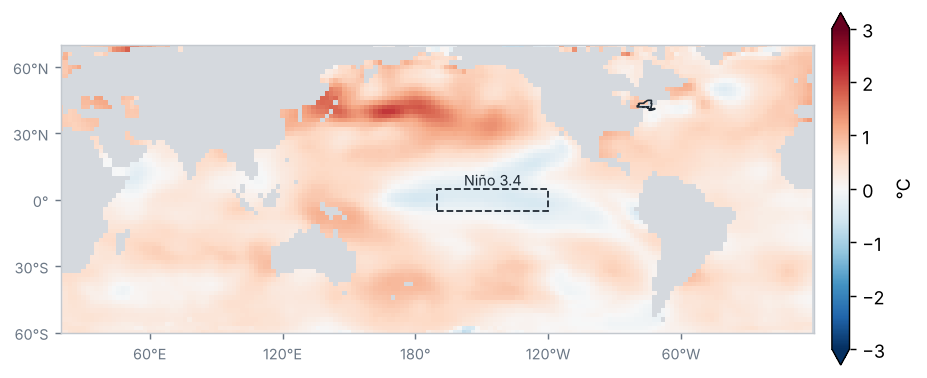
Anomalía de la temperatura superficial del mar, Año 2025 (°C, 1991–2020)
Fuente: NOAA NCEI / PSL
Anomalía de temperatura del mar en las regiones Niño (°C)
| Región | Anomalía (°C) | Cambio respecto al periodo anterior (°C) |
|---|---|---|
| Niño 1+2 | 0.2 | 0.3 |
| Niño 3 | −0.2 | −0.5 |
| Niño 3.4 | −0.3 | −0.7 |
| Niño 4 | −0.2 | −0.8 |
Promedio de los meses del periodo (OISST v2.1)
Fuente: NOAA CPC
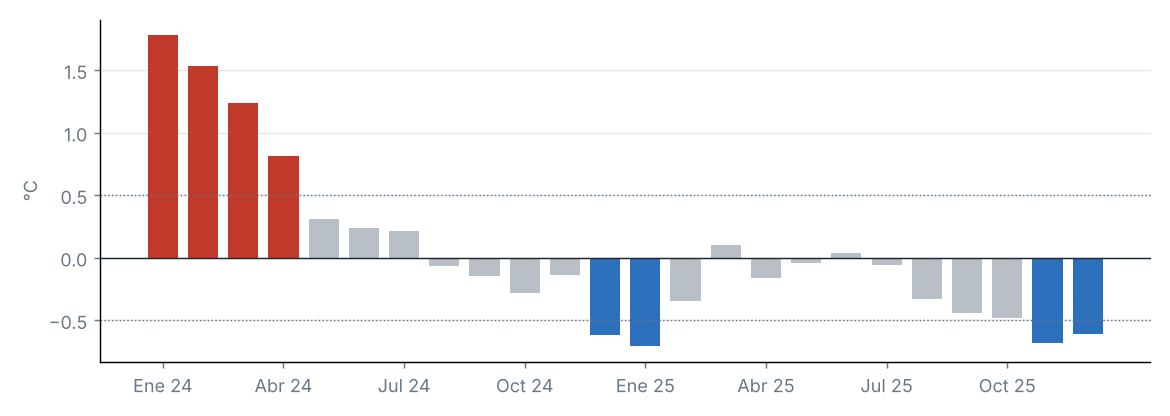
Condiciones de La Niña de intensidad débil: el Índice Oceánico de El Niño (ONI) de OND 2025 fue de −0.6 °C.
Fuente: NOAA CPC
Anomalía mensual de Niño 3.4, últimos 24 meses (°C)
Fuente: NOAA CPC
Índices de teleconexión
| Índice | Valor | Fase |
|---|---|---|
| NAO | 0.0 | Neutral |
| AO | 0.2 | Neutral |
| PDO | −2.0 | Negativa |
Oscilación del Atlántico Norte (NAO); Oscilación Ártica (AO); Oscilación Decadal del Pacífico (PDO).
Fuente: NOAA CPC, NOAA NCEI
La anomalía de Niño 3.4 fue de −0.31 °C (−0.71 °C respecto al periodo anterior).
Otros índices: NAO +0.02 (fase neutral); AO +0.20 (fase neutral); PDO −1.99 (fase negativa).
3 Precipitación
Fuente: NOAA NCEI
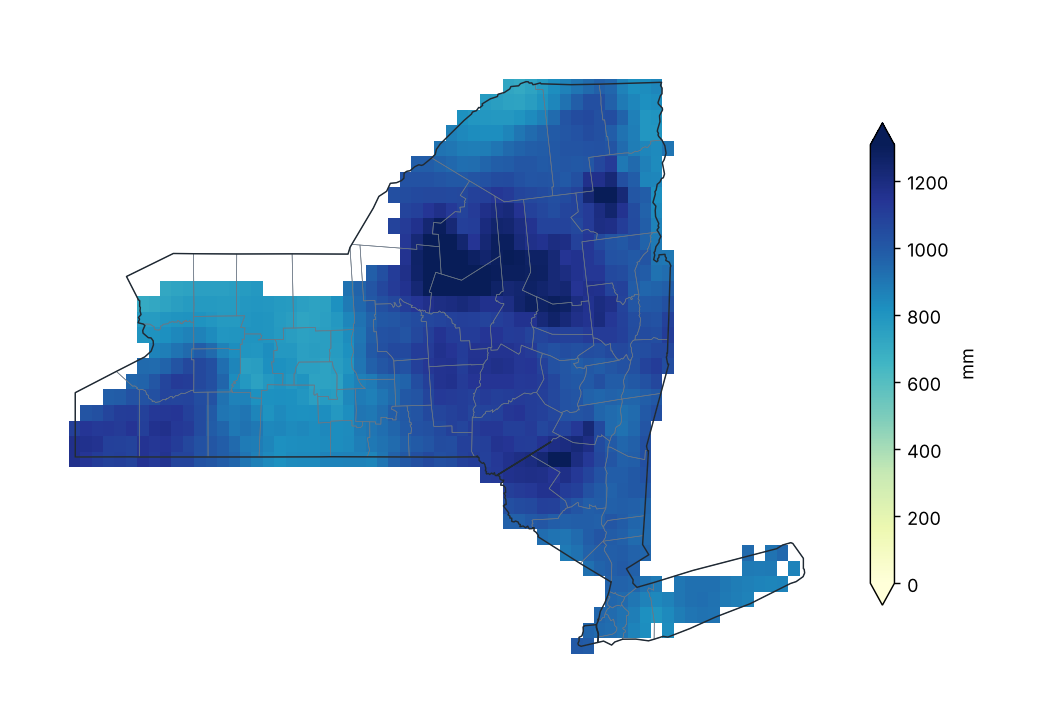
Precipitación acumulada
Fuente: NOAA NCEI
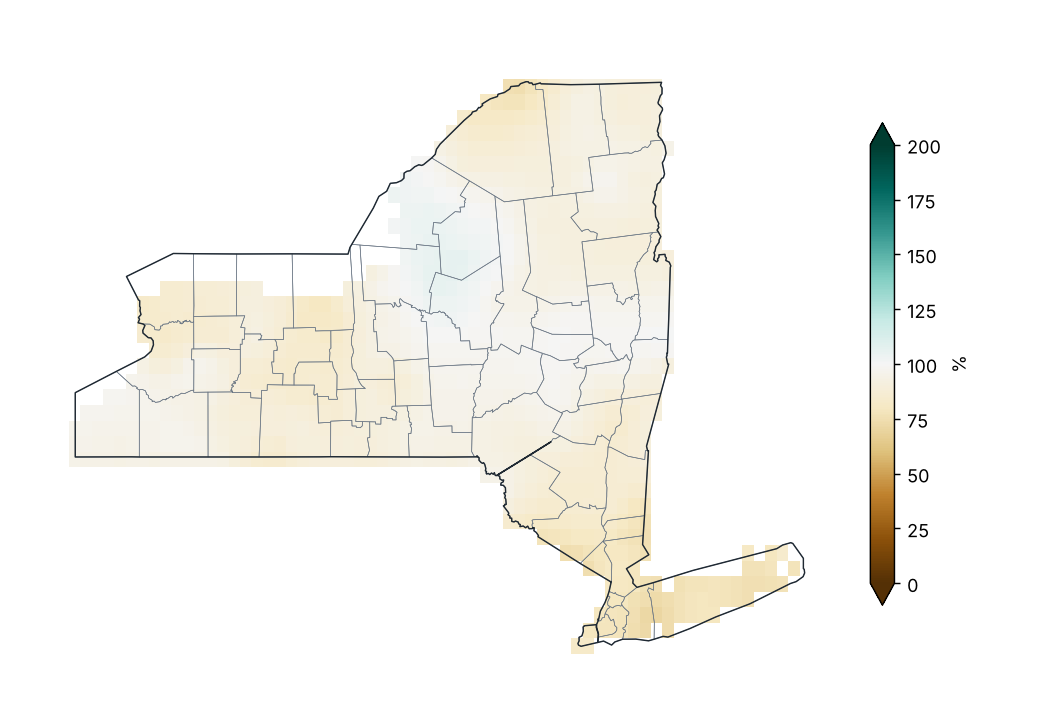
Porcentaje de la precipitación normal (1991–2020)
Fuente: NOAA NCEI
Porcentaje de lo normal por condado
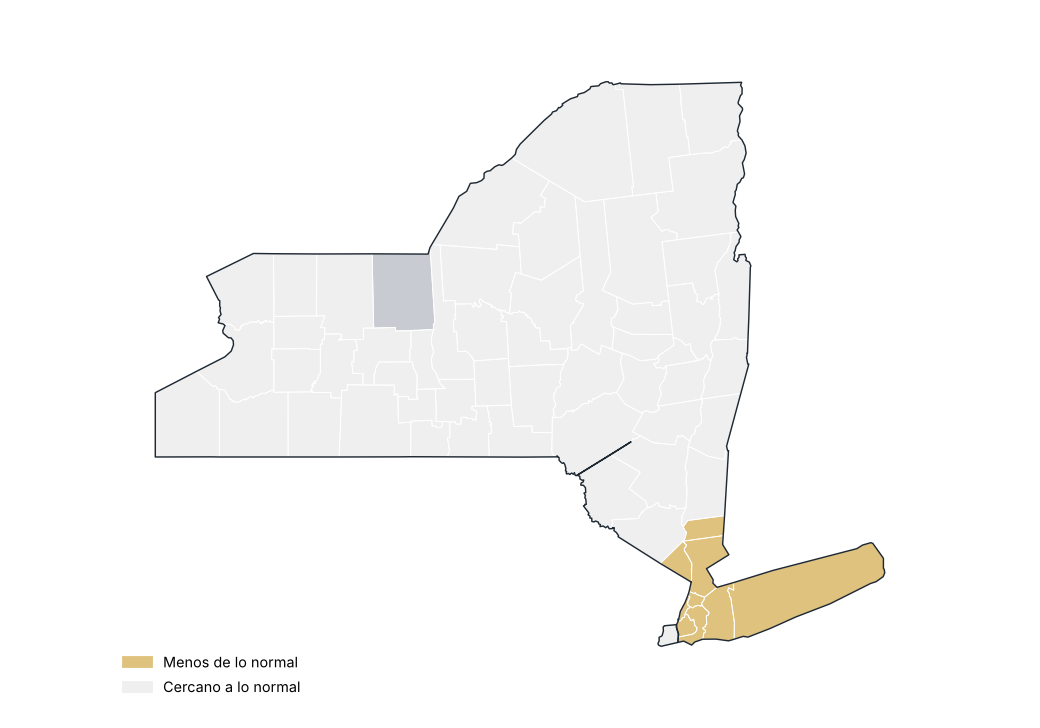
Fuente: NOAA NCEI
Precipitación por región
| Región | Acumulado (mm) | Normal (mm) | Diferencia (%) | Categoría |
|---|---|---|---|---|
| Meseta occidental | 939.8 | 1028.8 | −8.6 | Cercano a lo normal |
| Meseta oriental | 1086.6 | 1169.5 | −7.1 | Cercano a lo normal |
| Meseta norte | 1173.3 | 1225.3 | −4.2 | Cercano a lo normal |
| Costa | 891.8 | 1159.1 | −23.1 | Menos de lo normal |
| Valle del Hudson | 1002.9 | 1134.8 | −11.6 | Cercano a lo normal |
| Valle del Mohawk | 1185.9 | 1186.3 | −0.0 | Cercano a lo normal |
| Valle del Champlain | 994.2 | 1079.8 | −7.9 | Cercano a lo normal |
| Valle del San Lorenzo | 946.0 | 1061.3 | −10.9 | Cercano a lo normal |
| Grandes Lagos | 963.2 | 1027.2 | −6.2 | Cercano a lo normal |
| Lagos centrales | 884.5 | 983.0 | −10.0 | Cercano a lo normal |
Fuente: NOAA NCEI
Estaciones con mayor exceso de precipitación
| Región | Condado | Estación | Altitud (m) | Anomalía (%) |
|---|---|---|---|---|
| Meseta oriental | Madison | Morrisville 6 SW | 512.0 | 13.7 |
| Meseta norte | Lewis | Highmarket 2W | 550.0 | 13.1 |
| Grandes Lagos | Oswego | Fulton Oswego Co AP | 144.0 | 10.9 |
| Grandes Lagos | Jefferson | Watertown AP | 95.0 | 9.3 |
| Valle del Champlain | Essex | Lake Placid 2 S | 576.0 | 8.6 |
| Valle del Mohawk | Oneida | Camden | 177.0 | 6.4 |
| Valle del Hudson | Saratoga | Saratoga Springs 4 SW | 99.0 | 5.0 |
| Grandes Lagos | Jefferson | Watertown | 152.0 | 4.2 |
| Valle del Mohawk | Oneida | Boonville 4 SSW | 472.0 | 3.1 |
| Valle del Hudson | Albany | Albany Intl AP | 85.0 | 1.8 |
Fuente: NOAA NCEI
Estaciones con mayor déficit de precipitación
| Región | Condado | Estación | Altitud (m) | Anomalía (%) |
|---|---|---|---|---|
| Costa | Suffolk | Farmingdale Republic AP | 23.0 | −39.3 |
| Meseta occidental | Allegany | Whitesville 1N | 661.0 | −30.8 |
| Valle del San Lorenzo | St. Lawrence | Massena Intl AP | 61.0 | −28.0 |
| Costa | Suffolk | Bridgehampton | 13.0 | −26.8 |
| Costa | Suffolk | Islip-Li Macarthur AP | 25.0 | −25.9 |
| Grandes Lagos | Erie | Buffalo | 241.0 | −22.6 |
| Lagos centrales | Livingston | Dansville Muni AP | 196.0 | −22.5 |
| Costa | Suffolk | Upton Coop - Nwsfo New York | 24.0 | −22.0 |
| Lagos centrales | Ontario | Honeoye | 244.0 | −21.3 |
| Costa | Queens | Jfk Intl AP | 3.0 | −21.2 |
Fuente: NOAA NCEI
Mayores lluvias en 24 horas en estaciones
| Estación | Condado | Lluvia máxima en 24 h (mm) | Fecha |
|---|---|---|---|
| Norwich | Chenango | 102.6 | 23/06/2025 |
| Westmoreland 4N | Oneida | 92.2 | 22/06/2025 |
| Westchester Co AP | Westchester | 85.9 | 14/07/2025 |
| Albany Intl AP | Albany | 85.3 | 25/09/2025 |
| Sherburne | Chenango | 85.1 | 22/06/2025 |
| Indian Lake 2SW | Hamilton | 84.3 | 13/07/2025 |
| Mattituck | Suffolk | 81.5 | 31/10/2025 |
| Rochester Gtr Intl | Monroe | 80.0 | 18/06/2025 |
| Phonecia 2SW | Ulster | 77.2 | 06/05/2025 |
| Walton 2 | Delaware | 76.2 | 23/06/2025 |
Fuente: NOAA NCEI
Precipitación estatal en cada año
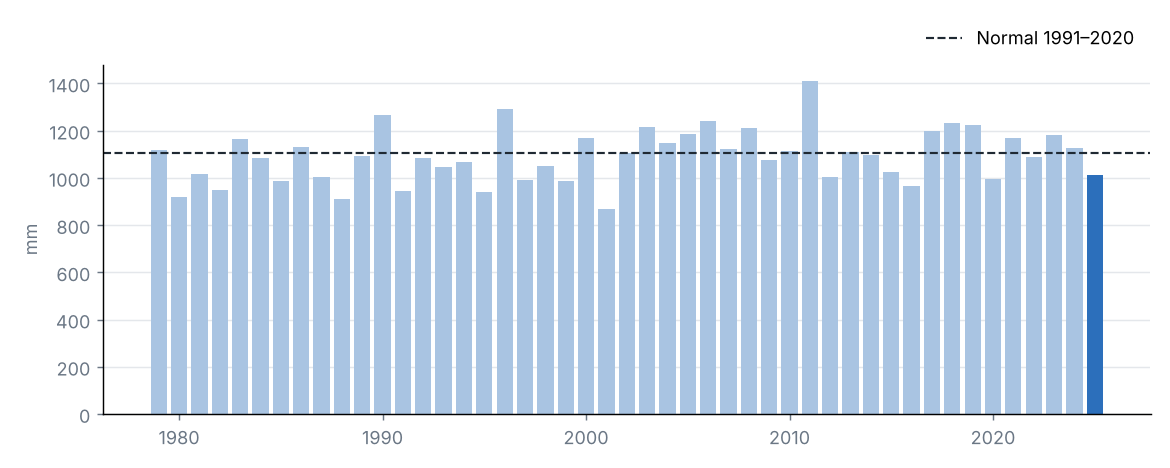
Fuente: NOAA NCEI
Precipitación mensual y normal 1991–2020
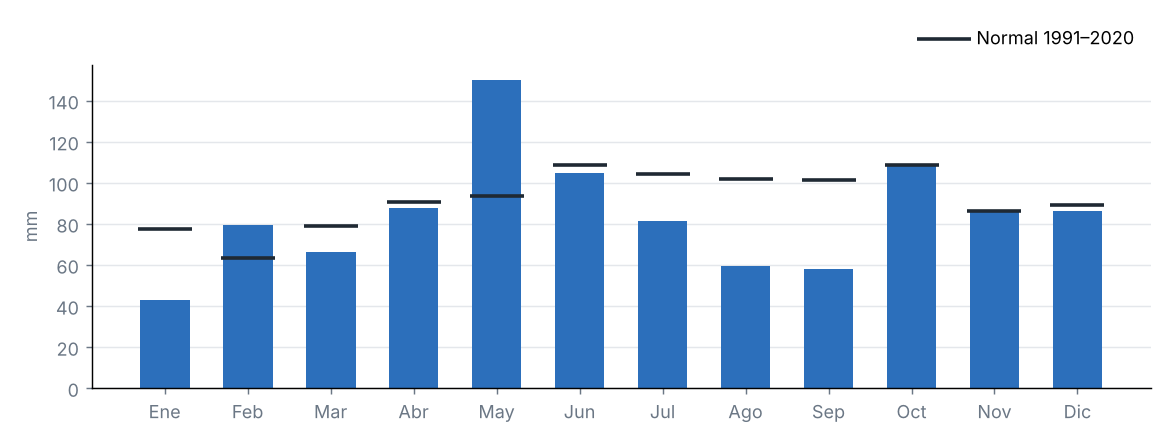
Fuente: NOAA NCEI
La precipitación acumulada en el estado fue de 1010.5 mm, el 92 % de su promedio 1991–2020 (1104.0 mm), categoría «cercano a lo normal». Fue el 14.º año más seco de la serie 1979–2025.
La región con mayor porcentaje respecto a su normal fue Valle del Mohawk (100 %) y la de menor porcentaje, Costa (77 %).
Fuente: NOAA NCEI
4 Temperatura
Fuente: NOAA NCEI
Temperatura media
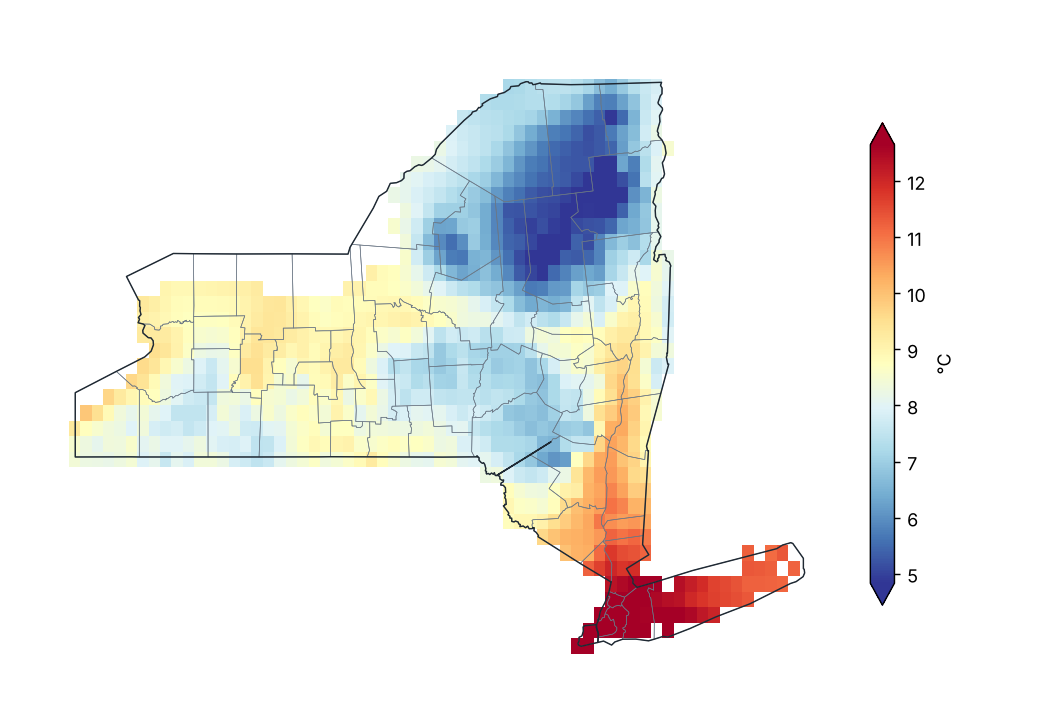
Fuente: NOAA NCEI
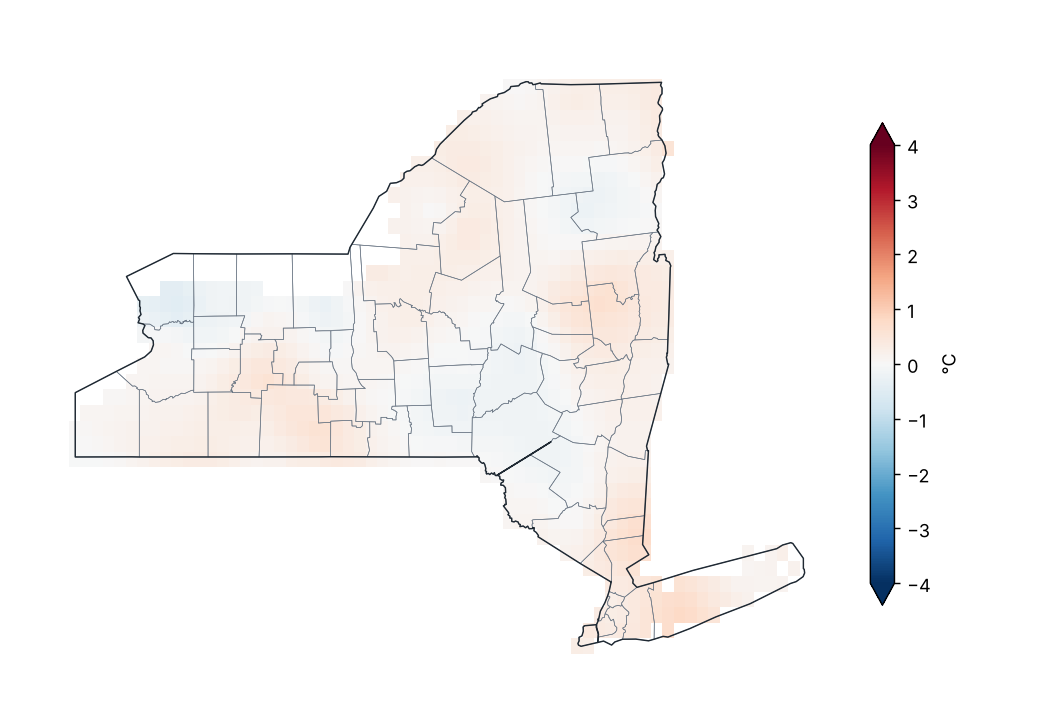
Anomalía de temperatura media (1991–2020)
Fuente: NOAA NCEI
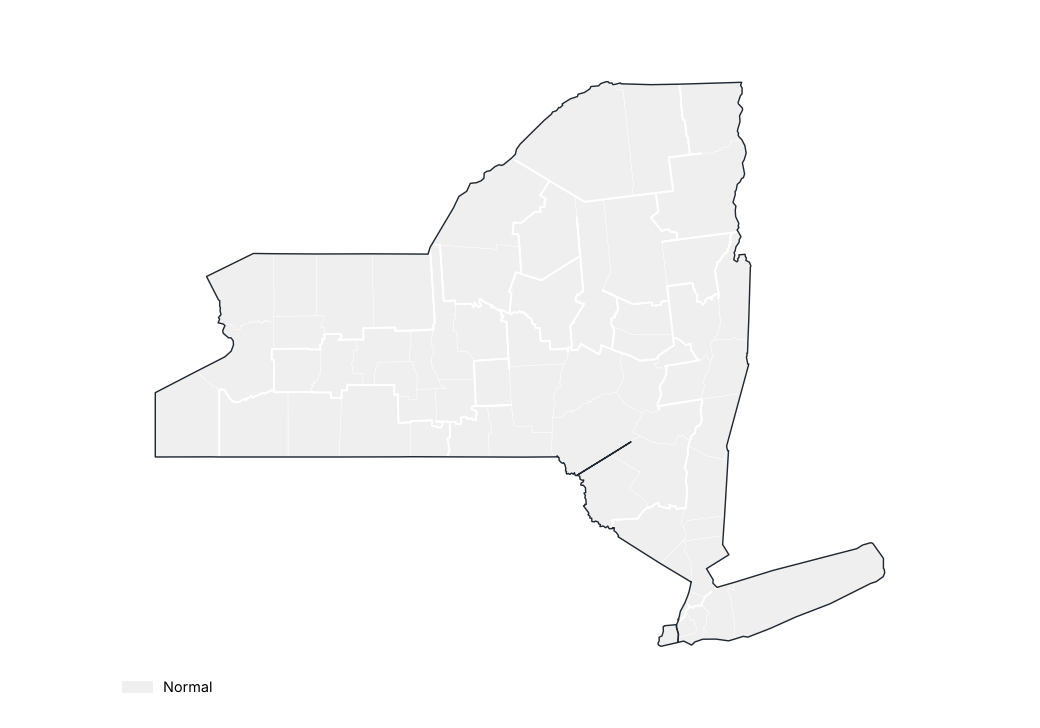
Anomalía de temperatura media por región
Fuente: NOAA NCEI
Estaciones con mayor anomalía positiva
| Región | Condado | Estación | Altitud (m) | Anomalía (°C) |
|---|---|---|---|---|
| Meseta occidental | Cattaraugus | Franklinville | 485.0 | 2.7 |
| Meseta oriental | Schoharie | Lansing Manor | 338.0 | 1.6 |
| Costa | Suffolk | Montauk AP | 2.0 | 1.4 |
| Lagos centrales | Livingston | Dansville Muni AP | 196.0 | 1.1 |
| Costa | Suffolk | Islip-Li Macarthur AP | 25.0 | 0.9 |
| Valle del San Lorenzo | St. Lawrence | Gouverneur 3 NW | 128.0 | 0.8 |
| Valle del Hudson | Saratoga | Saratoga Springs 4 SW | 99.0 | 0.8 |
| Valle del Hudson | Saratoga | Conklingville Dam | 246.0 | 0.7 |
| Meseta norte | Lewis | Lowville | 263.0 | 0.6 |
| Grandes Lagos | Oswego | Oswego | 99.0 | 0.6 |
Fuente: NOAA NCEI
Estaciones con mayor anomalía negativa
| Región | Condado | Estación | Altitud (m) | Anomalía (°C) |
|---|---|---|---|---|
| Meseta oriental | Chenango | Norwich | 301.0 | −1.0 |
| Meseta oriental | Madison | Morrisville 6 SW | 512.0 | −0.9 |
| Valle del Champlain | Clinton | Dannemora | 408.0 | −0.8 |
| Grandes Lagos | Wayne | Sodus 1W | 135.0 | −0.8 |
| Grandes Lagos | Chautauqua | Dunkirk Chautauqua Co AP | 204.0 | −0.7 |
| Meseta oriental | Delaware | Walton 2 | 451.0 | −0.6 |
| Grandes Lagos | Jefferson | Watertown | 152.0 | −0.4 |
| Lagos centrales | Livingston | Mt Morris 2W | 268.0 | −0.4 |
| Meseta occidental | Allegany | Alfred | 586.0 | −0.3 |
| Meseta occidental | Allegany | Wellsville Muni AP | 638.0 | −0.3 |
Fuente: NOAA NCEI
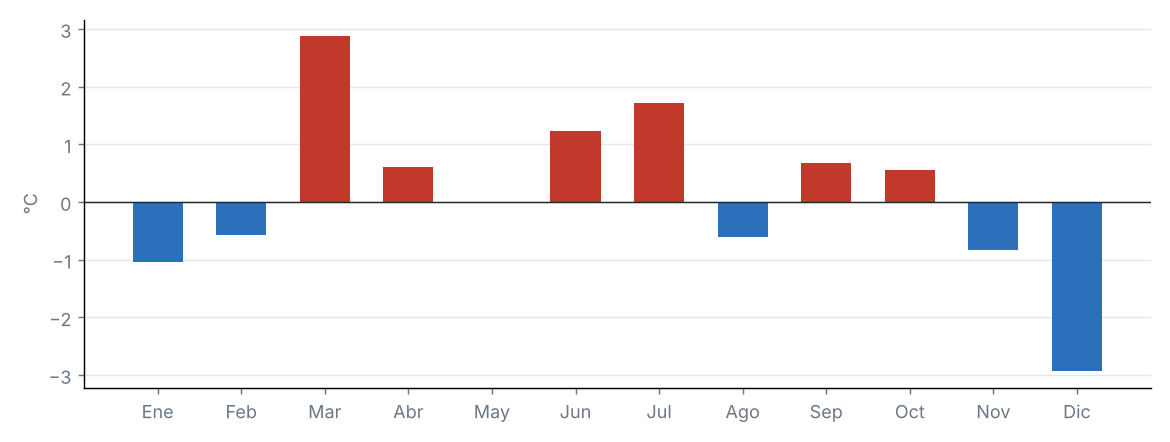
Anomalía mensual de la temperatura media estatal
Fuente: NOAA NCEI
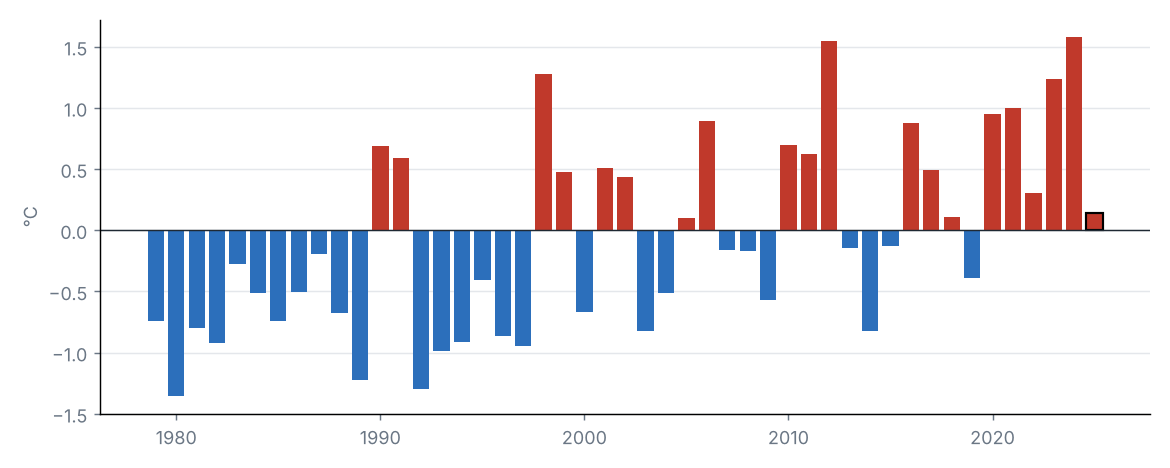
Anomalía de la temperatura media estatal en cada año
Fuente: NOAA NCEI
La temperatura media estatal fue de 8.1 °C, 0.1 °C por encima del promedio 1991–2020 (8.0 °C), categoría «normal». Fue el 18.º año más cálido de la serie 1979–2025 (empatado con 2005, 2018).
Por regiones, la mayor anomalía se registró en Costa (+0.4 °C) y la menor en Meseta oriental (−0.0 °C).
Fuente: NOAA NCEI
Fuente: NOAA NCEI
Anomalía de temperatura máxima (1991–2020)
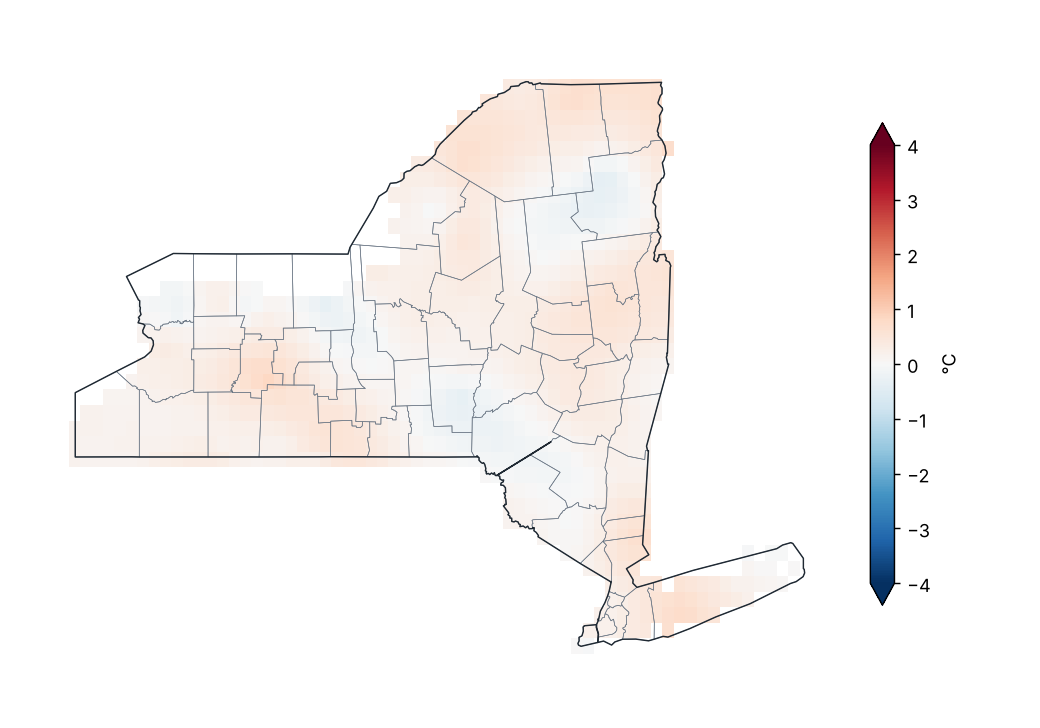
Fuente: NOAA NCEI
Valores extremos de la temperatura máxima media mensual por región
| Región | Valor mínimo (°C) | Estación | Valor máximo (°C) | Estación |
|---|---|---|---|---|
| Meseta occidental | 12.8 | Wellsville Muni AP | 16.4 | Franklinville |
| Meseta oriental | 11.4 | Morrisville 6 SW | 17.2 | Lansing Manor |
| Meseta norte | 10.4 | Highmarket 2W | 14.2 | Glens Falls AP |
| Costa | 15.7 | Bridgehampton | 17.5 | Laguardia AP |
| Valle del Hudson | 13.4 | Conklingville Dam | 17.1 | Ny City Cntrl Park |
| Valle del Mohawk | 11.1 | Gloversville 7NW (Peck Lake) | 14.0 | Rome Griffiss Airfield |
| Valle del Champlain | 11.1 | Newcomb | 13.3 | Plattsburgh Intl AP |
| Valle del San Lorenzo | 11.2 | Colton 2 N | 13.2 | Gouverneur 3 NW |
| Grandes Lagos | 12.8 | Watertown | 15.3 | Portland 1SW |
| Lagos centrales | 12.0 | Warsaw 6 SW | 16.9 | Dansville Muni AP |
Promedio mensual por estación (GHCN-Daily, ≥ 80 % de días con datos).
Fuente: NOAA NCEI
La temperatura máxima estatal fue de 13.6 °C, 0.2 °C por encima del promedio 1991–2020 (13.4 °C), categoría «normal». Fue el 19.º año más cálido de la serie 1979–2025 (empatado con 2015).
Por regiones, la mayor anomalía se registró en Valle del San Lorenzo (+0.4 °C) y la menor en Meseta oriental (+0.1 °C).
Fuente: NOAA NCEI
Fuente: NOAA NCEI
Anomalía de temperatura mínima (1991–2020)
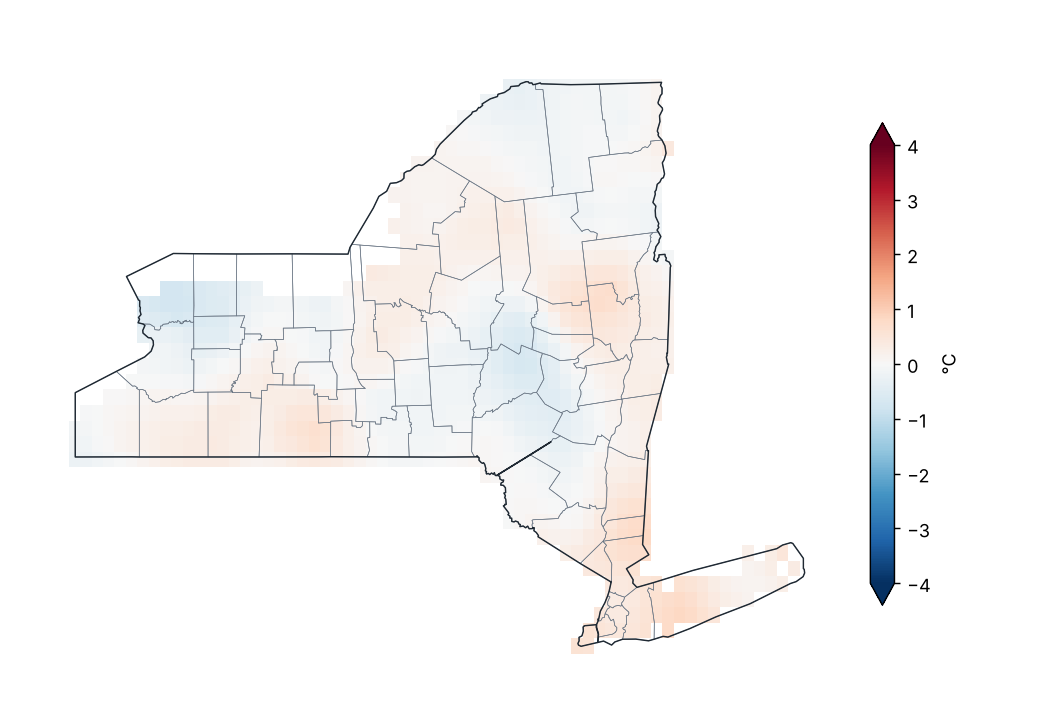
Fuente: NOAA NCEI
Valores extremos de la temperatura mínima media mensual por región
| Región | Valor mínimo (°C) | Estación | Valor máximo (°C) | Estación |
|---|---|---|---|---|
| Meseta occidental | 0.9 | Alfred | 3.3 | Franklinville |
| Meseta oriental | 0.9 | Walton 2 | 3.7 | Binghamton |
| Meseta norte | −1.2 | Highmarket 2W | 1.6 | Trenton Falls |
| Costa | 5.6 | Westhampton Gabreski AP | 9.8 | Laguardia AP |
| Valle del Hudson | 2.4 | Buskirk | 9.3 | Ny City Cntrl Park |
| Valle del Mohawk | 0.5 | Boonville 4 SSW | 3.0 | Rome Griffiss Airfield |
| Valle del Champlain | −1.0 | Newcomb | 2.5 | Plattsburgh Intl AP |
| Valle del San Lorenzo | −2.1 | Saranac Lk Adirondack Rgnl AP | 1.8 | Gouverneur 3 NW |
| Grandes Lagos | 2.0 | Watertown AP | 6.0 | Oswego |
| Lagos centrales | 2.2 | Mecklenburg 4SW | 5.5 | Dansville Muni AP |
Promedio mensual por estación (GHCN-Daily, ≥ 80 % de días con datos).
Fuente: NOAA NCEI
La temperatura mínima estatal fue de 2.6 °C, 0.1 °C por encima del promedio 1991–2020 (2.5 °C), categoría «normal». Fue el 17.º año más cálido de la serie 1979–2025 (empatado con 1999).
Por regiones, la mayor anomalía se registró en Costa (+0.4 °C) y la menor en Meseta oriental (−0.1 °C).
Fuente: NOAA NCEI
5 Extremos climáticos y récords
Fuente: NOAA NCEI
Temperatura máxima más alta por condado
| Condado | Estación | Temperatura (°C) | Fecha |
|---|---|---|---|
| Suffolk | Baiting Hollow | 39.4 | 25/06/2025 |
| Queens | Jfk Intl AP | 38.9 | 24/06/2025 |
| Clinton | Plattsburgh Intl AP | 38.3 | 23/06/2025 |
| Dutchess | Poughkeepsie AP | 37.8 | 24/06/2025 |
| New York | Ny City Cntrl Park | 37.2 | 24/06/2025 |
| Washington | Whitehall | 37.2 | 24/06/2025 |
| Columbia | Hudson Correctional Facility | 36.7 | 24/06/2025 |
| Livingston | Dansville Muni AP | 36.7 | 12/08/2025 |
| Ontario | Victor 2NW | 36.7 | 13/08/2025 |
| Saratoga | Saratoga Springs 4 SW | 36.7 | 24/06/2025 |
| Warren | Glens Falls AP | 36.7 | 24/06/2025 |
| Westchester | Shrub Oak | 36.7 | 25/06/2025 |
| Chemung | Elmira | 36.1 | 13/08/2025 |
| Orange | Port Jervis | 36.1 | 25/06/2025 |
| Schoharie | Lansing Manor | 36.1 | 24/06/2025 |
| Tioga | Waverly | 36.1 | 25/06/2025 |
| Albany | Albany Intl AP | 35.6 | 23/06/2025 |
| Ulster | Mohonk Lake | 35.6 | 24/06/2025 |
| Chautauqua | Dunkirk | 35.0 | 13/07/2025 |
| Chenango | Sherburne | 35.0 | 24/06/2025 |
Los 20 valores más extremos de 53.
Fuente: NOAA NCEI
Temperatura mínima más baja por condado
| Condado | Estación | Temperatura (°C) | Fecha |
|---|---|---|---|
| Franklin | Saranac Lk Adirondack Rgnl AP | −32.1 | 02/02/2025 |
| Herkimer | Stillwater Rsvr | −31.1 | 02/02/2025 |
| Cortland | Ithaca 13 E | −30.1 | 22/01/2025 |
| Delaware | Delhi 2 SE | −30.0 | 22/01/2025 |
| Sullivan | Callicoon Ctr | −30.0 | 22/01/2025 |
| Essex | Newcomb | −29.4 | 02/02/2025 |
| Hamilton | Indian Lake 2SW | −29.4 | 02/02/2025 |
| Lewis | Highmarket 2W | −29.4 | 02/02/2025 |
| Fulton | Gloversville 7NW (Peck Lake) | −28.9 | 22/01/2025 |
| St. Lawrence | Massena Intl AP | −28.8 | 02/02/2025 |
| Tompkins | Freeville 1 NE | −28.3 | 22/01/2025 |
| Jefferson | Watertown AP | −27.8 | 08/12/2025 |
| Schoharie | Lansing Manor | −27.8 | 22/01/2025 |
| Chenango | Sherburne | −27.2 | 22/01/2025 |
| Cattaraugus | Little Valley | −26.7 | 22/01/2025 |
| Allegany | Angelica | −26.1 | 22/01/2025 |
| Rensselaer | Buskirk | −26.1 | 22/01/2025 |
| Wyoming | Warsaw 6 SW | −26.1 | 22/01/2025 |
| Clinton | Dannemora | −25.6 | 02/02/2025 |
| Madison | Morrisville 6 SW | −25.6 | 23/01/2025 |
Los 20 valores más extremos de 52.
Fuente: NOAA NCEI
Índices de extremos climáticos (promedio estatal)
| Índice | Descripción | Valor | Normal | Diferencia | Unidad |
|---|---|---|---|---|---|
| TX90p | Días cálidos (máxima > percentil 90) | 12.4 | 10.0 | 2.4 | % |
| TN90p | Noches cálidas (mínima > percentil 90) | 10.4 | 10.0 | 0.4 | % |
| TX10p | Días frescos (máxima < percentil 10) | 9.2 | 10.0 | −0.8 | % |
| TN10p | Noches frías (mínima < percentil 10) | 7.4 | 10.0 | −2.6 | % |
| FD | Días con helada (mínima < 0 °C) | 151.5 | 147.1 | 4.4 | d |
| SU | Días de verano (máxima > 25 °C) | 75.0 | 67.8 | 7.2 | d |
| TR | Noches tropicales (mínima > 20 °C) | 6.6 | 4.2 | 2.3 | d |
| WSDI | Días en rachas cálidas (≥ 6 días) | 0.7 | — | — | d |
| CSDI | Días en rachas frías (≥ 6 días) | 1.7 | — | — | d |
| Rx1day | Lluvia máxima en 1 día | 40.3 | 53.4 | −13.1 | mm |
| Rx5day | Lluvia máxima en 5 días | 71.3 | 85.6 | −14.3 | mm |
| CDD | Días secos consecutivos (< 1 mm) | 15.3 | 13.7 | 1.7 | d |
| CWD | Días húmedos consecutivos (≥ 1 mm) | 8.0 | 7.5 | 0.5 | d |
Índices de percentil respecto a los percentiles diarios de 1991–2020 (ventana de 5 días); conteos y máximos promediados sobre las celdas del estado.
Fuente: NOAA NCEI
Días con helada por región
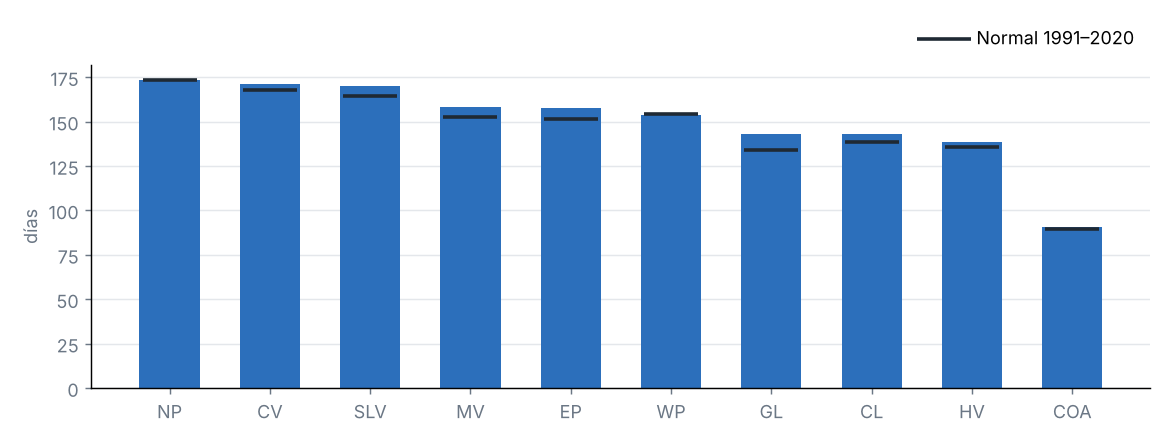
Fuente: NOAA NCEI
Ondas de calor y frío
| Fechas | Tipo | Detalles |
|---|---|---|
| 15/03/2025 – 17/03/2025 | Onda de calor | Hasta el 96 % del estado sobre el percentil 90 de la máxima. Regiones: Meseta occidental, Meseta oriental, Meseta norte, Valle del Hudson, Valle del Mohawk, Valle del Champlain, Valle del San Lorenzo, Grandes Lagos y Lagos centrales. |
| 29/07/2025 – 31/07/2025 | Onda de calor | Hasta el 100 % del estado sobre el percentil 90 de la máxima. Regiones: Meseta occidental, Meseta oriental, Meseta norte, Costa, Valle del Hudson, Valle del Mohawk, Valle del Champlain, Grandes Lagos y Lagos centrales. |
| 01/08/2025 – 03/08/2025 | Onda fría | Hasta el 100 % del estado bajo el percentil 10 de la mínima. Regiones: Meseta occidental, Meseta oriental, Meseta norte, Costa, Valle del Hudson, Valle del Mohawk, Valle del Champlain, Valle del San Lorenzo, Grandes Lagos y Lagos centrales. |
| 10/08/2025 – 14/08/2025 | Onda de calor | Hasta el 97 % del estado sobre el percentil 90 de la máxima. Regiones: Meseta occidental, Meseta oriental, Meseta norte, Valle del Hudson, Valle del Mohawk, Valle del Champlain, Valle del San Lorenzo, Grandes Lagos y Lagos centrales. |
| 28/08/2025 – 31/08/2025 | Onda fría | Hasta el 75 % del estado bajo el percentil 10 de la mínima. Regiones: Meseta occidental, Meseta oriental, Meseta norte, Costa, Valle del Hudson, Valle del Mohawk, Grandes Lagos y Lagos centrales. |
| 08/09/2025 – 10/09/2025 | Onda fría | Hasta el 84 % del estado bajo el percentil 10 de la mínima. Regiones: Meseta occidental, Meseta oriental, Meseta norte, Valle del Hudson, Valle del Mohawk, Grandes Lagos y Lagos centrales. |
| 29/09/2025 – 01/10/2025 | Onda de calor | Hasta el 84 % del estado sobre el percentil 90 de la máxima. Regiones: Meseta occidental, Meseta oriental, Meseta norte, Costa, Valle del Hudson, Valle del Mohawk, Valle del Champlain y Lagos centrales. |
| 05/10/2025 – 07/10/2025 | Onda de calor | Hasta el 100 % del estado sobre el percentil 90 de la máxima. Regiones: Meseta occidental, Meseta oriental, Meseta norte, Costa, Valle del Hudson, Valle del Mohawk, Valle del Champlain, Valle del San Lorenzo, Grandes Lagos y Lagos centrales. |
Onda: al menos 3 días consecutivos con al menos la mitad del estado por encima del percentil 90 de la máxima (calor) o por debajo del percentil 10 de la mínima (frío). Se listan como máximo las 10 más intensas.
Fuente: NOAA NCEI
6 Sequía
Monitor de Sequía de EE. UU., 30 de diciembre de 2025
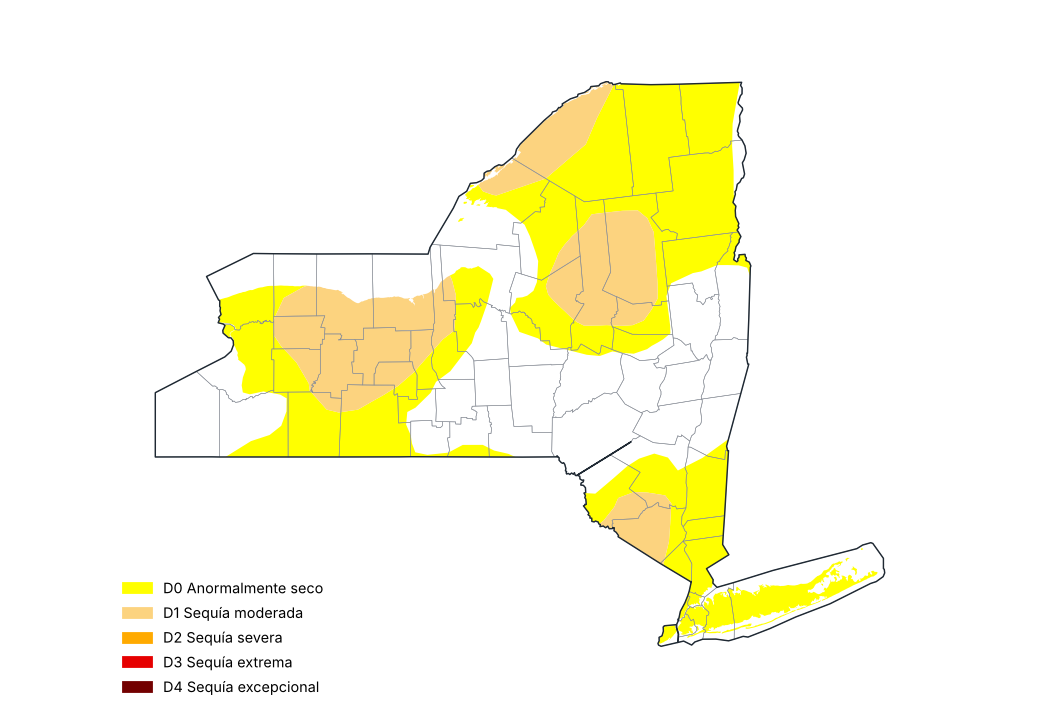
Fuente: National Drought Mitigation Center, USDA, NOAA
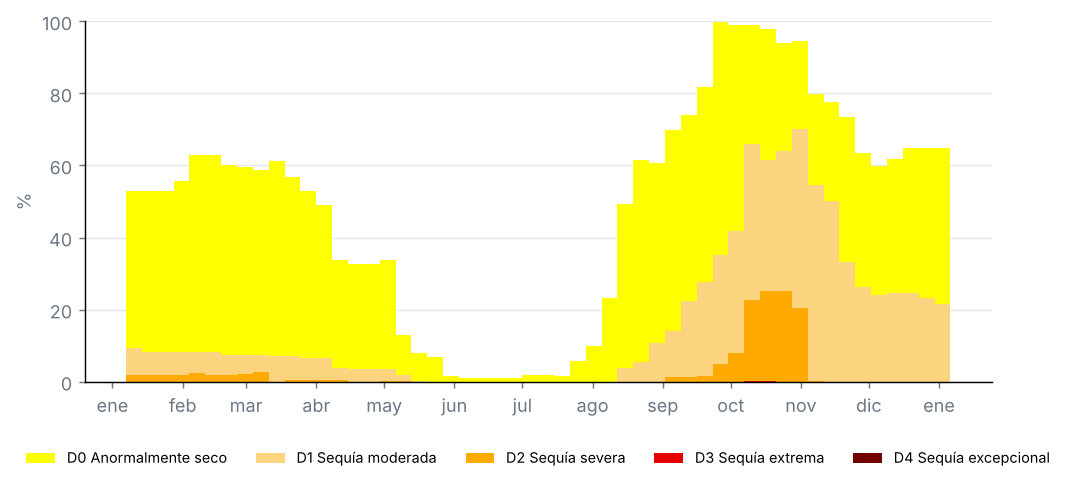
Proporción del estado por categoría de sequía, mapas semanales del Monitor de Sequía de EE. UU. (%)
Fuente: National Drought Mitigation Center, USDA, NOAA
Condados con la sequía más severa, Monitor de Sequía de EE. UU. del 30 de diciembre de 2025 (% del condado)
| Condado | D0–D4 (%) | D1–D4 (%) | D2–D4 (%) | D3–D4 (%) | D4 (%) |
|---|---|---|---|---|---|
| Livingston | 100.0 | 100.0 | 0.0 | 0.0 | 0.0 |
| Monroe | 100.0 | 100.0 | 0.0 | 0.0 | 0.0 |
| Ontario | 100.0 | 100.0 | 0.0 | 0.0 | 0.0 |
| Wayne | 100.0 | 100.0 | 0.0 | 0.0 | 0.0 |
| Genesee | 100.0 | 96.0 | 0.0 | 0.0 | 0.0 |
| Orange | 100.0 | 78.1 | 0.0 | 0.0 | 0.0 |
| Orleans | 100.0 | 72.3 | 0.0 | 0.0 | 0.0 |
| Hamilton | 99.8 | 71.1 | 0.0 | 0.0 | 0.0 |
| Herkimer | 100.0 | 67.5 | 0.0 | 0.0 | 0.0 |
| Yates | 100.0 | 66.1 | 0.0 | 0.0 | 0.0 |
Proporciones acumuladas: D1–D4 es la proporción con sequía moderada o peor.
Fuente: National Drought Mitigation Center, USDA, NOAA
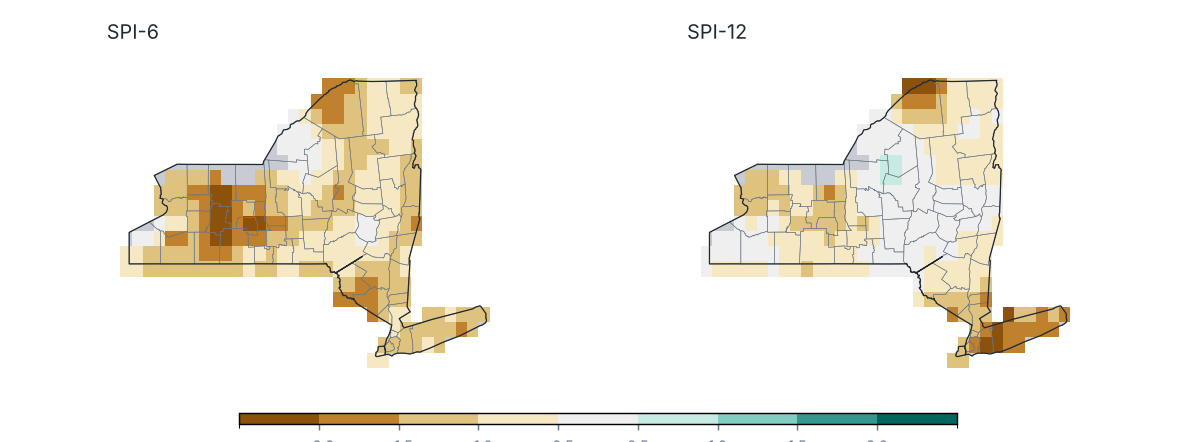
Índice Estandarizado de Precipitación (SPI) al cierre de diciembre 2025
Fuente: NOAA NCEI
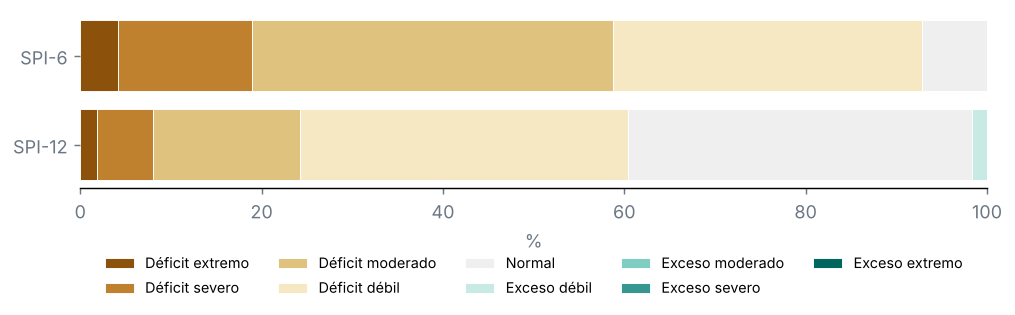
Porcentaje del territorio por categoría de SPI
Fuente: NOAA NCEI
Condados con el SPI-12 más bajo
| Condado | SPI-6 | SPI-12 | Categoría |
|---|---|---|---|
| Nassau | −1.1 | −1.9 | Déficit severo |
| Suffolk | −1.2 | −1.7 | Déficit severo |
| Queens | −1.1 | −1.6 | Déficit severo |
| Kings | −1.1 | −1.5 | Déficit severo |
| Rockland | −1.3 | −1.4 | Déficit moderado |
| Bronx | −1.0 | −1.4 | Déficit moderado |
| New York | −1.0 | −1.4 | Déficit moderado |
| Westchester | −0.9 | −1.4 | Déficit moderado |
| Putnam | −1.1 | −1.4 | Déficit moderado |
| Richmond | −1.0 | −1.4 | Déficit moderado |
Fuente: NOAA NCEI
Monitor de Sequía de EE. UU., mapa del 30 de diciembre de 2025: el 22 % del estado con sequía (D1–D4), el 0 % con sequía severa o peor (D2–D4) y el 0 % con sequía extrema o excepcional (D3–D4); el 65 % estaba anormalmente seco o con sequía (D0–D4).
En el mapa del 31 de diciembre de 2024, el 14 % del estado estaba con sequía: un cambio de +8 puntos en el periodo.
SPI-12 (Ene–Dic 2025): promedio estatal de −0.67; el 24 % del estado con sequía (SPI ≤ −1.0) y el 8 % con sequía severa o extrema.
Condados más afectados: Nassau (−1.93), Suffolk (−1.70) y Queens (−1.60).
SPI-6 (Jul–Dic 2025): el 59 % del estado con sequía.
7 Eventos notables y tiempo severo
Ningún ciclón tropical se acercó a menos de 300 km del estado.
9 Perspectivas
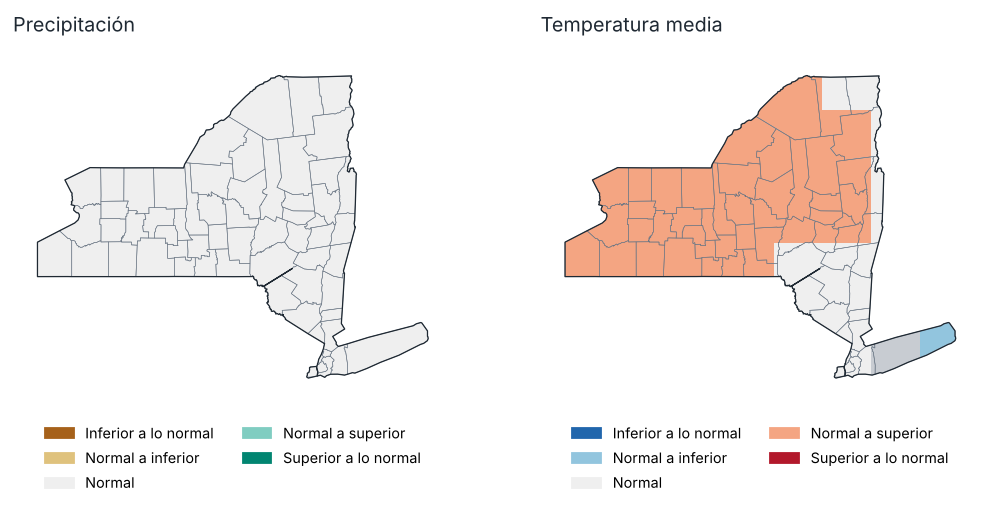
Perspectiva para Ene–Mar 2026: tercil más probable
Fuente: NOAA CPC
Probabilidad de cada tercil por región, Ene–Mar 2026 (%)
| Región | Precipitación: inferior | Precipitación: normal | Precipitación: superior | Temp.: inferior | Temp.: normal | Temp.: superior |
|---|---|---|---|---|---|---|
| Meseta occidental | 30.0 | 36.0 | 34.0 | 22.0 | 35.0 | 44.0 |
| Meseta oriental | 33.0 | 35.0 | 33.0 | 24.0 | 37.0 | 39.0 |
| Meseta norte | 31.0 | 36.0 | 34.0 | 23.0 | 35.0 | 42.0 |
| Costa | 37.0 | 35.0 | 28.0 | 36.0 | 35.0 | 29.0 |
| Valle del Hudson | 34.0 | 34.0 | 33.0 | 26.0 | 36.0 | 38.0 |
| Valle del Mohawk | 31.0 | 34.0 | 34.0 | 23.0 | 36.0 | 41.0 |
| Valle del Champlain | 32.0 | 34.0 | 34.0 | 26.0 | 34.0 | 41.0 |
| Valle del San Lorenzo | 31.0 | 36.0 | 33.0 | 25.0 | 33.0 | 42.0 |
| Grandes Lagos | 31.0 | 34.0 | 35.0 | 20.0 | 35.0 | 45.0 |
| Lagos centrales | 30.0 | 34.0 | 36.0 | 22.0 | 35.0 | 44.0 |
Fuente: NOAA CPC
Perspectiva probabilística del conjunto multimodelo norteamericano (NMME), inicializada en enero 2026, respecto a los terciles de 1991–2020. No es un pronóstico oficial: consulte al National Weather Service y al Climate Prediction Center de la NOAA.
Precipitación, Ene–Mar 2026: se favorece un valor superior a lo normal en el 0 % del estado e inferior a lo normal en el 0 %.
Temperatura media, Ene–Mar 2026: se favorece un valor superior a lo normal en el 76 % del estado e inferior a lo normal en el 2 %.
10 Anexos
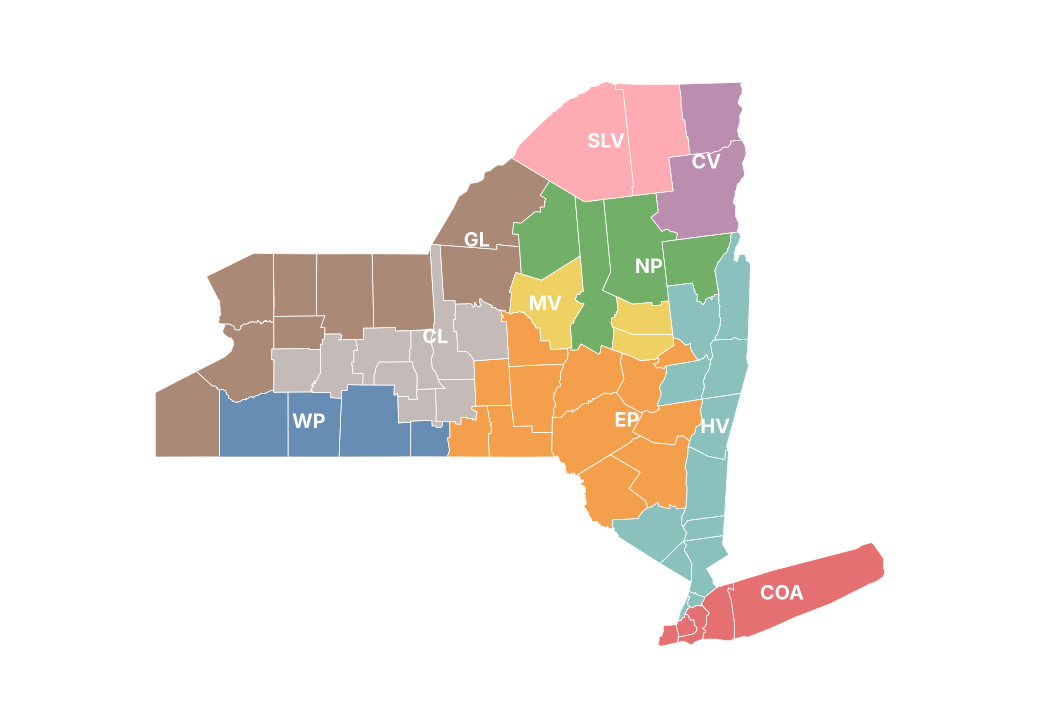
Regiones climáticas del reporte
Precipitación mensual por condado (mm)
| Condado | Ene | Feb | Mar | Abr | May | Jun | Jul | Ago | Sep | Oct | Nov | Dic |
|---|---|---|---|---|---|---|---|---|---|---|---|---|
| Albany | 29.0 | 61.7 | 54.8 | 85.8 | 183.9 | 118.8 | 66.4 | 50.3 | 98.1 | 99.5 | 64.5 | 81.3 |
| Allegany | 31.2 | 66.5 | 54.5 | 95.3 | 147.8 | 118.8 | 67.8 | 60.0 | 30.7 | 98.2 | 86.0 | 68.3 |
| Bronx | 14.2 | 65.8 | 121.8 | 74.8 | 145.8 | 63.2 | 100.1 | 46.1 | 63.5 | 119.1 | 48.2 | 84.7 |
| Broome | 41.5 | 79.8 | 58.6 | 81.1 | 171.5 | 122.3 | 110.5 | 63.3 | 65.1 | 108.5 | 60.4 | 81.7 |
| Cattaraugus | 56.6 | 77.3 | 58.0 | 112.4 | 155.5 | 137.1 | 64.3 | 59.6 | 30.6 | 133.0 | 111.7 | 101.0 |
| Cayuga | 45.3 | 87.2 | 41.8 | 86.8 | 146.6 | 102.1 | 60.0 | 79.2 | 36.8 | 95.2 | 82.6 | 87.2 |
| Chautauqua | 59.8 | 67.7 | 48.3 | 110.4 | 130.3 | 119.1 | 63.1 | 66.3 | 43.7 | 160.0 | 94.0 | 126.7 |
| Chemung | 19.2 | 67.0 | 42.2 | 78.2 | 148.7 | 98.6 | 65.3 | 71.1 | 52.6 | 118.6 | 39.3 | 55.0 |
| Chenango | 44.8 | 80.8 | 55.2 | 87.0 | 165.8 | 174.9 | 77.0 | 79.0 | 64.5 | 108.2 | 88.3 | 88.1 |
| Clinton | 45.4 | 90.4 | 61.3 | 81.3 | 106.4 | 61.9 | 75.9 | 50.1 | 60.7 | 108.2 | 85.9 | 61.9 |
| Columbia | 30.1 | 59.9 | 59.8 | 91.0 | 173.2 | 83.1 | 85.7 | 64.6 | 78.9 | 106.1 | 61.2 | 79.0 |
| Cortland | 38.0 | 87.1 | 57.8 | 85.4 | 147.2 | 142.4 | 72.8 | 73.9 | 46.3 | 110.9 | 87.6 | 84.7 |
| Delaware | 37.8 | 69.2 | 61.9 | 78.9 | 181.7 | 141.8 | 98.5 | 87.4 | 91.9 | 106.1 | 78.6 | 82.1 |
| Dutchess | 21.6 | 52.8 | 66.6 | 82.0 | 195.9 | 89.8 | 116.6 | 63.0 | 53.6 | 116.1 | 52.1 | 78.2 |
| Erie | 56.3 | 61.2 | 47.9 | 99.5 | 120.7 | 74.7 | 61.8 | 66.3 | 28.2 | 141.7 | 86.7 | 109.2 |
| Essex | 42.4 | 101.1 | 92.9 | 85.6 | 134.5 | 72.4 | 100.1 | 54.9 | 76.0 | 109.6 | 96.3 | 89.2 |
| Franklin | 48.2 | 90.3 | 71.8 | 86.3 | 106.1 | 75.1 | 89.6 | 58.2 | 70.7 | 108.4 | 109.3 | 83.0 |
| Fulton | 47.1 | 100.7 | 79.4 | 107.5 | 190.7 | 124.7 | 78.2 | 50.2 | 99.8 | 125.5 | 92.7 | 98.9 |
| Genesee | 33.9 | 66.7 | 45.6 | 84.0 | 124.3 | 81.4 | 42.2 | 55.8 | 19.4 | 109.2 | 80.3 | 82.3 |
| Greene | 26.8 | 63.5 | 60.9 | 83.4 | 195.6 | 109.2 | 75.0 | 76.3 | 94.7 | 97.7 | 71.7 | 93.7 |
| Hamilton | 50.4 | 113.4 | 104.2 | 95.5 | 145.7 | 91.2 | 129.6 | 58.1 | 73.4 | 104.6 | 93.9 | 100.5 |
| Herkimer | 81.9 | 109.5 | 83.9 | 91.6 | 152.7 | 136.2 | 99.3 | 49.3 | 67.0 | 96.6 | 131.1 | 105.6 |
| Jefferson | 76.5 | 85.6 | 69.6 | 84.9 | 108.9 | 113.7 | 74.4 | 79.4 | 43.7 | 121.1 | 125.3 | 107.6 |
| Kings | 16.6 | 72.3 | 120.8 | 75.1 | 139.3 | 65.3 | 92.6 | 48.7 | 64.1 | 108.8 | 49.1 | 85.8 |
| Lewis | 103.5 | 107.8 | 80.1 | 99.9 | 132.3 | 119.4 | 109.2 | 55.9 | 58.1 | 106.8 | 149.0 | 118.2 |
| Livingston | 23.7 | 52.9 | 39.2 | 84.5 | 133.8 | 106.1 | 58.6 | 49.2 | 21.6 | 96.6 | 69.0 | 58.3 |
| Madison | 50.5 | 91.7 | 54.5 | 92.2 | 156.2 | 171.1 | 65.4 | 80.1 | 56.8 | 97.8 | 117.1 | 89.4 |
| Monroe | 29.4 | 64.6 | 49.8 | 77.9 | 121.4 | 108.0 | 38.4 | 53.2 | 14.5 | 83.6 | 72.3 | 72.8 |
| Montgomery | 38.5 | 73.3 | 66.0 | 90.2 | 175.6 | 129.2 | 68.6 | 53.3 | 96.5 | 104.4 | 87.3 | 81.9 |
| Nassau | 11.8 | 66.6 | 102.9 | 64.0 | 125.9 | 57.0 | 106.3 | 44.8 | 61.4 | 106.3 | 43.9 | 77.9 |
| New York | 16.3 | 68.7 | 122.2 | 79.5 | 147.8 | 65.8 | 93.6 | 47.4 | 61.3 | 112.9 | 49.5 | 85.3 |
| Niagara | 30.3 | 58.2 | 40.3 | 88.3 | 87.4 | 61.7 | 37.6 | 50.5 | 22.4 | 113.6 | 76.0 | 87.7 |
| Oneida | 86.0 | 121.2 | 70.2 | 92.7 | 148.3 | 155.2 | 93.2 | 49.0 | 63.1 | 93.3 | 133.9 | 116.4 |
| Onondaga | 55.7 | 101.2 | 42.2 | 92.0 | 149.5 | 111.3 | 63.5 | 77.3 | 53.8 | 94.4 | 109.4 | 97.9 |
| Ontario | 22.6 | 55.2 | 38.3 | 72.9 | 132.0 | 89.1 | 64.1 | 62.4 | 23.8 | 91.3 | 62.0 | 58.8 |
| Orange | 19.3 | 60.3 | 80.5 | 82.4 | 228.0 | 96.4 | 86.0 | 44.9 | 55.4 | 93.4 | 49.5 | 65.0 |
| Orleans | 38.3 | 67.8 | 44.5 | 83.4 | 104.7 | 69.0 | 29.7 | 46.0 | 17.7 | 103.6 | 85.2 | 78.7 |
| Oswego | 88.9 | 125.1 | 57.3 | 90.6 | 141.5 | 110.1 | 77.2 | 63.2 | 56.9 | 112.7 | 125.1 | 119.9 |
| Otsego | 47.4 | 73.8 | 68.5 | 84.3 | 171.2 | 165.8 | 73.1 | 74.6 | 81.6 | 104.5 | 103.0 | 79.9 |
| Putnam | 21.2 | 58.4 | 78.1 | 78.2 | 169.3 | 69.6 | 123.5 | 53.4 | 49.0 | 133.0 | 47.4 | 92.4 |
| Queens | 15.7 | 73.6 | 120.7 | 70.5 | 132.6 | 63.8 | 89.2 | 46.6 | 67.8 | 108.9 | 48.5 | 85.4 |
| Rensselaer | 37.4 | 65.3 | 67.1 | 109.4 | 185.1 | 110.9 | 83.0 | 36.1 | 87.7 | 110.4 | 71.5 | 79.0 |
| Richmond | 19.5 | 70.0 | 106.6 | 82.0 | 150.0 | 64.6 | 120.2 | 47.6 | 62.3 | 111.2 | 49.1 | 85.3 |
| Rockland | 17.5 | 64.2 | 93.2 | 79.1 | 167.9 | 69.5 | 118.5 | 48.9 | 55.2 | 127.4 | 44.5 | 79.1 |
| St. Lawrence | 46.4 | 75.5 | 74.5 | 76.8 | 87.2 | 97.5 | 80.7 | 50.3 | 48.1 | 100.8 | 97.3 | 80.4 |
| Saratoga | 28.6 | 90.0 | 74.6 | 112.1 | 192.2 | 107.6 | 70.9 | 40.1 | 99.5 | 128.6 | 70.6 | 94.8 |
| Schenectady | 30.5 | 70.4 | 57.0 | 96.2 | 182.7 | 120.1 | 68.8 | 42.0 | 102.9 | 109.6 | 67.1 | 82.8 |
| Schoharie | 30.5 | 62.7 | 64.3 | 74.6 | 167.2 | 126.7 | 79.8 | 74.5 | 104.1 | 88.2 | 82.3 | 84.3 |
| Schuyler | 17.6 | 63.6 | 37.4 | 79.0 | 143.2 | 104.4 | 76.2 | 62.6 | 39.7 | 97.7 | 45.8 | 50.2 |
| Seneca | 19.7 | 61.1 | 34.3 | 79.8 | 142.9 | 90.0 | 68.7 | 68.6 | 28.7 | 82.6 | 57.3 | 65.1 |
| Steuben | 20.1 | 64.0 | 41.2 | 81.4 | 142.3 | 107.1 | 64.1 | 62.2 | 40.6 | 98.8 | 54.9 | 50.6 |
| Suffolk | 24.1 | 79.9 | 94.0 | 60.4 | 152.1 | 43.0 | 89.2 | 37.8 | 49.5 | 127.0 | 55.6 | 75.4 |
| Sullivan | 28.7 | 57.0 | 70.6 | 96.3 | 261.0 | 122.9 | 88.5 | 69.9 | 81.7 | 95.7 | 62.4 | 73.8 |
| Tioga | 31.9 | 72.3 | 54.0 | 77.3 | 152.0 | 114.2 | 86.8 | 65.8 | 49.6 | 121.4 | 45.2 | 76.3 |
| Tompkins | 23.7 | 71.6 | 51.0 | 70.7 | 141.7 | 136.1 | 75.0 | 64.9 | 38.1 | 112.3 | 59.0 | 66.0 |
| Ulster | 27.7 | 63.0 | 68.4 | 110.7 | 241.3 | 119.3 | 98.1 | 59.9 | 84.8 | 96.0 | 71.2 | 83.3 |
| Warren | 25.9 | 95.1 | 95.8 | 86.5 | 165.4 | 81.5 | 87.4 | 55.6 | 82.9 | 120.0 | 67.5 | 91.6 |
| Washington | 25.8 | 73.6 | 75.9 | 95.2 | 181.0 | 90.2 | 66.9 | 37.8 | 72.7 | 121.5 | 70.4 | 80.6 |
| Wayne | — | — | — | — | — | — | — | — | — | — | — | — |
| Westchester | 14.7 | 59.6 | 95.6 | 71.6 | 155.9 | 60.0 | 134.0 | 54.4 | 58.7 | 137.6 | 42.2 | 86.1 |
| Wyoming | 43.1 | 64.2 | 50.8 | 101.3 | 145.2 | 98.5 | 60.1 | 54.4 | 23.4 | 134.9 | 98.9 | 89.4 |
| Yates | 17.3 | 55.3 | 35.1 | 81.9 | 141.0 | 93.8 | 84.7 | 47.1 | 22.6 | 73.8 | 53.0 | 52.2 |
Fuente: NOAA NCEI
Temperatura máxima mensual por región (°C)
| Región | Ene | Feb | Mar | Abr | May | Jun | Jul | Ago | Sep | Oct | Nov | Dic |
|---|---|---|---|---|---|---|---|---|---|---|---|---|
| Meseta occidental | −2.9 | −0.2 | 10.2 | 14.6 | 18.2 | 25.6 | 28.8 | 25.4 | 23.8 | 16.5 | 7.1 | 0.2 |
| Meseta oriental | −2.5 | −0.3 | 9.5 | 14.2 | 17.9 | 24.7 | 28.4 | 25.2 | 23.0 | 15.9 | 6.8 | −0.2 |
| Meseta norte | −4.0 | −2.6 | 6.5 | 11.9 | 16.9 | 23.1 | 27.0 | 24.7 | 21.7 | 14.9 | 4.2 | −2.1 |
| Costa | 3.1 | 5.1 | 12.2 | 16.0 | 20.0 | 26.1 | 29.7 | 27.2 | 24.9 | 18.8 | 12.1 | 5.2 |
| Valle del Hudson | −0.1 | 1.4 | 10.9 | 15.7 | 19.8 | 26.1 | 29.9 | 26.9 | 24.3 | 17.4 | 8.5 | 1.4 |
| Valle del Mohawk | −2.6 | −1.2 | 8.5 | 13.7 | 18.2 | 24.8 | 28.8 | 26.3 | 23.5 | 16.2 | 6.3 | −0.6 |
| Valle del Champlain | −4.7 | −3.2 | 6.7 | 11.6 | 17.0 | 23.7 | 26.7 | 24.4 | 21.3 | 14.8 | 3.7 | −2.4 |
| Valle del San Lorenzo | −4.3 | −3.0 | 6.9 | 12.6 | 18.0 | 24.3 | 27.7 | 25.5 | 22.2 | 15.4 | 3.5 | −2.0 |
| Grandes Lagos | −2.4 | −0.9 | 9.5 | 13.7 | 17.5 | 25.1 | 28.3 | 25.8 | 23.3 | 16.4 | 6.9 | 0.5 |
| Lagos centrales | −2.2 | −0.3 | 10.1 | 14.2 | 17.8 | 25.4 | 28.6 | 25.7 | 23.5 | 16.3 | 7.2 | 0.4 |
Fuente: NOAA NCEI
Temperatura media mensual por región (°C)
| Región | Ene | Feb | Mar | Abr | May | Jun | Jul | Ago | Sep | Oct | Nov | Dic |
|---|---|---|---|---|---|---|---|---|---|---|---|---|
| Meseta occidental | −6.6 | −4.3 | 3.6 | 8.0 | 12.8 | 19.6 | 22.1 | 18.2 | 16.1 | 9.7 | 2.8 | −4.7 |
| Meseta oriental | −6.6 | −4.7 | 3.2 | 7.4 | 12.8 | 18.8 | 22.0 | 18.2 | 15.9 | 9.4 | 2.4 | −5.0 |
| Meseta norte | −8.3 | −7.9 | 0.2 | 5.3 | 11.6 | 17.4 | 20.6 | 17.8 | 14.8 | 8.6 | 0.3 | −7.6 |
| Costa | −0.7 | 1.1 | 6.9 | 11.1 | 15.6 | 21.5 | 25.2 | 22.0 | 20.1 | 14.2 | 7.6 | 0.8 |
| Valle del Hudson | −4.6 | −3.3 | 4.6 | 9.3 | 14.7 | 20.5 | 23.9 | 20.2 | 17.6 | 11.3 | 3.9 | −3.3 |
| Valle del Mohawk | −6.8 | −5.8 | 2.4 | 7.0 | 12.9 | 18.9 | 22.2 | 19.2 | 16.4 | 9.9 | 2.1 | −5.7 |
| Valle del Champlain | −9.1 | −8.6 | 0.4 | 5.2 | 11.8 | 17.9 | 20.7 | 18.0 | 14.9 | 8.8 | 0.1 | −7.9 |
| Valle del San Lorenzo | −8.6 | −8.5 | 0.5 | 5.8 | 12.5 | 18.4 | 21.2 | 18.6 | 15.3 | 9.1 | −0.1 | −7.8 |
| Grandes Lagos | −5.8 | −4.9 | 3.4 | 7.7 | 12.8 | 19.9 | 22.6 | 19.7 | 16.9 | 10.7 | 3.2 | −4.0 |
| Lagos centrales | −5.7 | −4.2 | 3.8 | 7.9 | 13.0 | 19.9 | 22.6 | 19.4 | 16.8 | 10.4 | 3.3 | −3.9 |
Fuente: NOAA NCEI
Temperatura mínima mensual por región (°C)
| Región | Ene | Feb | Mar | Abr | May | Jun | Jul | Ago | Sep | Oct | Nov | Dic |
|---|---|---|---|---|---|---|---|---|---|---|---|---|
| Meseta occidental | −10.3 | −8.5 | −3.0 | 1.3 | 7.5 | 13.7 | 15.5 | 11.0 | 8.5 | 3.0 | −1.5 | −9.6 |
| Meseta oriental | −10.7 | −9.0 | −3.1 | 0.6 | 7.6 | 12.8 | 15.6 | 11.2 | 8.9 | 3.0 | −1.9 | −9.7 |
| Meseta norte | −12.7 | −13.3 | −6.1 | −1.4 | 6.4 | 11.7 | 14.3 | 10.9 | 7.9 | 2.3 | −3.5 | −13.1 |
| Costa | −4.6 | −2.8 | 1.7 | 6.2 | 11.1 | 16.9 | 20.8 | 16.7 | 15.3 | 9.6 | 3.1 | −3.5 |
| Valle del Hudson | −9.1 | −8.0 | −1.7 | 2.8 | 9.6 | 14.8 | 17.9 | 13.4 | 10.8 | 5.2 | −0.7 | −8.0 |
| Valle del Mohawk | −11.0 | −10.5 | −3.8 | 0.2 | 7.6 | 13.0 | 15.7 | 12.2 | 9.2 | 3.5 | −2.1 | −10.7 |
| Valle del Champlain | −13.5 | −14.1 | −5.9 | −1.2 | 6.7 | 12.1 | 14.7 | 11.5 | 8.6 | 2.9 | −3.6 | −13.5 |
| Valle del San Lorenzo | −13.0 | −14.1 | −6.0 | −0.9 | 7.1 | 12.5 | 14.8 | 11.6 | 8.5 | 2.8 | −3.7 | −13.5 |
| Grandes Lagos | −9.1 | −8.9 | −2.6 | 1.7 | 8.1 | 14.8 | 16.9 | 13.7 | 10.4 | 5.0 | −0.6 | −8.5 |
| Lagos centrales | −9.2 | −8.0 | −2.4 | 1.5 | 8.1 | 14.4 | 16.5 | 13.1 | 10.0 | 4.5 | −0.6 | −8.2 |
Fuente: NOAA NCEI
Estaciones utilizadas
| Clave | Nombre | Condado | Latitud | Longitud | Altitud (m) | Días con datos (Tmáx) (%) |
|---|---|---|---|---|---|---|
| USC00300055 | Albion | Orleans | 43.2 | −78.2 | 183.8 | 99.0 |
| USC00300063 | Alcove Dam | Albany | 42.5 | −73.9 | 191.4 | 90.0 |
| USC00300085 | Alfred | Allegany | 42.3 | −77.8 | 586.4 | 99.0 |
| USC00300093 | Allegany Sp | Cattaraugus | 42.1 | −78.7 | 457.2 | 100.0 |
| USC00300183 | Angelica | Allegany | 42.3 | −78.0 | 449.6 | 100.0 |
| USC00300220 | Arcade | Wyoming | 42.5 | −78.5 | 434.9 | 0.0 |
| USC00300317 | Attica 7 SW | Wyoming | 42.8 | −78.4 | 416.1 | 0.0 |
| USC00300321 | Auburn | Cayuga | 42.9 | −76.5 | 234.7 | 100.0 |
| USC00300343 | Avon | Livingston | 42.9 | −77.8 | 166.1 | 100.0 |
| USC00300364 | Baiting Hollow | Suffolk | 40.9 | −72.7 | 21.3 | 93.0 |
| USC00300379 | Baldwinsville | Onondaga | 43.1 | −76.3 | 115.5 | 0.0 |
| USC00300443 | Batavia | Genesee | 43.0 | −78.2 | 278.3 | 100.0 |
| USC00300500 | Beaver Falls | Lewis | 43.9 | −75.4 | 225.6 | 0.0 |
| USC00300608 | Bennetts Brg | Oswego | 43.5 | −76.0 | 201.2 | 0.0 |
| USC00300668 | Big Moose 3 SE | Herkimer | 43.8 | −74.9 | 591.3 | 37.0 |
| USC00300707 | Black Rvr | Jefferson | 44.0 | −75.8 | 158.5 | 0.0 |
| USC00300785 | Boonville 4 SSW | Oneida | 43.4 | −75.4 | 472.4 | 100.0 |
| USC00300870 | Brewerton Lock 23 | Onondaga | 43.2 | −76.2 | 114.9 | 96.0 |
| USC00300889 | Bridgehampton | Suffolk | 41.0 | −72.3 | 12.8 | 97.0 |
| USC00300910 | Bristol Harbour | Ontario | 42.7 | −77.3 | 286.5 | 0.0 |
| USC00300937 | Brockport | Monroe | 43.2 | −78.0 | 151.8 | 100.0 |
| USC00301068 | Buskirk | Rensselaer | 42.9 | −73.4 | 152.1 | 100.0 |
| USC00301102 | Callicoon Ctr | Sullivan | 41.8 | −75.0 | 372.2 | 100.0 |
| USC00301110 | Camden | Oneida | 43.3 | −75.8 | 176.8 | 38.0 |
| USC00301152 | Canandaigua 3 S | Ontario | 42.8 | −77.3 | 219.5 | 100.0 |
| USC00301211 | Carmel 4N | Putnam | 41.5 | −73.7 | 207.3 | 19.0 |
| USC00301264 | Cattaraugus 3W | Cattaraugus | 42.3 | −78.9 | 520.6 | 0.0 |
| USC00301265 | Cayuga Lock #1 | Cayuga | 42.9 | −76.7 | 115.8 | 0.0 |
| USC00301309 | Centerport | Suffolk | 40.9 | −73.4 | 9.1 | 100.0 |
| USC00301388 | Chases Lake | Lewis | 43.8 | −75.3 | 390.4 | 0.0 |
| USC00301580 | Clyde Lock 26 | Wayne | 43.1 | −76.8 | 119.5 | 0.0 |
| USC00301625 | Colden 1W | Erie | 42.6 | −78.7 | 467.9 | 100.0 |
| USC00301664 | Colton 2 N | St. Lawrence | 44.6 | −75.0 | 176.8 | 92.0 |
| USC00301708 | Conklingville Dam | Saratoga | 43.3 | −73.9 | 246.3 | 100.0 |
| USC00301752 | Cooperstown | Otsego | 42.7 | −74.9 | 383.1 | 100.0 |
| USC00301787 | Corning | Steuben | 42.1 | −77.1 | 349.6 | 100.0 |
| USC00301966 | Dannemora | Clinton | 44.7 | −73.7 | 408.4 | 91.0 |
| USC00301974 | Dansville | Livingston | 42.6 | −77.7 | 201.2 | 100.0 |
| USC00302036 | Delhi 2 SE | Delaware | 42.3 | −74.9 | 445.0 | 95.0 |
| USC00302169 | Downsville Dam | Delaware | 42.1 | −75.0 | 365.8 | 75.0 |
| USC00302197 | Dunkirk | Chautauqua | 42.5 | −79.3 | 192.3 | 100.0 |
| USC00302454 | E Sidney | Delaware | 42.3 | −75.2 | 352.0 | 100.0 |
| USC00302554 | Elizabethtown | Essex | 44.2 | −73.6 | 186.2 | 0.0 |
| USC00302610 | Elmira | Chemung | 42.1 | −76.8 | 288.6 | 100.0 |
| USC00302934 | Ft Drum | Jefferson | 44.1 | −75.7 | 213.4 | 0.0 |
| USC00303025 | Franklinville | Cattaraugus | 42.3 | −78.5 | 484.6 | 84.0 |
| USC00303050 | Freeville 1 NE | Tompkins | 42.5 | −76.3 | 317.6 | 100.0 |
| USC00303087 | Fulton | Oswego | 43.3 | −76.4 | 109.7 | 100.0 |
| USC00303088 | Fulton Lock O-3 | Oswego | 43.3 | −76.4 | 102.4 | 0.0 |
| USC00303184 | Geneva Rsch Farm | Ontario | 42.9 | −77.0 | 218.8 | 99.0 |
| USC00303322 | Gloversville 7NW (Peck Lake) | Fulton | 43.1 | −74.4 | 443.5 | 99.0 |
| USC00303346 | Gouverneur 3 NW | St. Lawrence | 44.4 | −75.5 | 128.0 | 88.0 |
| USC00303444 | Greene | Chenango | 42.3 | −75.8 | 280.4 | 0.0 |
| USC00303773 | Hemlock | Livingston | 42.8 | −77.6 | 274.9 | 100.0 |
| USC00303851 | Highmarket 2W | Lewis | 43.6 | −75.6 | 549.9 | 100.0 |
| USC00303955 | Honeoye | Ontario | 42.8 | −77.5 | 243.8 | 100.0 |
| USC00303961 | Hooker 12 NNW | Lewis | 43.9 | −75.7 | 450.5 | 0.0 |
| USC00303983 | Hornell Almond Dam | Steuben | 42.3 | −77.7 | 403.9 | 100.0 |
| USC00304025 | Hudson Correctional Facility | Columbia | 42.2 | −73.8 | 9.1 | 97.0 |
| USC00304102 | Indian Lake 2SW | Hamilton | 43.8 | −74.3 | 509.0 | 100.0 |
| USC00304174 | Ithaca Cornell Univ | Tompkins | 42.4 | −76.4 | 292.6 | 100.0 |
| USC00304207 | Jamestown 4 ENE | Chautauqua | 42.1 | −79.2 | 381.0 | 100.0 |
| USC00304526 | La Fargeville 4E | Jefferson | 44.2 | −75.9 | 132.6 | 0.0 |
| USC00304537 | Lake Luzerne | Saratoga | 43.3 | −73.8 | 185.9 | 0.0 |
| USC00304555 | Lake Placid 2 S | Essex | 44.3 | −74.0 | 575.5 | 80.0 |
| USC00304564 | Lake View 1NE | Erie | 42.7 | −78.9 | 197.2 | 0.0 |
| USC00304565 | Lakeside | Orleans | 43.4 | −78.3 | 87.8 | 0.0 |
| USC00304566 | Lakeville | Livingston | 42.8 | −77.7 | 250.2 | 0.0 |
| USC00304575 | Lansing Manor | Schoharie | 42.4 | −74.5 | 338.3 | 88.0 |
| USC00304684 | Le Roy 1E | Genesee | 43.0 | −78.0 | 272.8 | 0.0 |
| USC00304715 | Lewiston | Niagara | 43.2 | −79.0 | 108.2 | 0.0 |
| USC00304731 | Liberty 1 NE | Sullivan | 41.8 | −74.7 | 481.6 | 100.0 |
| USC00304808 | Little Valley | Cattaraugus | 42.2 | −78.8 | 495.3 | 100.0 |
| USC00304844 | Lockport 2SE | Niagara | 43.2 | −78.7 | 195.7 | 100.0 |
| USC00304912 | Lowville | Lewis | 43.8 | −75.5 | 263.0 | 100.0 |
| USC00304952 | Macedon Lock E30 | Wayne | 43.1 | −77.3 | 142.0 | 0.0 |
| USC00304996 | Malone | Franklin | 44.8 | −74.3 | 267.6 | 100.0 |
| USC00305142 | Mattituck | Suffolk | 41.0 | −72.5 | 6.1 | 48.0 |
| USC00305233 | Mecklenburg 4SW | Schuyler | 42.4 | −76.8 | 460.2 | 100.0 |
| USC00305236 | Medina | Orleans | 43.2 | −78.4 | 164.0 | 0.0 |
| USC00305280 | Mexico 2SW | Oswego | 43.4 | −76.3 | 129.5 | 0.0 |
| USC00305426 | Mohonk Lake | Ulster | 41.8 | −74.2 | 336.5 | 66.0 |
| USC00305512 | Morrisville 6 SW | Madison | 42.8 | −75.7 | 512.4 | 95.0 |
| USC00305597 | Mt Morris 2W | Livingston | 42.7 | −77.9 | 268.2 | 100.0 |
| USC00305606 | Mt Sinai | Suffolk | 40.9 | −73.0 | 15.2 | 20.0 |
| USC00305679 | Newark | Wayne | 43.0 | −77.1 | 131.1 | 0.0 |
| USC00305714 | Newcomb | Essex | 44.0 | −74.2 | 502.0 | 99.0 |
| USC00305715 | Newfane | Niagara | 43.3 | −78.7 | 104.2 | 0.0 |
| USC00305840 | Niagara Falls | Niagara | 43.1 | −79.0 | 179.2 | 0.0 |
| USC00305925 | N Creek 5 SE | Warren | 43.7 | −73.9 | 271.3 | 0.0 |
| USC00306047 | N Tonawanda | Niagara | 43.1 | −78.9 | 176.2 | 100.0 |
| USC00306062 | Northville | Fulton | 43.2 | −74.2 | 240.8 | 0.0 |
| USC00306085 | Norwich | Chenango | 42.5 | −75.5 | 301.4 | 98.0 |
| USC00306184 | Old Forge | Herkimer | 43.7 | −75.0 | 520.0 | 0.0 |
| USC00306196 | Olean | Cattaraugus | 42.1 | −78.5 | 432.8 | 100.0 |
| USC00306276 | Orient Pt Sp | Suffolk | 41.1 | −72.3 | 0.9 | 0.0 |
| USC00306300 | Osceola | Lewis | 43.5 | −75.7 | 335.6 | 0.0 |
| USC00306314 | Oswego | Oswego | 43.5 | −76.5 | 98.8 | 100.0 |
| USC00306376 | Palermo 2SSE | Oswego | 43.3 | −76.3 | 135.6 | 0.0 |
| USC00306465 | Pavilion 2 | Genesee | 42.9 | −78.0 | 353.6 | 0.0 |
| USC00306480 | Pendleton 1NE | Niagara | 43.1 | −78.7 | 179.5 | 0.0 |
| USC00306525 | Perrysburg | Cattaraugus | 42.5 | −79.0 | 368.8 | 100.0 |
| USC00306570 | Phonecia 2SW | Ulster | 42.1 | −74.3 | 323.1 | 0.0 |
| USC00306660 | Plattsburgh 1 S | Clinton | 44.7 | −73.5 | 54.3 | 0.0 |
| USC00306747 | Portland 1SW | Chautauqua | 42.4 | −79.5 | 246.3 | 100.0 |
| USC00306774 | Port Jervis | Orange | 41.4 | −74.7 | 176.8 | 100.0 |
| USC00306867 | Pulaski | Oswego | 43.6 | −76.1 | 121.6 | 96.0 |
| USC00307134 | Riverhead Rsch Farm | Suffolk | 41.0 | −72.7 | 30.5 | 100.0 |
| USC00307274 | Rosendale 2 E | Ulster | 41.8 | −74.0 | 37.2 | 0.0 |
| USC00307329 | Rushford | Allegany | 42.4 | −78.2 | 463.9 | 0.0 |
| USC00307383 | St James | Suffolk | 40.9 | −73.1 | 38.1 | 0.0 |
| USC00307425 | Sanborn 4NE | Niagara | 43.2 | −78.8 | 192.9 | 0.0 |
| USC00307484 | Saratoga Springs 4 SW | Saratoga | 43.0 | −73.8 | 99.4 | 91.0 |
| USC00307705 | Sherburne | Chenango | 42.7 | −75.5 | 333.8 | 100.0 |
| USC00307742 | Shrub Oak | Westchester | 41.3 | −73.8 | 140.8 | 100.0 |
| USC00307749 | Silver Springs 3N | Wyoming | 42.7 | −78.1 | 508.1 | 0.0 |
| USC00307750 | Silver Creek | Chautauqua | 42.5 | −79.2 | 198.1 | 0.0 |
| USC00307780 | Skaneateles | Onondaga | 42.9 | −76.4 | 266.7 | 0.0 |
| USC00307842 | Sodus 1W | Wayne | 43.2 | −77.1 | 135.3 | 99.0 |
| USC00308132 | Springville 5NE | Erie | 42.5 | −78.6 | 515.4 | 0.0 |
| USC00308248 | Stillwater Rsvr | Herkimer | 43.9 | −75.0 | 515.1 | 94.0 |
| USC00308412 | Taylorville | Lewis | 43.9 | −75.3 | 303.3 | 0.0 |
| USC00308455 | Theresa 4NW | Jefferson | 44.3 | −75.8 | 110.0 | 0.0 |
| USC00308577 | Syosset | Nassau | 40.8 | −73.5 | 80.8 | 0.0 |
| USC00308578 | Trenton Falls | Herkimer | 43.3 | −75.2 | 243.8 | 96.0 |
| USC00308600 | Troy L&D | Rensselaer | 42.8 | −73.7 | 4.6 | 0.0 |
| USC00308631 | Tupper Lake Sunmount | Franklin | 44.2 | −74.4 | 512.1 | 54.0 |
| USC00308721 | Upton Coop - Nwsfo New York | Suffolk | 40.9 | −72.9 | 24.4 | 100.0 |
| USC00308839 | Victor 2NW | Ontario | 43.0 | −77.4 | 199.3 | 100.0 |
| USC00308910 | Wales | Erie | 42.7 | −78.5 | 342.9 | 100.0 |
| USC00308932 | Walton 2 | Delaware | 42.2 | −75.1 | 451.1 | 100.0 |
| USC00308961 | Warsaw 4 W | Wyoming | 42.7 | −78.2 | 533.4 | 0.0 |
| USC00308962 | Warsaw 6 SW | Wyoming | 42.7 | −78.2 | 554.7 | 100.0 |
| USC00309000 | Watertown | Jefferson | 44.0 | −75.9 | 151.5 | 100.0 |
| USC00309047 | Waverly | Tioga | 42.0 | −76.5 | 243.8 | 98.0 |
| USC00309049 | Webster 2 NE | Monroe | 43.2 | −77.4 | 83.8 | 100.0 |
| USC00309072 | Wellsville | Allegany | 42.1 | −77.9 | 460.2 | 100.0 |
| USC00309089 | W Bloomfield 1 S | Ontario | 42.9 | −77.5 | 301.8 | 0.0 |
| USC00309248 | Westmoreland 4N | Oneida | 43.2 | −75.5 | 172.2 | 0.0 |
| USC00309292 | W Pt | Orange | 41.4 | −74.0 | 97.5 | 8.0 |
| USC00309307 | West Seneca 1 NE | Erie | 42.8 | −78.8 | 200.9 | 0.0 |
| USC00309389 | Whitehall | Washington | 43.6 | −73.4 | 36.3 | 44.0 |
| USC00309425 | Whitesville 1N | Allegany | 42.1 | −77.8 | 661.4 | 0.0 |
| USC00309442 | Whitney Pt Dam | Broome | 42.3 | −76.0 | 317.0 | 100.0 |
| USC00309499 | Wilmington 2W | Essex | 44.4 | −73.9 | 615.7 | 0.0 |
| USC00309593 | Wyoming 3W | Wyoming | 42.8 | −78.1 | 475.2 | 0.0 |
| USC00309690 | Youngstown 1S | Niagara | 43.2 | −79.1 | 91.4 | 0.0 |
| USW00004720 | Jamestown | Chautauqua | 42.1 | −79.2 | 525.2 | 0.0 |
| USW00004724 | Niagara Falls Intl AP | Niagara | 43.1 | −78.9 | 178.3 | 97.0 |
| USW00004725 | Binghamton | Broome | 42.2 | −76.0 | 519.1 | 100.0 |
| USW00004742 | Plattsburgh Intl AP | Clinton | 44.6 | −73.5 | 71.9 | 99.0 |
| USW00004781 | Islip-Li Macarthur AP | Suffolk | 40.8 | −73.1 | 25.3 | 100.0 |
| USW00004789 | Montgomery Orange Co AP | Orange | 41.5 | −74.3 | 108.2 | 99.0 |
| USW00014714 | Stewart Fld | Orange | 41.5 | −74.1 | 177.1 | 98.0 |
| USW00014715 | Wheeler Sack Fld Aaf | Jefferson | 44.0 | −75.7 | 214.0 | 0.0 |
| USW00014719 | Westhampton Gabreski AP | Suffolk | 40.9 | −72.6 | 13.1 | 96.0 |
| USW00014732 | Laguardia AP | Queens | 40.8 | −73.9 | 3.0 | 100.0 |
| USW00014733 | Buffalo | Erie | 42.9 | −78.7 | 240.8 | 100.0 |
| USW00014735 | Albany Intl AP | Albany | 42.7 | −73.8 | 85.3 | 100.0 |
| USW00014747 | Dunkirk Chautauqua Co AP | Chautauqua | 42.5 | −79.3 | 203.9 | 92.0 |
| USW00014748 | Elmira Corning Rgnl AP | Chemung | 42.2 | −76.9 | 285.3 | 98.0 |
| USW00014750 | Glens Falls AP | Warren | 43.3 | −73.6 | 97.8 | 100.0 |
| USW00014757 | Poughkeepsie AP | Dutchess | 41.6 | −73.9 | 46.6 | 99.0 |
| USW00014768 | Rochester Gtr Intl | Monroe | 43.1 | −77.7 | 164.6 | 100.0 |
| USW00014771 | Syracuse Hancock Intl AP | Onondaga | 43.1 | −76.1 | 125.0 | 100.0 |
| USW00054746 | Monticello Sullivan | Sullivan | 41.7 | −74.8 | 427.6 | 0.0 |
| USW00054757 | Wellsville Muni AP | Allegany | 42.1 | −78.0 | 637.6 | 93.0 |
| USW00054773 | Fulton Oswego Co AP | Oswego | 43.4 | −76.4 | 143.6 | 98.0 |
| USW00054778 | Penn Yan AP | Yates | 42.6 | −77.1 | 267.3 | 99.0 |
| USW00054780 | Montauk AP | Suffolk | 41.1 | −71.9 | 2.1 | 97.0 |
| USW00054787 | Farmingdale Republic AP | Suffolk | 40.7 | −73.4 | 22.9 | 99.0 |
| USW00054790 | Shirley Brookhaven AP | Suffolk | 40.8 | −72.9 | 20.1 | 98.0 |
| USW00064756 | Millbrook 3 W | Dutchess | 41.8 | −73.7 | 125.9 | 100.0 |
| USW00064758 | Ithaca 13 E | Cortland | 42.4 | −76.2 | 374.3 | 100.0 |
| USW00064775 | Rome Griffiss Airfield | Oneida | 43.2 | −75.4 | 144.8 | 98.0 |
| USW00064776 | Plattsburgh Intl AP | Clinton | 44.6 | −73.5 | 50.3 | 98.0 |
| USW00094704 | Dansville Muni AP | Livingston | 42.6 | −77.7 | 196.0 | 96.0 |
| USW00094725 | Massena Intl AP | St. Lawrence | 44.9 | −74.8 | 61.0 | 98.0 |
| USW00094728 | Ny City Cntrl Park | New York | 40.8 | −74.0 | 42.7 | 100.0 |
| USW00094740 | Saranac Lk Adirondack Rgnl AP | Franklin | 44.4 | −74.2 | 505.7 | 99.0 |
| USW00094745 | Westchester Co AP | Westchester | 41.1 | −73.7 | 112.8 | 98.0 |
| USW00094789 | Jfk Intl AP | Queens | 40.6 | −73.8 | 2.7 | 100.0 |
| USW00094790 | Watertown AP | Jefferson | 44.0 | −76.0 | 94.8 | 100.0 |
Fuente: NOAA NCEI
11 Glosario, metodología y fuentes
Anomalía: diferencia entre el valor observado y su normal 1991–2020. Porcentaje de lo normal: acumulado observado dividido entre el normal, por 100. Récord de estación: valor diario más extremo del mismo mes en todos los años previos del registro (al menos 20 años).
Temperatura: NOAA nClimGrid-Daily. Precipitación: NOAA nClimGrid-Daily. nClimGrid-Daily es la malla de los valores estatales oficiales de la NOAA; aquí se promedia de 1/24° a 1/8° (unos 12 km). La temperatura media es (Tmáx + Tmín)/2. Los promedios estatales, regionales y por condado se ponderan por el área de cada celda dentro de cada polígono. Los mapas de temperatura, los días con helada y las tablas de anexos se presentan por región; las regiones son las divisiones climáticas de NOAA NCEI, con cada condado en la división de su centroide. Las semanas recientes usan el archivo preliminar del mes de NCEI; esos reportes se marcan como preliminares y se actualizan cuando se publica el archivo final. Las normales corresponden a 1991-2020; la posición en la serie compara valores redondeados a un decimal. Estaciones: GHCN-Daily (NOAA NCEI), estaciones cooperativas y de primer orden; se descartan los datos marcados por su control de calidad, los valores diarios a más de 5 desviaciones robustas de la mediana de la estación y las variables cuya anomalía mensual difiere más de 3 °C de la del análisis en malla. Los promedios requieren al menos 80 % de días con datos y las normales de estación al menos 20 años completos. Este reporte se genera automáticamente y no sustituye la información oficial del National Weather Service ni del climatólogo estatal.
| Fuente | Producto | Licencia | Cita |
|---|---|---|---|
| NOAA CPC | ONI, Niño-region SST indices (OISST v2.1), NAO and AO | Public domain (NOAA) | NOAA Climate Prediction Center climate indices. |
| NOAA NCEI / PSL | Extended Reconstructed SST v5 (ERSST v5), 2° | Public domain (NOAA) | Huang et al. (2017), J. Climate, doi:10.1175/JCLI-D-16-0836.1 |
| GDACS | Global Disaster Alert and Coordination System event list | See provider terms | — |
| NOAA NCEI | GHCN-Daily | Public domain (NOAA) | Menne et al. (2012), J. Atmos. Oceanic Technol., doi:10.1175/JTECH-D-11-00103.1 |
| NOAA NCEI | IBTrACS v04r01 tropical-cyclone best tracks | Public domain (NOAA) | Knapp et al. (2010), Bull. Amer. Meteor. Soc., doi:10.1175/2009BAMS2755.1 |
| NOAA NCEI | Pacific Decadal Oscillation index (ERSST v5) | Public domain (NOAA) | — |
| NOAA NCEI | nClimGrid-Daily, contiguous United States (1/24°, averaged here to 1/8°) | Public domain (NOAA) | Durre, I., et al. (2022). NOAA's nClimGrid-Daily Version 1. NOAA National Centers for Environmental Information. doi:10.25921/c4gt-r169 |
| NOAA CPC | North American Multi-Model Ensemble (NMME) tercile probabilities, 1° | Public domain (NOAA) | Kirtman et al. (2014), Bull. Amer. Meteor. Soc., doi:10.1175/BAMS-D-12-00050.1 |
| National Drought Mitigation Center, USDA, NOAA | U.S. Drought Monitor, weekly maps and area statistics | Free to use with credit (NDMC) | The U.S. Drought Monitor is jointly produced by the National Drought Mitigation Center at the University of Nebraska-Lincoln, the United States Department of Agriculture and the National Oceanic and Atmospheric Administration. Map courtesy of NDMC. |
| US Census Bureau TIGERweb | US Census Bureau, TIGERweb counties (generalised) | Public domain (US Government work) | — |
Generado por ClimaBulletin (climabulletin.org), código abierto. Preguntas y comentarios: [email protected].