New York · Annual
Year 2025
Downloads
1 Key messages and climate synopsis
Source: NOAA NCEI
Source: NOAA NCEI
2 Global and regional climate drivers
Sea-surface temperature anomaly, Year 2025 (°C, 1991–2020)
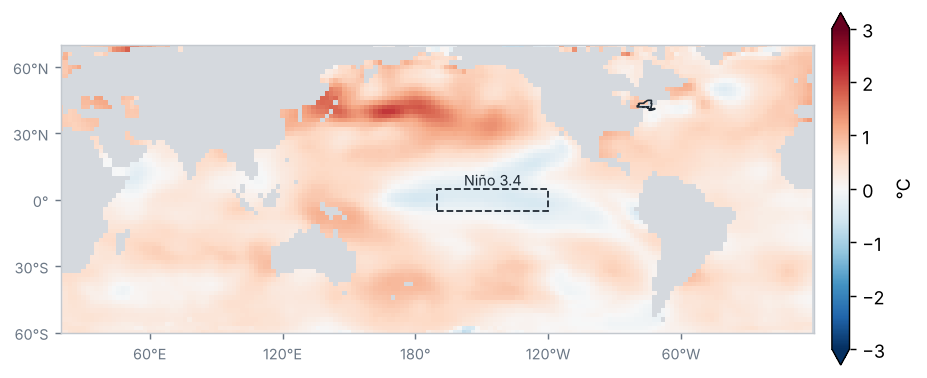
Source: NOAA NCEI / PSL
Sea-surface temperature anomaly in the Niño regions (°C)
| Region | Anomaly (°C) | Change from preceding period (°C) |
|---|---|---|
| Niño 1+2 | 0.2 | 0.3 |
| Niño 3 | −0.2 | −0.5 |
| Niño 3.4 | −0.3 | −0.7 |
| Niño 4 | −0.2 | −0.8 |
Mean of the months in the period (OISST v2.1)
Source: NOAA CPC
La Niña conditions of weak intensity: the Oceanic Niño Index (ONI) for OND 2025 was −0.6 °C.
Source: NOAA CPC
Monthly Niño 3.4 anomaly, last 24 months (°C)
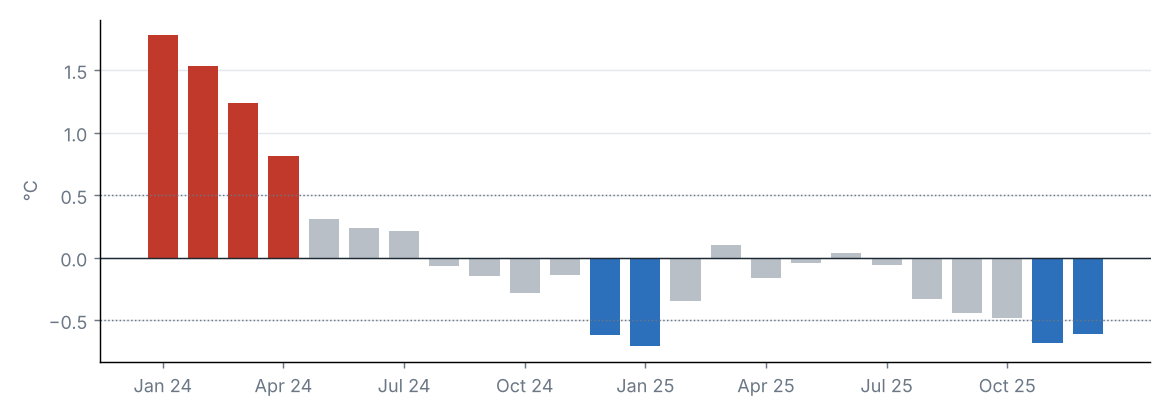
Source: NOAA CPC
Teleconnection indices
| Index | Value | Phase |
|---|---|---|
| NAO | 0.0 | Neutral |
| AO | 0.2 | Neutral |
| PDO | −2.0 | Negative |
North Atlantic Oscillation (NAO); Arctic Oscillation (AO); Pacific Decadal Oscillation (PDO).
Source: NOAA CPC, NOAA NCEI
The Niño 3.4 anomaly was −0.31 °C (−0.71 °C relative to the preceding period).
Other indices: NAO +0.02 (neutral phase); AO +0.20 (neutral phase); PDO −1.99 (negative phase).
3 Precipitation
Source: NOAA NCEI
Accumulated precipitation
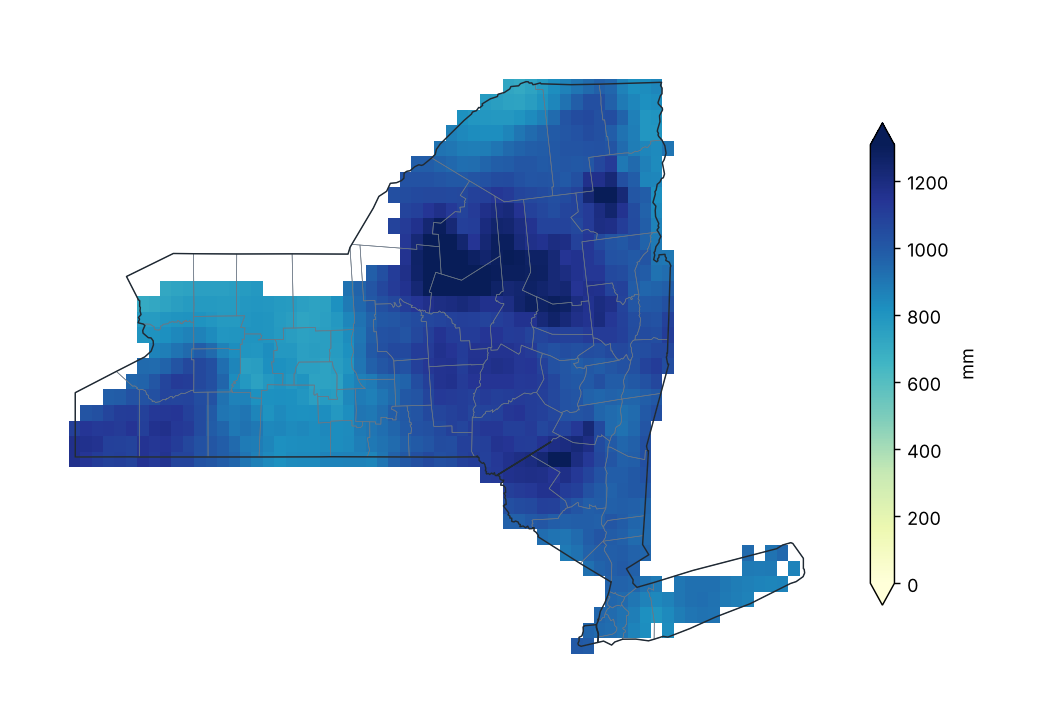
Source: NOAA NCEI
Percent of normal precipitation (1991–2020)
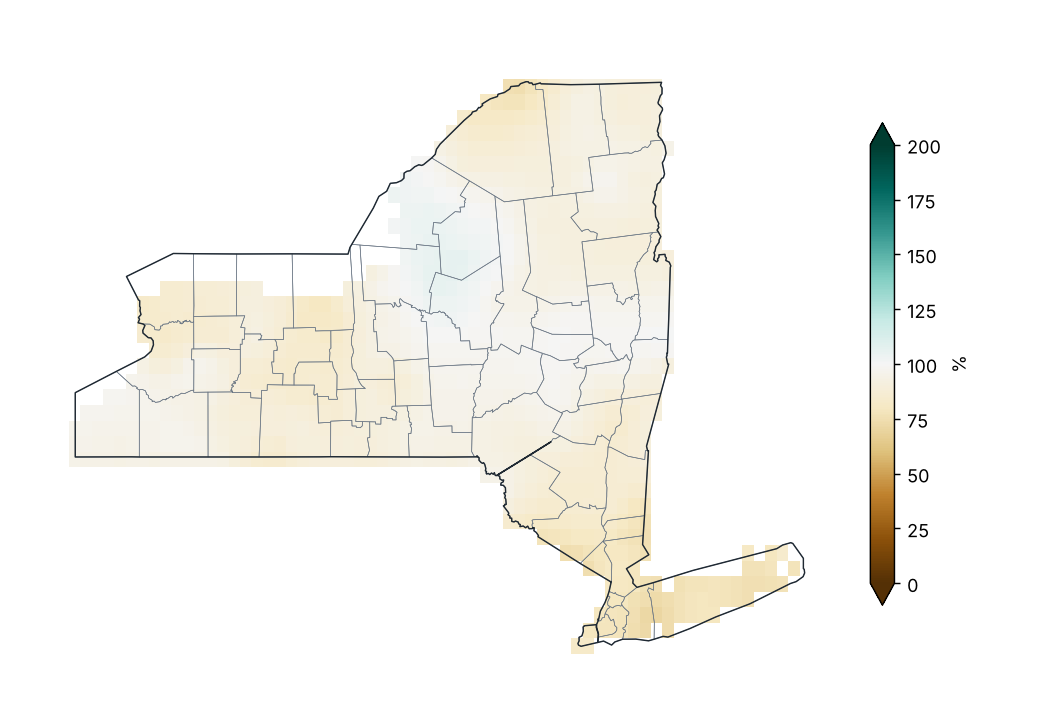
Source: NOAA NCEI
Percent of normal by county
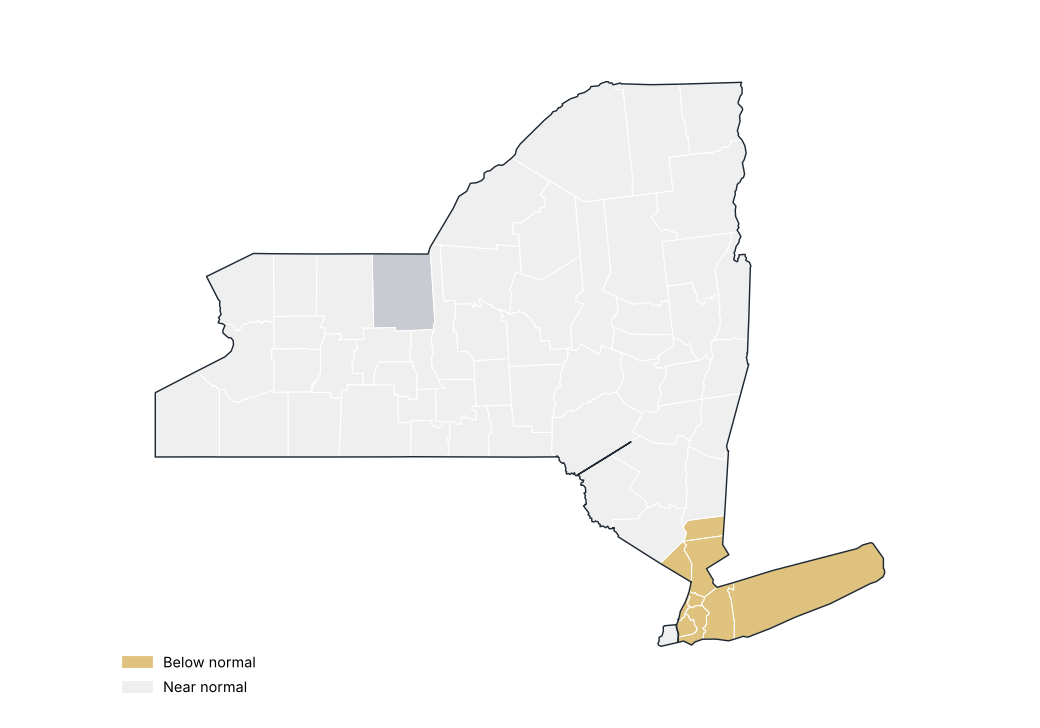
Source: NOAA NCEI
Precipitation by region
| Region | Total (mm) | Normal (mm) | Difference (%) | Category |
|---|---|---|---|---|
| Western Plateau | 939.8 | 1028.8 | −8.6 | Near normal |
| Eastern Plateau | 1086.6 | 1169.5 | −7.1 | Near normal |
| Northern Plateau | 1173.3 | 1225.3 | −4.2 | Near normal |
| Coastal | 891.8 | 1159.1 | −23.1 | Below normal |
| Hudson Valley | 1002.9 | 1134.8 | −11.6 | Near normal |
| Mohawk Valley | 1185.9 | 1186.3 | −0.0 | Near normal |
| Champlain Valley | 994.2 | 1079.8 | −7.9 | Near normal |
| St. Lawrence Valley | 946.0 | 1061.3 | −10.9 | Near normal |
| Great Lakes | 963.2 | 1027.2 | −6.2 | Near normal |
| Central Lakes | 884.5 | 983.0 | −10.0 | Near normal |
Source: NOAA NCEI
Stations with the largest precipitation excess
| Region | County | Station | Altitude (m) | Anomaly (%) |
|---|---|---|---|---|
| Eastern Plateau | Madison | Morrisville 6 SW | 512.0 | 13.7 |
| Northern Plateau | Lewis | Highmarket 2W | 550.0 | 13.1 |
| Great Lakes | Oswego | Fulton Oswego Co AP | 144.0 | 10.9 |
| Great Lakes | Jefferson | Watertown AP | 95.0 | 9.3 |
| Champlain Valley | Essex | Lake Placid 2 S | 576.0 | 8.6 |
| Mohawk Valley | Oneida | Camden | 177.0 | 6.4 |
| Hudson Valley | Saratoga | Saratoga Springs 4 SW | 99.0 | 5.0 |
| Great Lakes | Jefferson | Watertown | 152.0 | 4.2 |
| Mohawk Valley | Oneida | Boonville 4 SSW | 472.0 | 3.1 |
| Hudson Valley | Albany | Albany Intl AP | 85.0 | 1.8 |
Source: NOAA NCEI
Stations with the largest precipitation deficit
| Region | County | Station | Altitude (m) | Anomaly (%) |
|---|---|---|---|---|
| Coastal | Suffolk | Farmingdale Republic AP | 23.0 | −39.3 |
| Western Plateau | Allegany | Whitesville 1N | 661.0 | −30.8 |
| St. Lawrence Valley | St. Lawrence | Massena Intl AP | 61.0 | −28.0 |
| Coastal | Suffolk | Bridgehampton | 13.0 | −26.8 |
| Coastal | Suffolk | Islip-Li Macarthur AP | 25.0 | −25.9 |
| Great Lakes | Erie | Buffalo | 241.0 | −22.6 |
| Central Lakes | Livingston | Dansville Muni AP | 196.0 | −22.5 |
| Coastal | Suffolk | Upton Coop - Nwsfo New York | 24.0 | −22.0 |
| Central Lakes | Ontario | Honeoye | 244.0 | −21.3 |
| Coastal | Queens | Jfk Intl AP | 3.0 | −21.2 |
Source: NOAA NCEI
Largest 24-hour rainfall at stations
| Station | County | Max 24 h rainfall (mm) | Date |
|---|---|---|---|
| Norwich | Chenango | 102.6 | 2025-06-23 |
| Westmoreland 4N | Oneida | 92.2 | 2025-06-22 |
| Westchester Co AP | Westchester | 85.9 | 2025-07-14 |
| Albany Intl AP | Albany | 85.3 | 2025-09-25 |
| Sherburne | Chenango | 85.1 | 2025-06-22 |
| Indian Lake 2SW | Hamilton | 84.3 | 2025-07-13 |
| Mattituck | Suffolk | 81.5 | 2025-10-31 |
| Rochester Gtr Intl | Monroe | 80.0 | 2025-06-18 |
| Phonecia 2SW | Ulster | 77.2 | 2025-05-06 |
| Walton 2 | Delaware | 76.2 | 2025-06-23 |
Source: NOAA NCEI
Statewide precipitation in each year
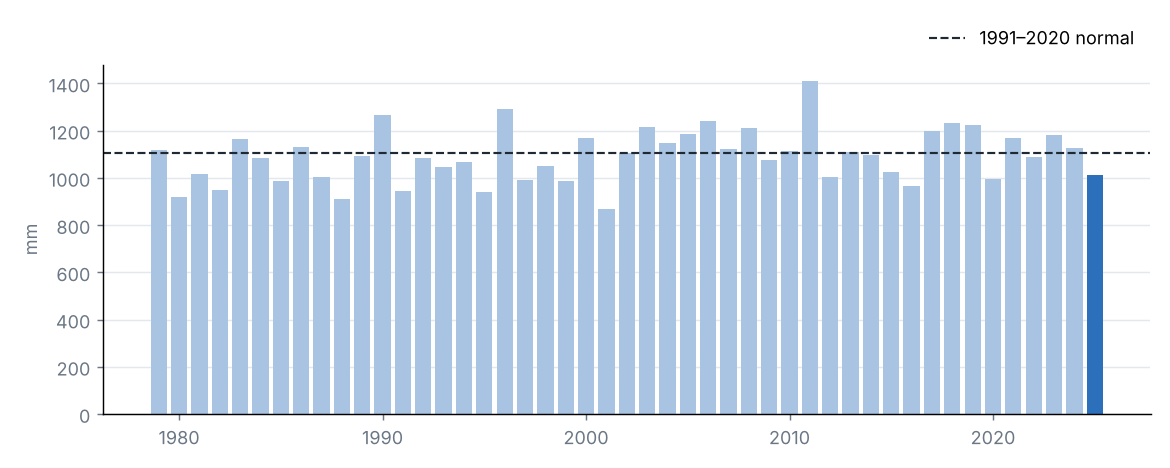
Source: NOAA NCEI
Monthly precipitation and 1991–2020 normal
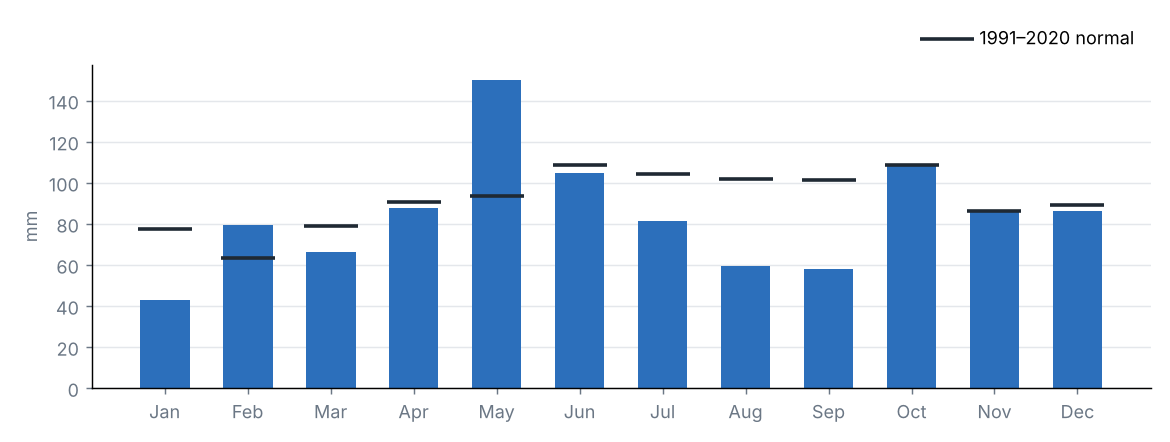
Source: NOAA NCEI
Statewide accumulated precipitation was 1010.5 mm, 92% of the 1991–2020 average (1104.0 mm), category “Near normal”. It was the 14th driest year in the 1979–2025 series.
The region with the highest percentage of normal was Mohawk Valley (100%) and the lowest was Coastal (77%).
Source: NOAA NCEI
4 Temperature
Source: NOAA NCEI
Mean temperature
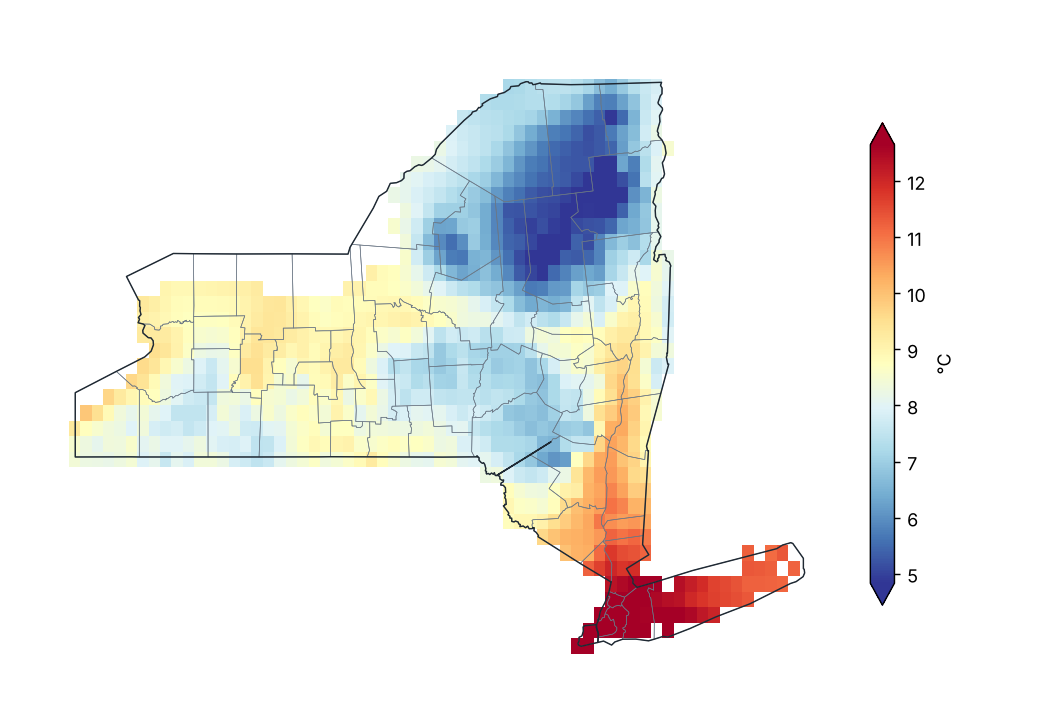
Source: NOAA NCEI
Mean temperature anomaly (1991–2020)
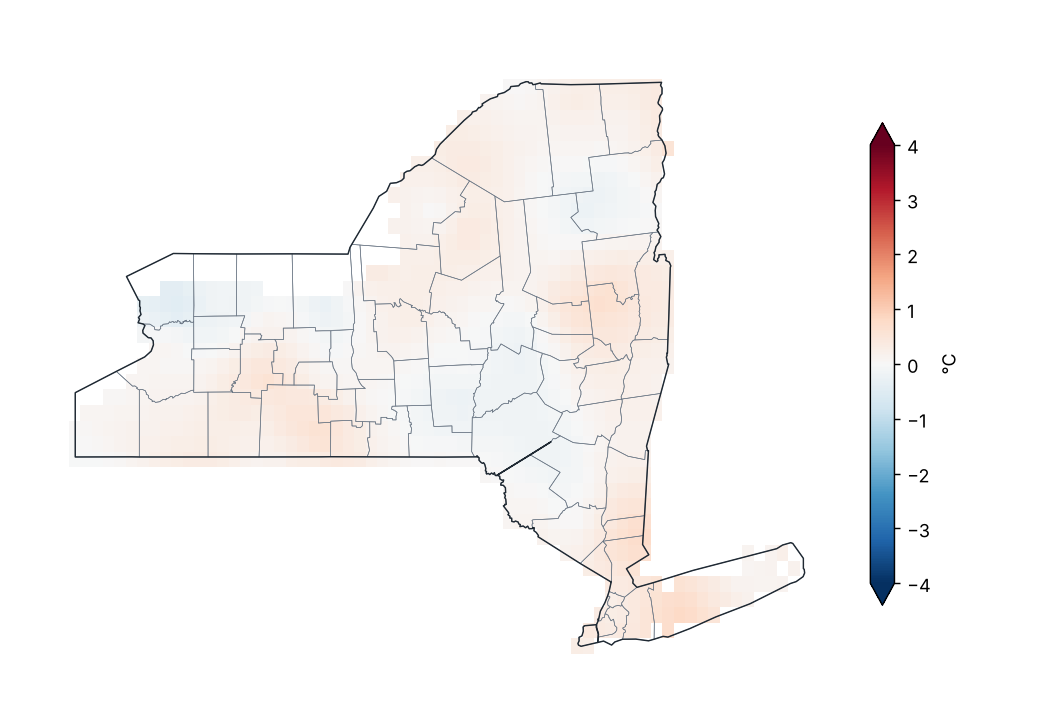
Source: NOAA NCEI
Mean temperature anomaly by region
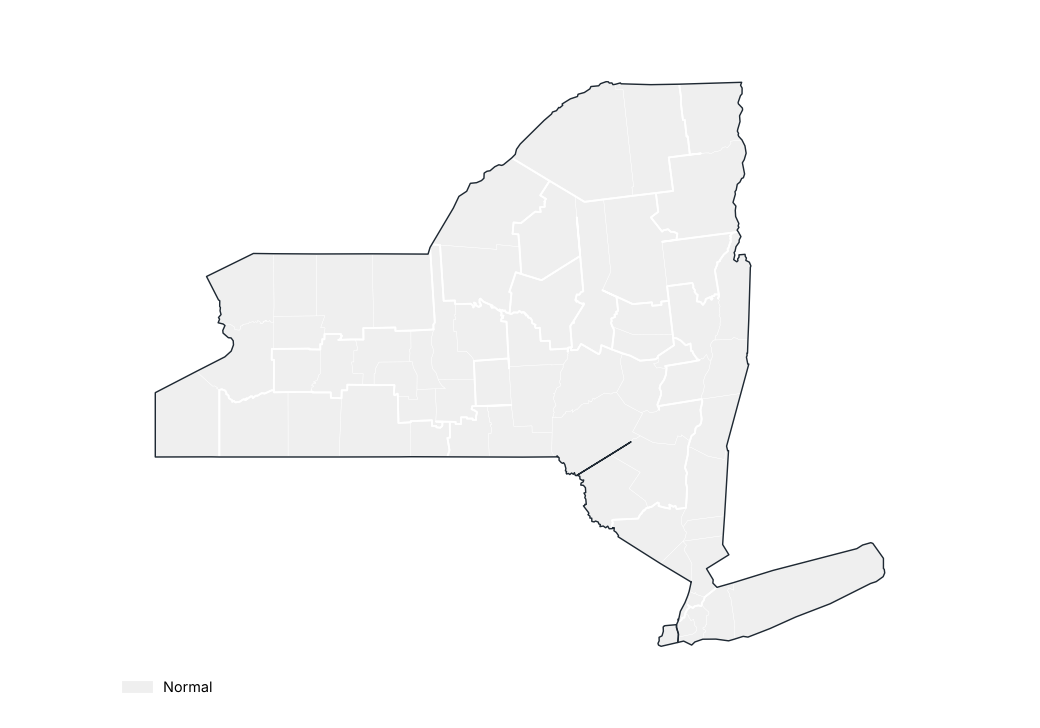
Source: NOAA NCEI
Stations with the largest positive anomaly
| Region | County | Station | Altitude (m) | Anomaly (°C) |
|---|---|---|---|---|
| Western Plateau | Cattaraugus | Franklinville | 485.0 | 2.7 |
| Eastern Plateau | Schoharie | Lansing Manor | 338.0 | 1.6 |
| Coastal | Suffolk | Montauk AP | 2.0 | 1.4 |
| Central Lakes | Livingston | Dansville Muni AP | 196.0 | 1.1 |
| Coastal | Suffolk | Islip-Li Macarthur AP | 25.0 | 0.9 |
| St. Lawrence Valley | St. Lawrence | Gouverneur 3 NW | 128.0 | 0.8 |
| Hudson Valley | Saratoga | Saratoga Springs 4 SW | 99.0 | 0.8 |
| Hudson Valley | Saratoga | Conklingville Dam | 246.0 | 0.7 |
| Northern Plateau | Lewis | Lowville | 263.0 | 0.6 |
| Great Lakes | Oswego | Oswego | 99.0 | 0.6 |
Source: NOAA NCEI
Stations with the largest negative anomaly
| Region | County | Station | Altitude (m) | Anomaly (°C) |
|---|---|---|---|---|
| Eastern Plateau | Chenango | Norwich | 301.0 | −1.0 |
| Eastern Plateau | Madison | Morrisville 6 SW | 512.0 | −0.9 |
| Champlain Valley | Clinton | Dannemora | 408.0 | −0.8 |
| Great Lakes | Wayne | Sodus 1W | 135.0 | −0.8 |
| Great Lakes | Chautauqua | Dunkirk Chautauqua Co AP | 204.0 | −0.7 |
| Eastern Plateau | Delaware | Walton 2 | 451.0 | −0.6 |
| Great Lakes | Jefferson | Watertown | 152.0 | −0.4 |
| Central Lakes | Livingston | Mt Morris 2W | 268.0 | −0.4 |
| Western Plateau | Allegany | Alfred | 586.0 | −0.3 |
| Western Plateau | Allegany | Wellsville Muni AP | 638.0 | −0.3 |
Source: NOAA NCEI
Monthly statewide mean temperature anomaly
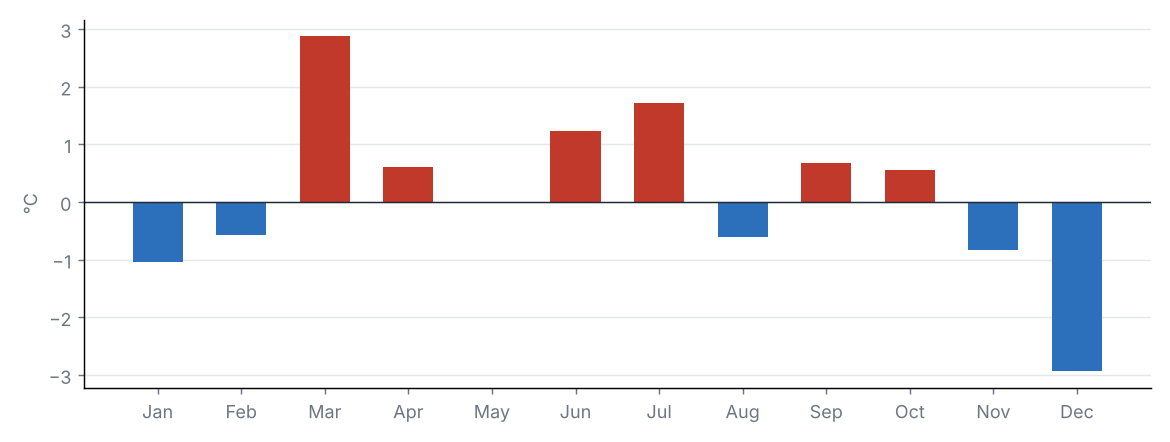
Source: NOAA NCEI
Statewide mean temperature anomaly in each year
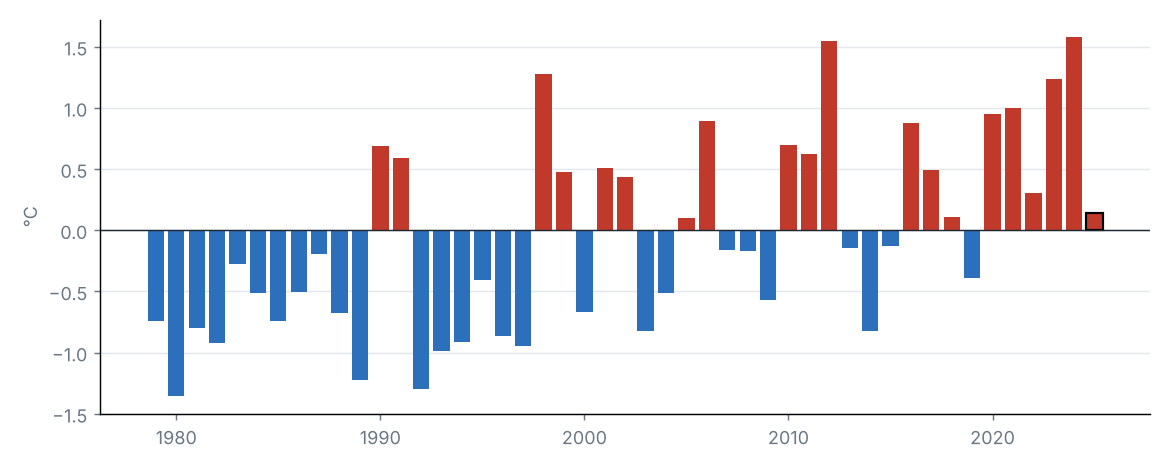
Source: NOAA NCEI
The statewide mean temperature was 8.1 °C, 0.1 °C above the 1991–2020 average (8.0 °C), category “Normal”. It was the 18th warmest year in the 1979–2025 series (tied with 2005, 2018).
By region, the largest anomaly was in Coastal (+0.4 °C) and the smallest in Eastern Plateau (−0.0 °C).
Source: NOAA NCEI
Source: NOAA NCEI
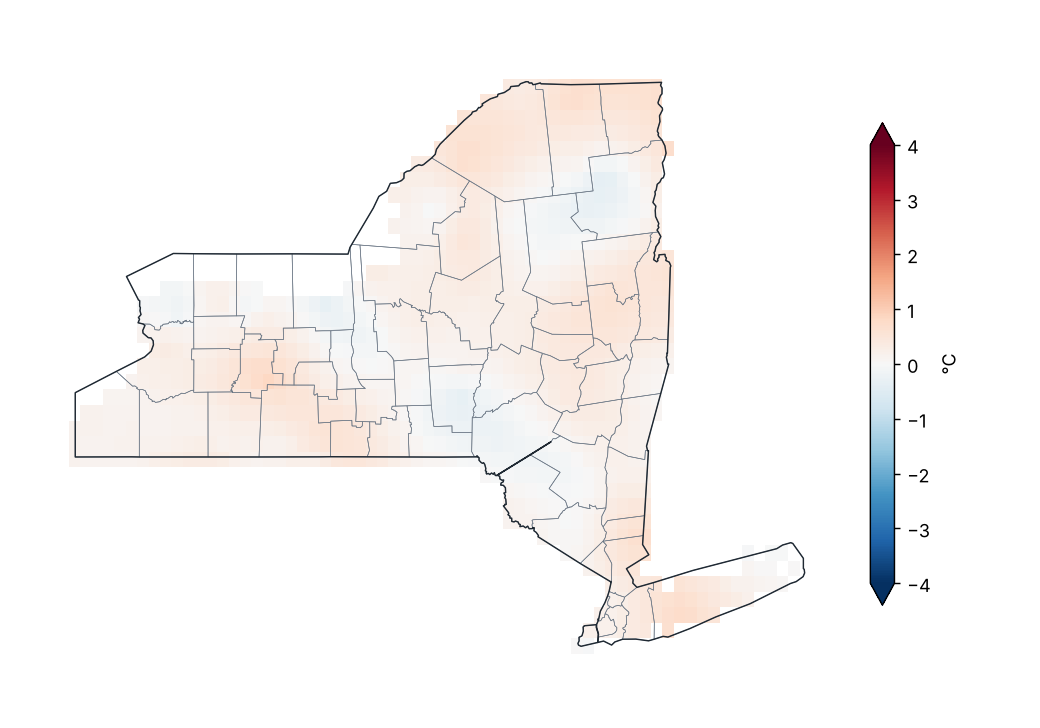
Maximum temperature anomaly (1991–2020)
Source: NOAA NCEI
Lowest and highest monthly mean maximum temperature by region
| Region | Lowest value (°C) | Station | Highest value (°C) | Station |
|---|---|---|---|---|
| Western Plateau | 12.8 | Wellsville Muni AP | 16.4 | Franklinville |
| Eastern Plateau | 11.4 | Morrisville 6 SW | 17.2 | Lansing Manor |
| Northern Plateau | 10.4 | Highmarket 2W | 14.2 | Glens Falls AP |
| Coastal | 15.7 | Bridgehampton | 17.5 | Laguardia AP |
| Hudson Valley | 13.4 | Conklingville Dam | 17.1 | Ny City Cntrl Park |
| Mohawk Valley | 11.1 | Gloversville 7NW (Peck Lake) | 14.0 | Rome Griffiss Airfield |
| Champlain Valley | 11.1 | Newcomb | 13.3 | Plattsburgh Intl AP |
| St. Lawrence Valley | 11.2 | Colton 2 N | 13.2 | Gouverneur 3 NW |
| Great Lakes | 12.8 | Watertown | 15.3 | Portland 1SW |
| Central Lakes | 12.0 | Warsaw 6 SW | 16.9 | Dansville Muni AP |
Station monthly means (GHCN-Daily, ≥ 80% of days with data).
Source: NOAA NCEI
The statewide maximum temperature was 13.6 °C, 0.2 °C above the 1991–2020 average (13.4 °C), category “Normal”. It was the 19th warmest year in the 1979–2025 series (tied with 2015).
By region, the largest anomaly was in St. Lawrence Valley (+0.4 °C) and the smallest in Eastern Plateau (+0.1 °C).
Source: NOAA NCEI
Source: NOAA NCEI
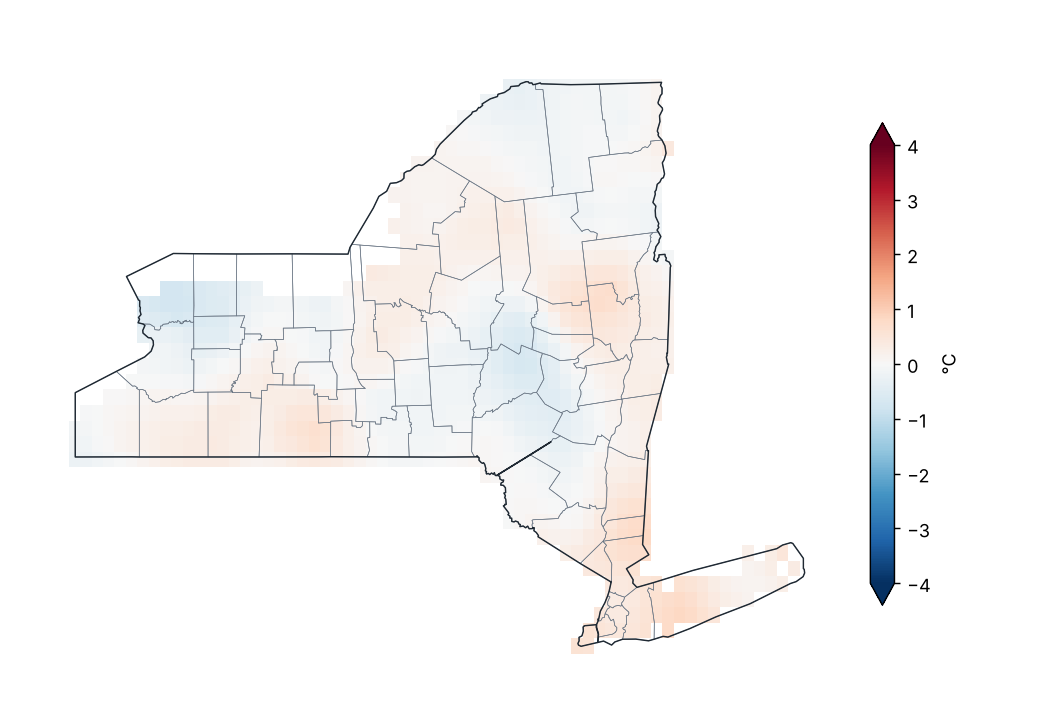
Minimum temperature anomaly (1991–2020)
Source: NOAA NCEI
Lowest and highest monthly mean minimum temperature by region
| Region | Lowest value (°C) | Station | Highest value (°C) | Station |
|---|---|---|---|---|
| Western Plateau | 0.9 | Alfred | 3.3 | Franklinville |
| Eastern Plateau | 0.9 | Walton 2 | 3.7 | Binghamton |
| Northern Plateau | −1.2 | Highmarket 2W | 1.6 | Trenton Falls |
| Coastal | 5.6 | Westhampton Gabreski AP | 9.8 | Laguardia AP |
| Hudson Valley | 2.4 | Buskirk | 9.3 | Ny City Cntrl Park |
| Mohawk Valley | 0.5 | Boonville 4 SSW | 3.0 | Rome Griffiss Airfield |
| Champlain Valley | −1.0 | Newcomb | 2.5 | Plattsburgh Intl AP |
| St. Lawrence Valley | −2.1 | Saranac Lk Adirondack Rgnl AP | 1.8 | Gouverneur 3 NW |
| Great Lakes | 2.0 | Watertown AP | 6.0 | Oswego |
| Central Lakes | 2.2 | Mecklenburg 4SW | 5.5 | Dansville Muni AP |
Station monthly means (GHCN-Daily, ≥ 80% of days with data).
Source: NOAA NCEI
The statewide minimum temperature was 2.6 °C, 0.1 °C above the 1991–2020 average (2.5 °C), category “Normal”. It was the 17th warmest year in the 1979–2025 series (tied with 1999).
By region, the largest anomaly was in Coastal (+0.4 °C) and the smallest in Eastern Plateau (−0.1 °C).
Source: NOAA NCEI
5 Climate extremes and records
Source: NOAA NCEI
Highest maximum temperature by county
| County | Station | Temperature (°C) | Date |
|---|---|---|---|
| Suffolk | Baiting Hollow | 39.4 | 2025-06-25 |
| Queens | Jfk Intl AP | 38.9 | 2025-06-24 |
| Clinton | Plattsburgh Intl AP | 38.3 | 2025-06-23 |
| Dutchess | Poughkeepsie AP | 37.8 | 2025-06-24 |
| New York | Ny City Cntrl Park | 37.2 | 2025-06-24 |
| Washington | Whitehall | 37.2 | 2025-06-24 |
| Columbia | Hudson Correctional Facility | 36.7 | 2025-06-24 |
| Livingston | Dansville Muni AP | 36.7 | 2025-08-12 |
| Ontario | Victor 2NW | 36.7 | 2025-08-13 |
| Saratoga | Saratoga Springs 4 SW | 36.7 | 2025-06-24 |
| Warren | Glens Falls AP | 36.7 | 2025-06-24 |
| Westchester | Shrub Oak | 36.7 | 2025-06-25 |
| Chemung | Elmira | 36.1 | 2025-08-13 |
| Orange | Port Jervis | 36.1 | 2025-06-25 |
| Schoharie | Lansing Manor | 36.1 | 2025-06-24 |
| Tioga | Waverly | 36.1 | 2025-06-25 |
| Albany | Albany Intl AP | 35.6 | 2025-06-23 |
| Ulster | Mohonk Lake | 35.6 | 2025-06-24 |
| Chautauqua | Dunkirk | 35.0 | 2025-07-13 |
| Chenango | Sherburne | 35.0 | 2025-06-24 |
The 20 most extreme of 53.
Source: NOAA NCEI
Lowest minimum temperature by county
| County | Station | Temperature (°C) | Date |
|---|---|---|---|
| Franklin | Saranac Lk Adirondack Rgnl AP | −32.1 | 2025-02-02 |
| Herkimer | Stillwater Rsvr | −31.1 | 2025-02-02 |
| Cortland | Ithaca 13 E | −30.1 | 2025-01-22 |
| Delaware | Delhi 2 SE | −30.0 | 2025-01-22 |
| Sullivan | Callicoon Ctr | −30.0 | 2025-01-22 |
| Essex | Newcomb | −29.4 | 2025-02-02 |
| Hamilton | Indian Lake 2SW | −29.4 | 2025-02-02 |
| Lewis | Highmarket 2W | −29.4 | 2025-02-02 |
| Fulton | Gloversville 7NW (Peck Lake) | −28.9 | 2025-01-22 |
| St. Lawrence | Massena Intl AP | −28.8 | 2025-02-02 |
| Tompkins | Freeville 1 NE | −28.3 | 2025-01-22 |
| Jefferson | Watertown AP | −27.8 | 2025-12-08 |
| Schoharie | Lansing Manor | −27.8 | 2025-01-22 |
| Chenango | Sherburne | −27.2 | 2025-01-22 |
| Cattaraugus | Little Valley | −26.7 | 2025-01-22 |
| Allegany | Angelica | −26.1 | 2025-01-22 |
| Rensselaer | Buskirk | −26.1 | 2025-01-22 |
| Wyoming | Warsaw 6 SW | −26.1 | 2025-01-22 |
| Clinton | Dannemora | −25.6 | 2025-02-02 |
| Madison | Morrisville 6 SW | −25.6 | 2025-01-23 |
The 20 most extreme of 52.
Source: NOAA NCEI
Climate-extremes indices (statewide mean)
| Index | Description | Value | Normal | Difference | Unit |
|---|---|---|---|---|---|
| TX90p | Warm days (Tmax > 90th percentile) | 12.4 | 10.0 | 2.4 | % |
| TN90p | Warm nights (Tmin > 90th percentile) | 10.4 | 10.0 | 0.4 | % |
| TX10p | Cool days (Tmax < 10th percentile) | 9.2 | 10.0 | −0.8 | % |
| TN10p | Cold nights (Tmin < 10th percentile) | 7.4 | 10.0 | −2.6 | % |
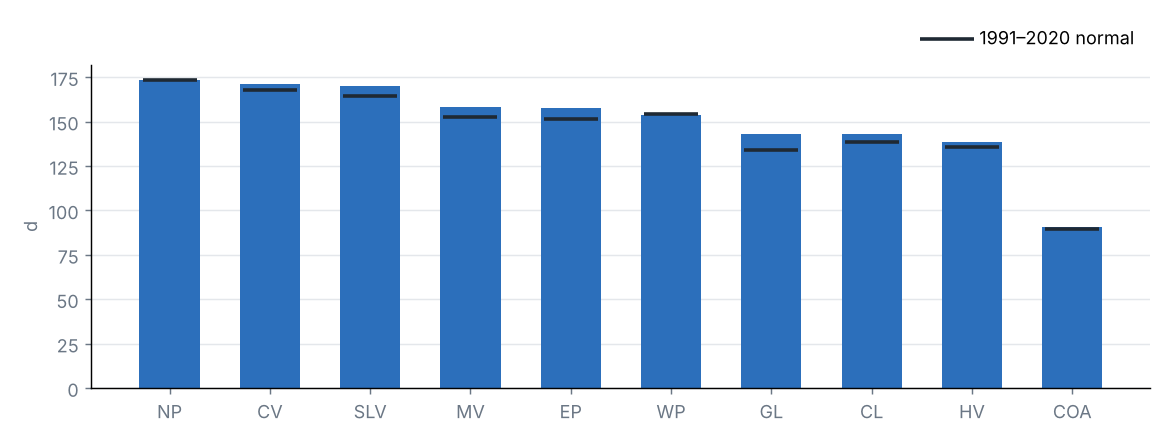
| FD | Frost days (Tmin < 0 °C) | 151.5 | 147.1 | 4.4 | d |
| SU | Summer days (Tmax > 25 °C) | 75.0 | 67.8 | 7.2 | d |
| TR | Tropical nights (Tmin > 20 °C) | 6.6 | 4.2 | 2.3 | d |
| WSDI | Warm spell days (≥ 6 days) | 0.7 | — | — | d |
| CSDI | Cold spell days (≥ 6 days) | 1.7 | — | — | d |
| Rx1day | Maximum 1-day precipitation | 40.3 | 53.4 | −13.1 | mm |
| Rx5day | Maximum 5-day precipitation | 71.3 | 85.6 | −14.3 | mm |
| CDD | Consecutive dry days (< 1 mm) | 15.3 | 13.7 | 1.7 | d |
| CWD | Consecutive wet days (≥ 1 mm) | 8.0 | 7.5 | 0.5 | d |
Percentile indices relative to calendar-day percentiles of 1991–2020 (5-day window); counts and maxima averaged over the state's grid cells.
Source: NOAA NCEI
Frost days by region
Source: NOAA NCEI
Heat and cold waves
| Dates | Type | Details |
|---|---|---|
| 2025-03-15 – 2025-03-17 | Heat wave | Up to 96% of the state above the 90th percentile of Tmax. Regions: Western Plateau, Eastern Plateau, Northern Plateau, Hudson Valley, Mohawk Valley, Champlain Valley, St. Lawrence Valley, Great Lakes and Central Lakes. |
| 2025-07-29 – 2025-07-31 | Heat wave | Up to 100% of the state above the 90th percentile of Tmax. Regions: Western Plateau, Eastern Plateau, Northern Plateau, Coastal, Hudson Valley, Mohawk Valley, Champlain Valley, Great Lakes and Central Lakes. |
| 2025-08-01 – 2025-08-03 | Cold wave | Up to 100% of the state below the 10th percentile of Tmin. Regions: Western Plateau, Eastern Plateau, Northern Plateau, Coastal, Hudson Valley, Mohawk Valley, Champlain Valley, St. Lawrence Valley, Great Lakes and Central Lakes. |
| 2025-08-10 – 2025-08-14 | Heat wave | Up to 97% of the state above the 90th percentile of Tmax. Regions: Western Plateau, Eastern Plateau, Northern Plateau, Hudson Valley, Mohawk Valley, Champlain Valley, St. Lawrence Valley, Great Lakes and Central Lakes. |
| 2025-08-28 – 2025-08-31 | Cold wave | Up to 75% of the state below the 10th percentile of Tmin. Regions: Western Plateau, Eastern Plateau, Northern Plateau, Coastal, Hudson Valley, Mohawk Valley, Great Lakes and Central Lakes. |
| 2025-09-08 – 2025-09-10 | Cold wave | Up to 84% of the state below the 10th percentile of Tmin. Regions: Western Plateau, Eastern Plateau, Northern Plateau, Hudson Valley, Mohawk Valley, Great Lakes and Central Lakes. |
| 2025-09-29 – 2025-10-01 | Heat wave | Up to 84% of the state above the 90th percentile of Tmax. Regions: Western Plateau, Eastern Plateau, Northern Plateau, Coastal, Hudson Valley, Mohawk Valley, Champlain Valley and Central Lakes. |
| 2025-10-05 – 2025-10-07 | Heat wave | Up to 100% of the state above the 90th percentile of Tmax. Regions: Western Plateau, Eastern Plateau, Northern Plateau, Coastal, Hudson Valley, Mohawk Valley, Champlain Valley, St. Lawrence Valley, Great Lakes and Central Lakes. |
Wave: at least 3 consecutive days with at least half of the state above the 90th percentile of maximum temperature (heat) or below the 10th percentile of minimum temperature (cold). At most the 10 most intense are listed.
Source: NOAA NCEI
6 Drought
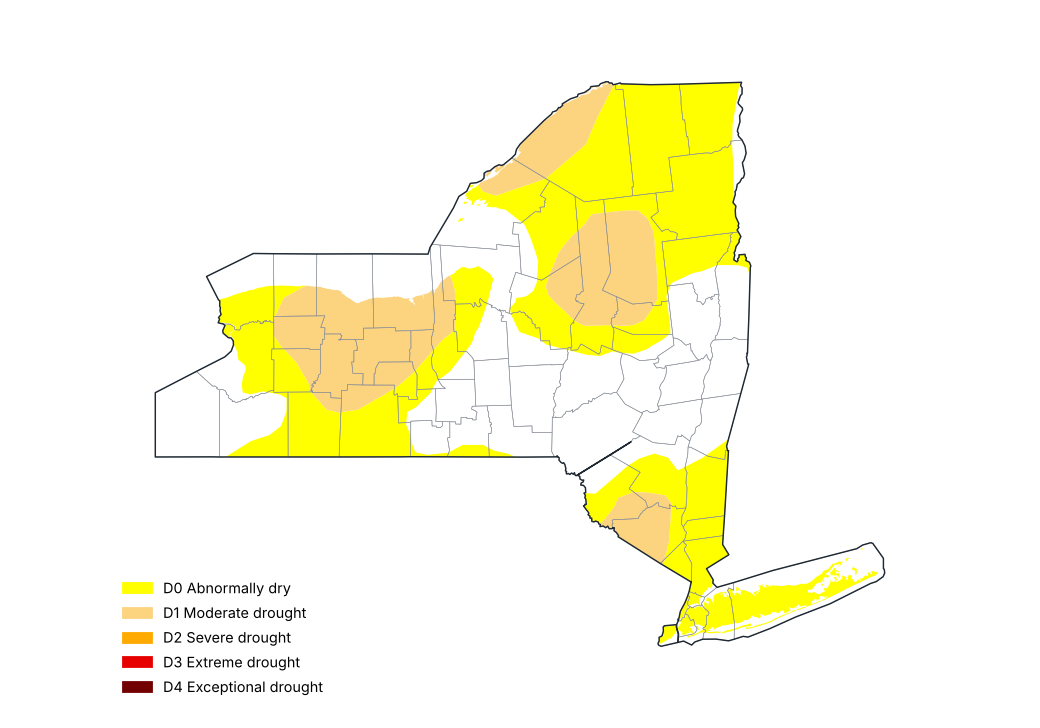
U.S. Drought Monitor, 30 December 2025
Source: National Drought Mitigation Center, USDA, NOAA
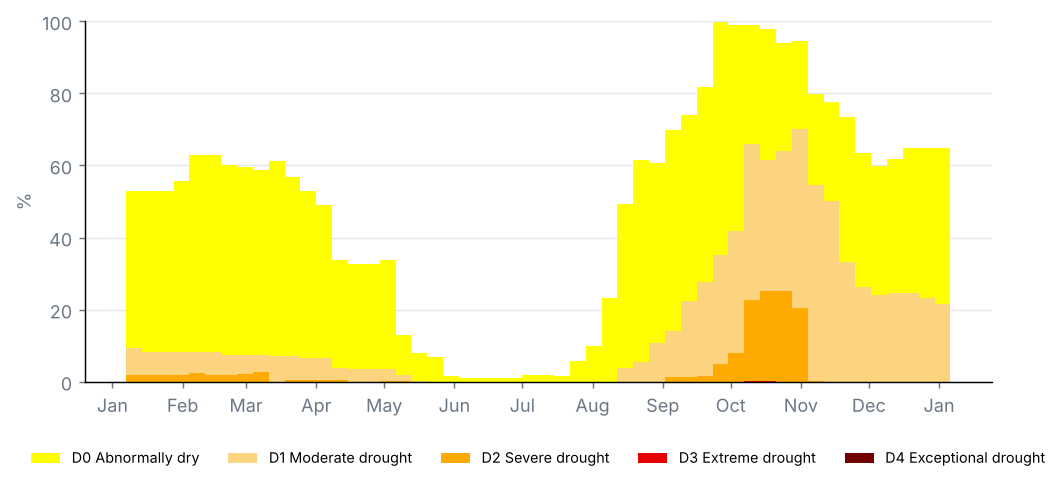
Share of the state by drought category, weekly U.S. Drought Monitor maps (%)
Source: National Drought Mitigation Center, USDA, NOAA
Counties with the most severe drought, U.S. Drought Monitor of 30 December 2025 (% of the county)
| County | D0–D4 (%) | D1–D4 (%) | D2–D4 (%) | D3–D4 (%) | D4 (%) |
|---|---|---|---|---|---|
| Livingston | 100.0 | 100.0 | 0.0 | 0.0 | 0.0 |
| Monroe | 100.0 | 100.0 | 0.0 | 0.0 | 0.0 |
| Ontario | 100.0 | 100.0 | 0.0 | 0.0 | 0.0 |
| Wayne | 100.0 | 100.0 | 0.0 | 0.0 | 0.0 |
| Genesee | 100.0 | 96.0 | 0.0 | 0.0 | 0.0 |
| Orange | 100.0 | 78.1 | 0.0 | 0.0 | 0.0 |
| Orleans | 100.0 | 72.3 | 0.0 | 0.0 | 0.0 |
| Hamilton | 99.8 | 71.1 | 0.0 | 0.0 | 0.0 |
| Herkimer | 100.0 | 67.5 | 0.0 | 0.0 | 0.0 |
| Yates | 100.0 | 66.1 | 0.0 | 0.0 | 0.0 |
Cumulative shares: D1–D4 is the share in moderate drought or worse.
Source: National Drought Mitigation Center, USDA, NOAA
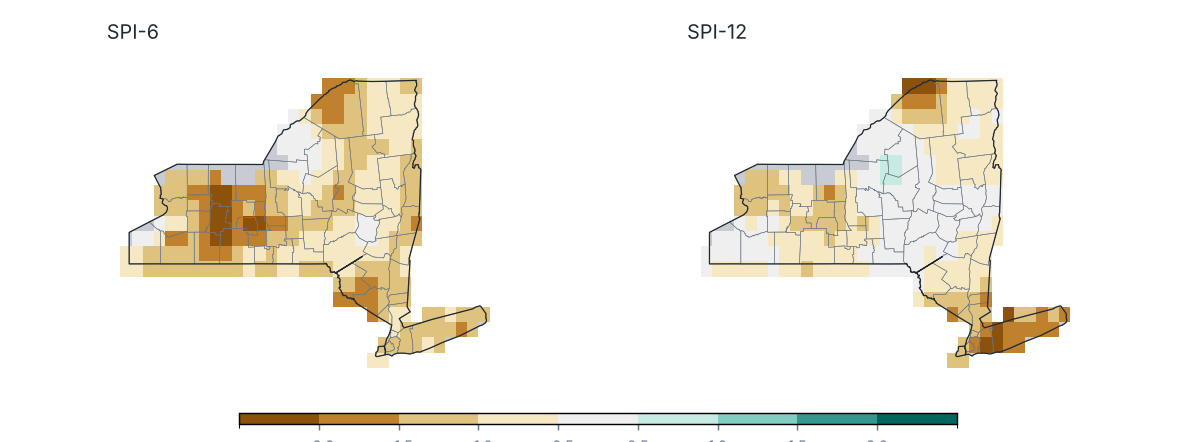
Standardized Precipitation Index (SPI) ending December 2025
Source: NOAA NCEI
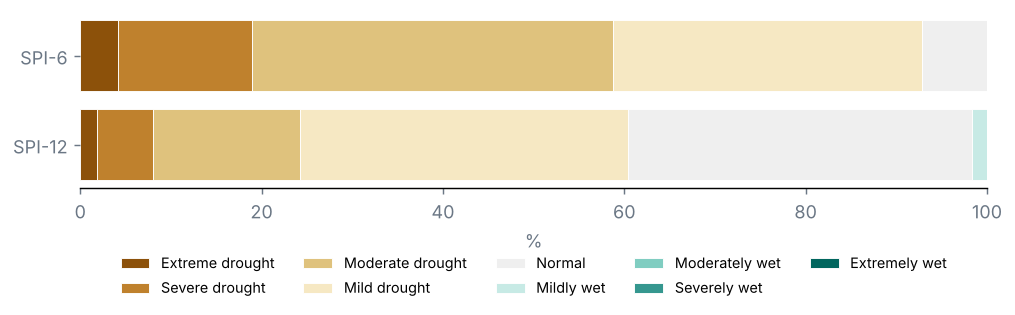
Share of the state by SPI category
Source: NOAA NCEI
Counties with the lowest SPI-12
| County | SPI-6 | SPI-12 | Category |
|---|---|---|---|
| Nassau | −1.1 | −1.9 | Severe drought |
| Suffolk | −1.2 | −1.7 | Severe drought |
| Queens | −1.1 | −1.6 | Severe drought |
| Kings | −1.1 | −1.5 | Severe drought |
| Rockland | −1.3 | −1.4 | Moderate drought |
| Bronx | −1.0 | −1.4 | Moderate drought |
| New York | −1.0 | −1.4 | Moderate drought |
| Westchester | −0.9 | −1.4 | Moderate drought |
| Putnam | −1.1 | −1.4 | Moderate drought |
| Richmond | −1.0 | −1.4 | Moderate drought |
Source: NOAA NCEI
U.S. Drought Monitor, map of 30 December 2025: 22% of the state in drought (D1–D4), 0% in severe drought or worse (D2–D4) and 0% in extreme or exceptional drought (D3–D4); 65% was abnormally dry or in drought (D0–D4).
On the map of 31 December 2024, 14% of the state was in drought: a change of +8 points over the period.
SPI-12 (Jan–Dec 2025): statewide mean −0.67; 24% of the state in drought (SPI ≤ −1.0) and 8% in severe or extreme drought.
Most affected counties: Nassau (−1.93), Suffolk (−1.70) and Queens (−1.60).
SPI-6 (Jul–Dec 2025): 59% of the state in drought.
7 Severe weather and notable events
No tropical cyclone came within 300 km of the state.
9 Outlook
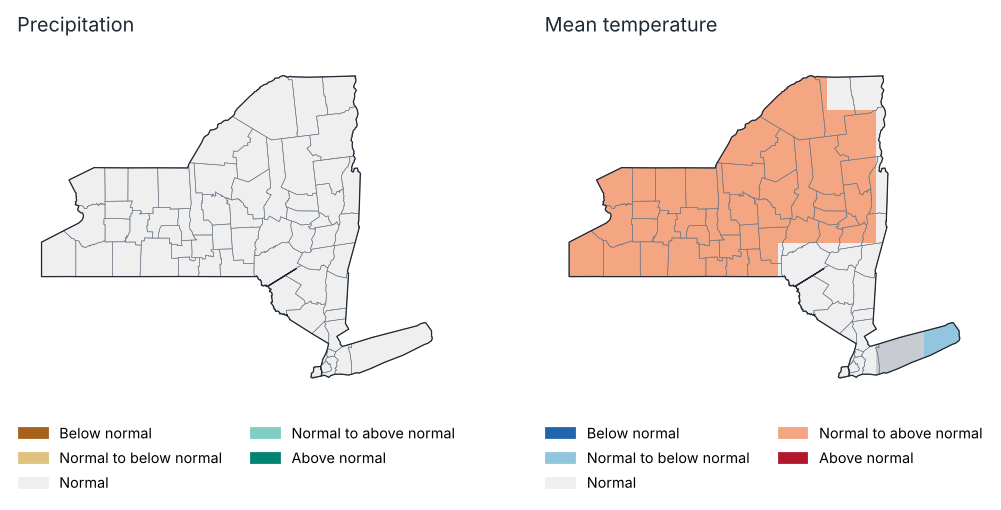
Outlook for Jan–Mar 2026: most likely tercile
Source: NOAA CPC
Probability of each tercile by region, Jan–Mar 2026 (%)
| Region | Precipitation: below | Precipitation: normal | Precipitation: above | Temp.: below | Temp.: normal | Temp.: above |
|---|---|---|---|---|---|---|
| Western Plateau | 30.0 | 36.0 | 34.0 | 22.0 | 35.0 | 44.0 |
| Eastern Plateau | 33.0 | 35.0 | 33.0 | 24.0 | 37.0 | 39.0 |
| Northern Plateau | 31.0 | 36.0 | 34.0 | 23.0 | 35.0 | 42.0 |
| Coastal | 37.0 | 35.0 | 28.0 | 36.0 | 35.0 | 29.0 |
| Hudson Valley | 34.0 | 34.0 | 33.0 | 26.0 | 36.0 | 38.0 |
| Mohawk Valley | 31.0 | 34.0 | 34.0 | 23.0 | 36.0 | 41.0 |
| Champlain Valley | 32.0 | 34.0 | 34.0 | 26.0 | 34.0 | 41.0 |
| St. Lawrence Valley | 31.0 | 36.0 | 33.0 | 25.0 | 33.0 | 42.0 |
| Great Lakes | 31.0 | 34.0 | 35.0 | 20.0 | 35.0 | 45.0 |
| Central Lakes | 30.0 | 34.0 | 36.0 | 22.0 | 35.0 | 44.0 |
Source: NOAA CPC
Probabilistic outlook from the North American Multi-Model Ensemble (NMME), initialised in January 2026, relative to 1991–2020 terciles. It is not an official forecast: consult the National Weather Service and NOAA's Climate Prediction Center.
Precipitation, Jan–Mar 2026: above normal is favoured over 0% of the state and below normal over 0%.
Mean temperature, Jan–Mar 2026: above normal is favoured over 76% of the state and below normal over 2%.
10 Annexes
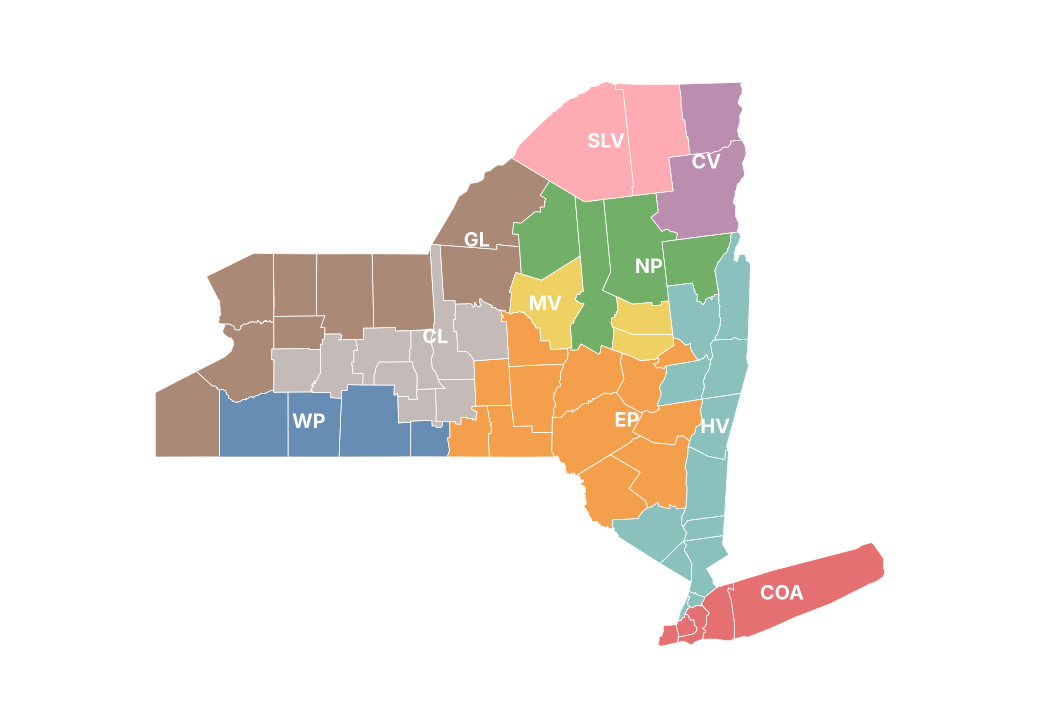
Report climate regions
Monthly precipitation by county (mm)
| County | Jan | Feb | Mar | Apr | May | Jun | Jul | Aug | Sep | Oct | Nov | Dec |
|---|---|---|---|---|---|---|---|---|---|---|---|---|
| Albany | 29.0 | 61.7 | 54.8 | 85.8 | 183.9 | 118.8 | 66.4 | 50.3 | 98.1 | 99.5 | 64.5 | 81.3 |
| Allegany | 31.2 | 66.5 | 54.5 | 95.3 | 147.8 | 118.8 | 67.8 | 60.0 | 30.7 | 98.2 | 86.0 | 68.3 |
| Bronx | 14.2 | 65.8 | 121.8 | 74.8 | 145.8 | 63.2 | 100.1 | 46.1 | 63.5 | 119.1 | 48.2 | 84.7 |
| Broome | 41.5 | 79.8 | 58.6 | 81.1 | 171.5 | 122.3 | 110.5 | 63.3 | 65.1 | 108.5 | 60.4 | 81.7 |
| Cattaraugus | 56.6 | 77.3 | 58.0 | 112.4 | 155.5 | 137.1 | 64.3 | 59.6 | 30.6 | 133.0 | 111.7 | 101.0 |
| Cayuga | 45.3 | 87.2 | 41.8 | 86.8 | 146.6 | 102.1 | 60.0 | 79.2 | 36.8 | 95.2 | 82.6 | 87.2 |
| Chautauqua | 59.8 | 67.7 | 48.3 | 110.4 | 130.3 | 119.1 | 63.1 | 66.3 | 43.7 | 160.0 | 94.0 | 126.7 |
| Chemung | 19.2 | 67.0 | 42.2 | 78.2 | 148.7 | 98.6 | 65.3 | 71.1 | 52.6 | 118.6 | 39.3 | 55.0 |
| Chenango | 44.8 | 80.8 | 55.2 | 87.0 | 165.8 | 174.9 | 77.0 | 79.0 | 64.5 | 108.2 | 88.3 | 88.1 |
| Clinton | 45.4 | 90.4 | 61.3 | 81.3 | 106.4 | 61.9 | 75.9 | 50.1 | 60.7 | 108.2 | 85.9 | 61.9 |
| Columbia | 30.1 | 59.9 | 59.8 | 91.0 | 173.2 | 83.1 | 85.7 | 64.6 | 78.9 | 106.1 | 61.2 | 79.0 |
| Cortland | 38.0 | 87.1 | 57.8 | 85.4 | 147.2 | 142.4 | 72.8 | 73.9 | 46.3 | 110.9 | 87.6 | 84.7 |
| Delaware | 37.8 | 69.2 | 61.9 | 78.9 | 181.7 | 141.8 | 98.5 | 87.4 | 91.9 | 106.1 | 78.6 | 82.1 |
| Dutchess | 21.6 | 52.8 | 66.6 | 82.0 | 195.9 | 89.8 | 116.6 | 63.0 | 53.6 | 116.1 | 52.1 | 78.2 |
| Erie | 56.3 | 61.2 | 47.9 | 99.5 | 120.7 | 74.7 | 61.8 | 66.3 | 28.2 | 141.7 | 86.7 | 109.2 |
| Essex | 42.4 | 101.1 | 92.9 | 85.6 | 134.5 | 72.4 | 100.1 | 54.9 | 76.0 | 109.6 | 96.3 | 89.2 |
| Franklin | 48.2 | 90.3 | 71.8 | 86.3 | 106.1 | 75.1 | 89.6 | 58.2 | 70.7 | 108.4 | 109.3 | 83.0 |
| Fulton | 47.1 | 100.7 | 79.4 | 107.5 | 190.7 | 124.7 | 78.2 | 50.2 | 99.8 | 125.5 | 92.7 | 98.9 |
| Genesee | 33.9 | 66.7 | 45.6 | 84.0 | 124.3 | 81.4 | 42.2 | 55.8 | 19.4 | 109.2 | 80.3 | 82.3 |
| Greene | 26.8 | 63.5 | 60.9 | 83.4 | 195.6 | 109.2 | 75.0 | 76.3 | 94.7 | 97.7 | 71.7 | 93.7 |
| Hamilton | 50.4 | 113.4 | 104.2 | 95.5 | 145.7 | 91.2 | 129.6 | 58.1 | 73.4 | 104.6 | 93.9 | 100.5 |
| Herkimer | 81.9 | 109.5 | 83.9 | 91.6 | 152.7 | 136.2 | 99.3 | 49.3 | 67.0 | 96.6 | 131.1 | 105.6 |
| Jefferson | 76.5 | 85.6 | 69.6 | 84.9 | 108.9 | 113.7 | 74.4 | 79.4 | 43.7 | 121.1 | 125.3 | 107.6 |
| Kings | 16.6 | 72.3 | 120.8 | 75.1 | 139.3 | 65.3 | 92.6 | 48.7 | 64.1 | 108.8 | 49.1 | 85.8 |
| Lewis | 103.5 | 107.8 | 80.1 | 99.9 | 132.3 | 119.4 | 109.2 | 55.9 | 58.1 | 106.8 | 149.0 | 118.2 |
| Livingston | 23.7 | 52.9 | 39.2 | 84.5 | 133.8 | 106.1 | 58.6 | 49.2 | 21.6 | 96.6 | 69.0 | 58.3 |
| Madison | 50.5 | 91.7 | 54.5 | 92.2 | 156.2 | 171.1 | 65.4 | 80.1 | 56.8 | 97.8 | 117.1 | 89.4 |
| Monroe | 29.4 | 64.6 | 49.8 | 77.9 | 121.4 | 108.0 | 38.4 | 53.2 | 14.5 | 83.6 | 72.3 | 72.8 |
| Montgomery | 38.5 | 73.3 | 66.0 | 90.2 | 175.6 | 129.2 | 68.6 | 53.3 | 96.5 | 104.4 | 87.3 | 81.9 |
| Nassau | 11.8 | 66.6 | 102.9 | 64.0 | 125.9 | 57.0 | 106.3 | 44.8 | 61.4 | 106.3 | 43.9 | 77.9 |
| New York | 16.3 | 68.7 | 122.2 | 79.5 | 147.8 | 65.8 | 93.6 | 47.4 | 61.3 | 112.9 | 49.5 | 85.3 |
| Niagara | 30.3 | 58.2 | 40.3 | 88.3 | 87.4 | 61.7 | 37.6 | 50.5 | 22.4 | 113.6 | 76.0 | 87.7 |
| Oneida | 86.0 | 121.2 | 70.2 | 92.7 | 148.3 | 155.2 | 93.2 | 49.0 | 63.1 | 93.3 | 133.9 | 116.4 |
| Onondaga | 55.7 | 101.2 | 42.2 | 92.0 | 149.5 | 111.3 | 63.5 | 77.3 | 53.8 | 94.4 | 109.4 | 97.9 |
| Ontario | 22.6 | 55.2 | 38.3 | 72.9 | 132.0 | 89.1 | 64.1 | 62.4 | 23.8 | 91.3 | 62.0 | 58.8 |
| Orange | 19.3 | 60.3 | 80.5 | 82.4 | 228.0 | 96.4 | 86.0 | 44.9 | 55.4 | 93.4 | 49.5 | 65.0 |
| Orleans | 38.3 | 67.8 | 44.5 | 83.4 | 104.7 | 69.0 | 29.7 | 46.0 | 17.7 | 103.6 | 85.2 | 78.7 |
| Oswego | 88.9 | 125.1 | 57.3 | 90.6 | 141.5 | 110.1 | 77.2 | 63.2 | 56.9 | 112.7 | 125.1 | 119.9 |
| Otsego | 47.4 | 73.8 | 68.5 | 84.3 | 171.2 | 165.8 | 73.1 | 74.6 | 81.6 | 104.5 | 103.0 | 79.9 |
| Putnam | 21.2 | 58.4 | 78.1 | 78.2 | 169.3 | 69.6 | 123.5 | 53.4 | 49.0 | 133.0 | 47.4 | 92.4 |
| Queens | 15.7 | 73.6 | 120.7 | 70.5 | 132.6 | 63.8 | 89.2 | 46.6 | 67.8 | 108.9 | 48.5 | 85.4 |
| Rensselaer | 37.4 | 65.3 | 67.1 | 109.4 | 185.1 | 110.9 | 83.0 | 36.1 | 87.7 | 110.4 | 71.5 | 79.0 |
| Richmond | 19.5 | 70.0 | 106.6 | 82.0 | 150.0 | 64.6 | 120.2 | 47.6 | 62.3 | 111.2 | 49.1 | 85.3 |
| Rockland | 17.5 | 64.2 | 93.2 | 79.1 | 167.9 | 69.5 | 118.5 | 48.9 | 55.2 | 127.4 | 44.5 | 79.1 |
| St. Lawrence | 46.4 | 75.5 | 74.5 | 76.8 | 87.2 | 97.5 | 80.7 | 50.3 | 48.1 | 100.8 | 97.3 | 80.4 |
| Saratoga | 28.6 | 90.0 | 74.6 | 112.1 | 192.2 | 107.6 | 70.9 | 40.1 | 99.5 | 128.6 | 70.6 | 94.8 |
| Schenectady | 30.5 | 70.4 | 57.0 | 96.2 | 182.7 | 120.1 | 68.8 | 42.0 | 102.9 | 109.6 | 67.1 | 82.8 |
| Schoharie | 30.5 | 62.7 | 64.3 | 74.6 | 167.2 | 126.7 | 79.8 | 74.5 | 104.1 | 88.2 | 82.3 | 84.3 |
| Schuyler | 17.6 | 63.6 | 37.4 | 79.0 | 143.2 | 104.4 | 76.2 | 62.6 | 39.7 | 97.7 | 45.8 | 50.2 |
| Seneca | 19.7 | 61.1 | 34.3 | 79.8 | 142.9 | 90.0 | 68.7 | 68.6 | 28.7 | 82.6 | 57.3 | 65.1 |
| Steuben | 20.1 | 64.0 | 41.2 | 81.4 | 142.3 | 107.1 | 64.1 | 62.2 | 40.6 | 98.8 | 54.9 | 50.6 |
| Suffolk | 24.1 | 79.9 | 94.0 | 60.4 | 152.1 | 43.0 | 89.2 | 37.8 | 49.5 | 127.0 | 55.6 | 75.4 |
| Sullivan | 28.7 | 57.0 | 70.6 | 96.3 | 261.0 | 122.9 | 88.5 | 69.9 | 81.7 | 95.7 | 62.4 | 73.8 |
| Tioga | 31.9 | 72.3 | 54.0 | 77.3 | 152.0 | 114.2 | 86.8 | 65.8 | 49.6 | 121.4 | 45.2 | 76.3 |
| Tompkins | 23.7 | 71.6 | 51.0 | 70.7 | 141.7 | 136.1 | 75.0 | 64.9 | 38.1 | 112.3 | 59.0 | 66.0 |
| Ulster | 27.7 | 63.0 | 68.4 | 110.7 | 241.3 | 119.3 | 98.1 | 59.9 | 84.8 | 96.0 | 71.2 | 83.3 |
| Warren | 25.9 | 95.1 | 95.8 | 86.5 | 165.4 | 81.5 | 87.4 | 55.6 | 82.9 | 120.0 | 67.5 | 91.6 |
| Washington | 25.8 | 73.6 | 75.9 | 95.2 | 181.0 | 90.2 | 66.9 | 37.8 | 72.7 | 121.5 | 70.4 | 80.6 |
| Wayne | — | — | — | — | — | — | — | — | — | — | — | — |
| Westchester | 14.7 | 59.6 | 95.6 | 71.6 | 155.9 | 60.0 | 134.0 | 54.4 | 58.7 | 137.6 | 42.2 | 86.1 |
| Wyoming | 43.1 | 64.2 | 50.8 | 101.3 | 145.2 | 98.5 | 60.1 | 54.4 | 23.4 | 134.9 | 98.9 | 89.4 |
| Yates | 17.3 | 55.3 | 35.1 | 81.9 | 141.0 | 93.8 | 84.7 | 47.1 | 22.6 | 73.8 | 53.0 | 52.2 |
Source: NOAA NCEI
Monthly maximum temperature by region (°C)
| Region | Jan | Feb | Mar | Apr | May | Jun | Jul | Aug | Sep | Oct | Nov | Dec |
|---|---|---|---|---|---|---|---|---|---|---|---|---|
| Western Plateau | −2.9 | −0.2 | 10.2 | 14.6 | 18.2 | 25.6 | 28.8 | 25.4 | 23.8 | 16.5 | 7.1 | 0.2 |
| Eastern Plateau | −2.5 | −0.3 | 9.5 | 14.2 | 17.9 | 24.7 | 28.4 | 25.2 | 23.0 | 15.9 | 6.8 | −0.2 |
| Northern Plateau | −4.0 | −2.6 | 6.5 | 11.9 | 16.9 | 23.1 | 27.0 | 24.7 | 21.7 | 14.9 | 4.2 | −2.1 |
| Coastal | 3.1 | 5.1 | 12.2 | 16.0 | 20.0 | 26.1 | 29.7 | 27.2 | 24.9 | 18.8 | 12.1 | 5.2 |
| Hudson Valley | −0.1 | 1.4 | 10.9 | 15.7 | 19.8 | 26.1 | 29.9 | 26.9 | 24.3 | 17.4 | 8.5 | 1.4 |
| Mohawk Valley | −2.6 | −1.2 | 8.5 | 13.7 | 18.2 | 24.8 | 28.8 | 26.3 | 23.5 | 16.2 | 6.3 | −0.6 |
| Champlain Valley | −4.7 | −3.2 | 6.7 | 11.6 | 17.0 | 23.7 | 26.7 | 24.4 | 21.3 | 14.8 | 3.7 | −2.4 |
| St. Lawrence Valley | −4.3 | −3.0 | 6.9 | 12.6 | 18.0 | 24.3 | 27.7 | 25.5 | 22.2 | 15.4 | 3.5 | −2.0 |
| Great Lakes | −2.4 | −0.9 | 9.5 | 13.7 | 17.5 | 25.1 | 28.3 | 25.8 | 23.3 | 16.4 | 6.9 | 0.5 |
| Central Lakes | −2.2 | −0.3 | 10.1 | 14.2 | 17.8 | 25.4 | 28.6 | 25.7 | 23.5 | 16.3 | 7.2 | 0.4 |
Source: NOAA NCEI
Monthly mean temperature by region (°C)
| Region | Jan | Feb | Mar | Apr | May | Jun | Jul | Aug | Sep | Oct | Nov | Dec |
|---|---|---|---|---|---|---|---|---|---|---|---|---|
| Western Plateau | −6.6 | −4.3 | 3.6 | 8.0 | 12.8 | 19.6 | 22.1 | 18.2 | 16.1 | 9.7 | 2.8 | −4.7 |
| Eastern Plateau | −6.6 | −4.7 | 3.2 | 7.4 | 12.8 | 18.8 | 22.0 | 18.2 | 15.9 | 9.4 | 2.4 | −5.0 |
| Northern Plateau | −8.3 | −7.9 | 0.2 | 5.3 | 11.6 | 17.4 | 20.6 | 17.8 | 14.8 | 8.6 | 0.3 | −7.6 |
| Coastal | −0.7 | 1.1 | 6.9 | 11.1 | 15.6 | 21.5 | 25.2 | 22.0 | 20.1 | 14.2 | 7.6 | 0.8 |
| Hudson Valley | −4.6 | −3.3 | 4.6 | 9.3 | 14.7 | 20.5 | 23.9 | 20.2 | 17.6 | 11.3 | 3.9 | −3.3 |
| Mohawk Valley | −6.8 | −5.8 | 2.4 | 7.0 | 12.9 | 18.9 | 22.2 | 19.2 | 16.4 | 9.9 | 2.1 | −5.7 |
| Champlain Valley | −9.1 | −8.6 | 0.4 | 5.2 | 11.8 | 17.9 | 20.7 | 18.0 | 14.9 | 8.8 | 0.1 | −7.9 |
| St. Lawrence Valley | −8.6 | −8.5 | 0.5 | 5.8 | 12.5 | 18.4 | 21.2 | 18.6 | 15.3 | 9.1 | −0.1 | −7.8 |
| Great Lakes | −5.8 | −4.9 | 3.4 | 7.7 | 12.8 | 19.9 | 22.6 | 19.7 | 16.9 | 10.7 | 3.2 | −4.0 |
| Central Lakes | −5.7 | −4.2 | 3.8 | 7.9 | 13.0 | 19.9 | 22.6 | 19.4 | 16.8 | 10.4 | 3.3 | −3.9 |
Source: NOAA NCEI
Monthly minimum temperature by region (°C)
| Region | Jan | Feb | Mar | Apr | May | Jun | Jul | Aug | Sep | Oct | Nov | Dec |
|---|---|---|---|---|---|---|---|---|---|---|---|---|
| Western Plateau | −10.3 | −8.5 | −3.0 | 1.3 | 7.5 | 13.7 | 15.5 | 11.0 | 8.5 | 3.0 | −1.5 | −9.6 |
| Eastern Plateau | −10.7 | −9.0 | −3.1 | 0.6 | 7.6 | 12.8 | 15.6 | 11.2 | 8.9 | 3.0 | −1.9 | −9.7 |
| Northern Plateau | −12.7 | −13.3 | −6.1 | −1.4 | 6.4 | 11.7 | 14.3 | 10.9 | 7.9 | 2.3 | −3.5 | −13.1 |
| Coastal | −4.6 | −2.8 | 1.7 | 6.2 | 11.1 | 16.9 | 20.8 | 16.7 | 15.3 | 9.6 | 3.1 | −3.5 |
| Hudson Valley | −9.1 | −8.0 | −1.7 | 2.8 | 9.6 | 14.8 | 17.9 | 13.4 | 10.8 | 5.2 | −0.7 | −8.0 |
| Mohawk Valley | −11.0 | −10.5 | −3.8 | 0.2 | 7.6 | 13.0 | 15.7 | 12.2 | 9.2 | 3.5 | −2.1 | −10.7 |
| Champlain Valley | −13.5 | −14.1 | −5.9 | −1.2 | 6.7 | 12.1 | 14.7 | 11.5 | 8.6 | 2.9 | −3.6 | −13.5 |
| St. Lawrence Valley | −13.0 | −14.1 | −6.0 | −0.9 | 7.1 | 12.5 | 14.8 | 11.6 | 8.5 | 2.8 | −3.7 | −13.5 |
| Great Lakes | −9.1 | −8.9 | −2.6 | 1.7 | 8.1 | 14.8 | 16.9 | 13.7 | 10.4 | 5.0 | −0.6 | −8.5 |
| Central Lakes | −9.2 | −8.0 | −2.4 | 1.5 | 8.1 | 14.4 | 16.5 | 13.1 | 10.0 | 4.5 | −0.6 | −8.2 |
Source: NOAA NCEI
Stations used
| Id | Name | County | Latitude | Longitude | Altitude (m) | Days with data (Tmax) (%) |
|---|---|---|---|---|---|---|
| USC00300055 | Albion | Orleans | 43.2 | −78.2 | 183.8 | 99.0 |
| USC00300063 | Alcove Dam | Albany | 42.5 | −73.9 | 191.4 | 90.0 |
| USC00300085 | Alfred | Allegany | 42.3 | −77.8 | 586.4 | 99.0 |
| USC00300093 | Allegany Sp | Cattaraugus | 42.1 | −78.7 | 457.2 | 100.0 |
| USC00300183 | Angelica | Allegany | 42.3 | −78.0 | 449.6 | 100.0 |
| USC00300220 | Arcade | Wyoming | 42.5 | −78.5 | 434.9 | 0.0 |
| USC00300317 | Attica 7 SW | Wyoming | 42.8 | −78.4 | 416.1 | 0.0 |
| USC00300321 | Auburn | Cayuga | 42.9 | −76.5 | 234.7 | 100.0 |
| USC00300343 | Avon | Livingston | 42.9 | −77.8 | 166.1 | 100.0 |
| USC00300364 | Baiting Hollow | Suffolk | 40.9 | −72.7 | 21.3 | 93.0 |
| USC00300379 | Baldwinsville | Onondaga | 43.1 | −76.3 | 115.5 | 0.0 |
| USC00300443 | Batavia | Genesee | 43.0 | −78.2 | 278.3 | 100.0 |
| USC00300500 | Beaver Falls | Lewis | 43.9 | −75.4 | 225.6 | 0.0 |
| USC00300608 | Bennetts Brg | Oswego | 43.5 | −76.0 | 201.2 | 0.0 |
| USC00300668 | Big Moose 3 SE | Herkimer | 43.8 | −74.9 | 591.3 | 37.0 |
| USC00300707 | Black Rvr | Jefferson | 44.0 | −75.8 | 158.5 | 0.0 |
| USC00300785 | Boonville 4 SSW | Oneida | 43.4 | −75.4 | 472.4 | 100.0 |
| USC00300870 | Brewerton Lock 23 | Onondaga | 43.2 | −76.2 | 114.9 | 96.0 |
| USC00300889 | Bridgehampton | Suffolk | 41.0 | −72.3 | 12.8 | 97.0 |
| USC00300910 | Bristol Harbour | Ontario | 42.7 | −77.3 | 286.5 | 0.0 |
| USC00300937 | Brockport | Monroe | 43.2 | −78.0 | 151.8 | 100.0 |
| USC00301068 | Buskirk | Rensselaer | 42.9 | −73.4 | 152.1 | 100.0 |
| USC00301102 | Callicoon Ctr | Sullivan | 41.8 | −75.0 | 372.2 | 100.0 |
| USC00301110 | Camden | Oneida | 43.3 | −75.8 | 176.8 | 38.0 |
| USC00301152 | Canandaigua 3 S | Ontario | 42.8 | −77.3 | 219.5 | 100.0 |
| USC00301211 | Carmel 4N | Putnam | 41.5 | −73.7 | 207.3 | 19.0 |
| USC00301264 | Cattaraugus 3W | Cattaraugus | 42.3 | −78.9 | 520.6 | 0.0 |
| USC00301265 | Cayuga Lock #1 | Cayuga | 42.9 | −76.7 | 115.8 | 0.0 |
| USC00301309 | Centerport | Suffolk | 40.9 | −73.4 | 9.1 | 100.0 |
| USC00301388 | Chases Lake | Lewis | 43.8 | −75.3 | 390.4 | 0.0 |
| USC00301580 | Clyde Lock 26 | Wayne | 43.1 | −76.8 | 119.5 | 0.0 |
| USC00301625 | Colden 1W | Erie | 42.6 | −78.7 | 467.9 | 100.0 |
| USC00301664 | Colton 2 N | St. Lawrence | 44.6 | −75.0 | 176.8 | 92.0 |
| USC00301708 | Conklingville Dam | Saratoga | 43.3 | −73.9 | 246.3 | 100.0 |
| USC00301752 | Cooperstown | Otsego | 42.7 | −74.9 | 383.1 | 100.0 |
| USC00301787 | Corning | Steuben | 42.1 | −77.1 | 349.6 | 100.0 |
| USC00301966 | Dannemora | Clinton | 44.7 | −73.7 | 408.4 | 91.0 |
| USC00301974 | Dansville | Livingston | 42.6 | −77.7 | 201.2 | 100.0 |
| USC00302036 | Delhi 2 SE | Delaware | 42.3 | −74.9 | 445.0 | 95.0 |
| USC00302169 | Downsville Dam | Delaware | 42.1 | −75.0 | 365.8 | 75.0 |
| USC00302197 | Dunkirk | Chautauqua | 42.5 | −79.3 | 192.3 | 100.0 |
| USC00302454 | E Sidney | Delaware | 42.3 | −75.2 | 352.0 | 100.0 |
| USC00302554 | Elizabethtown | Essex | 44.2 | −73.6 | 186.2 | 0.0 |
| USC00302610 | Elmira | Chemung | 42.1 | −76.8 | 288.6 | 100.0 |
| USC00302934 | Ft Drum | Jefferson | 44.1 | −75.7 | 213.4 | 0.0 |
| USC00303025 | Franklinville | Cattaraugus | 42.3 | −78.5 | 484.6 | 84.0 |
| USC00303050 | Freeville 1 NE | Tompkins | 42.5 | −76.3 | 317.6 | 100.0 |
| USC00303087 | Fulton | Oswego | 43.3 | −76.4 | 109.7 | 100.0 |
| USC00303088 | Fulton Lock O-3 | Oswego | 43.3 | −76.4 | 102.4 | 0.0 |
| USC00303184 | Geneva Rsch Farm | Ontario | 42.9 | −77.0 | 218.8 | 99.0 |
| USC00303322 | Gloversville 7NW (Peck Lake) | Fulton | 43.1 | −74.4 | 443.5 | 99.0 |
| USC00303346 | Gouverneur 3 NW | St. Lawrence | 44.4 | −75.5 | 128.0 | 88.0 |
| USC00303444 | Greene | Chenango | 42.3 | −75.8 | 280.4 | 0.0 |
| USC00303773 | Hemlock | Livingston | 42.8 | −77.6 | 274.9 | 100.0 |
| USC00303851 | Highmarket 2W | Lewis | 43.6 | −75.6 | 549.9 | 100.0 |
| USC00303955 | Honeoye | Ontario | 42.8 | −77.5 | 243.8 | 100.0 |
| USC00303961 | Hooker 12 NNW | Lewis | 43.9 | −75.7 | 450.5 | 0.0 |
| USC00303983 | Hornell Almond Dam | Steuben | 42.3 | −77.7 | 403.9 | 100.0 |
| USC00304025 | Hudson Correctional Facility | Columbia | 42.2 | −73.8 | 9.1 | 97.0 |
| USC00304102 | Indian Lake 2SW | Hamilton | 43.8 | −74.3 | 509.0 | 100.0 |
| USC00304174 | Ithaca Cornell Univ | Tompkins | 42.4 | −76.4 | 292.6 | 100.0 |
| USC00304207 | Jamestown 4 ENE | Chautauqua | 42.1 | −79.2 | 381.0 | 100.0 |
| USC00304526 | La Fargeville 4E | Jefferson | 44.2 | −75.9 | 132.6 | 0.0 |
| USC00304537 | Lake Luzerne | Saratoga | 43.3 | −73.8 | 185.9 | 0.0 |
| USC00304555 | Lake Placid 2 S | Essex | 44.3 | −74.0 | 575.5 | 80.0 |
| USC00304564 | Lake View 1NE | Erie | 42.7 | −78.9 | 197.2 | 0.0 |
| USC00304565 | Lakeside | Orleans | 43.4 | −78.3 | 87.8 | 0.0 |
| USC00304566 | Lakeville | Livingston | 42.8 | −77.7 | 250.2 | 0.0 |
| USC00304575 | Lansing Manor | Schoharie | 42.4 | −74.5 | 338.3 | 88.0 |
| USC00304684 | Le Roy 1E | Genesee | 43.0 | −78.0 | 272.8 | 0.0 |
| USC00304715 | Lewiston | Niagara | 43.2 | −79.0 | 108.2 | 0.0 |
| USC00304731 | Liberty 1 NE | Sullivan | 41.8 | −74.7 | 481.6 | 100.0 |
| USC00304808 | Little Valley | Cattaraugus | 42.2 | −78.8 | 495.3 | 100.0 |
| USC00304844 | Lockport 2SE | Niagara | 43.2 | −78.7 | 195.7 | 100.0 |
| USC00304912 | Lowville | Lewis | 43.8 | −75.5 | 263.0 | 100.0 |
| USC00304952 | Macedon Lock E30 | Wayne | 43.1 | −77.3 | 142.0 | 0.0 |
| USC00304996 | Malone | Franklin | 44.8 | −74.3 | 267.6 | 100.0 |
| USC00305142 | Mattituck | Suffolk | 41.0 | −72.5 | 6.1 | 48.0 |
| USC00305233 | Mecklenburg 4SW | Schuyler | 42.4 | −76.8 | 460.2 | 100.0 |
| USC00305236 | Medina | Orleans | 43.2 | −78.4 | 164.0 | 0.0 |
| USC00305280 | Mexico 2SW | Oswego | 43.4 | −76.3 | 129.5 | 0.0 |
| USC00305426 | Mohonk Lake | Ulster | 41.8 | −74.2 | 336.5 | 66.0 |
| USC00305512 | Morrisville 6 SW | Madison | 42.8 | −75.7 | 512.4 | 95.0 |
| USC00305597 | Mt Morris 2W | Livingston | 42.7 | −77.9 | 268.2 | 100.0 |
| USC00305606 | Mt Sinai | Suffolk | 40.9 | −73.0 | 15.2 | 20.0 |
| USC00305679 | Newark | Wayne | 43.0 | −77.1 | 131.1 | 0.0 |
| USC00305714 | Newcomb | Essex | 44.0 | −74.2 | 502.0 | 99.0 |
| USC00305715 | Newfane | Niagara | 43.3 | −78.7 | 104.2 | 0.0 |
| USC00305840 | Niagara Falls | Niagara | 43.1 | −79.0 | 179.2 | 0.0 |
| USC00305925 | N Creek 5 SE | Warren | 43.7 | −73.9 | 271.3 | 0.0 |
| USC00306047 | N Tonawanda | Niagara | 43.1 | −78.9 | 176.2 | 100.0 |
| USC00306062 | Northville | Fulton | 43.2 | −74.2 | 240.8 | 0.0 |
| USC00306085 | Norwich | Chenango | 42.5 | −75.5 | 301.4 | 98.0 |
| USC00306184 | Old Forge | Herkimer | 43.7 | −75.0 | 520.0 | 0.0 |
| USC00306196 | Olean | Cattaraugus | 42.1 | −78.5 | 432.8 | 100.0 |
| USC00306276 | Orient Pt Sp | Suffolk | 41.1 | −72.3 | 0.9 | 0.0 |
| USC00306300 | Osceola | Lewis | 43.5 | −75.7 | 335.6 | 0.0 |
| USC00306314 | Oswego | Oswego | 43.5 | −76.5 | 98.8 | 100.0 |
| USC00306376 | Palermo 2SSE | Oswego | 43.3 | −76.3 | 135.6 | 0.0 |
| USC00306465 | Pavilion 2 | Genesee | 42.9 | −78.0 | 353.6 | 0.0 |
| USC00306480 | Pendleton 1NE | Niagara | 43.1 | −78.7 | 179.5 | 0.0 |
| USC00306525 | Perrysburg | Cattaraugus | 42.5 | −79.0 | 368.8 | 100.0 |
| USC00306570 | Phonecia 2SW | Ulster | 42.1 | −74.3 | 323.1 | 0.0 |
| USC00306660 | Plattsburgh 1 S | Clinton | 44.7 | −73.5 | 54.3 | 0.0 |
| USC00306747 | Portland 1SW | Chautauqua | 42.4 | −79.5 | 246.3 | 100.0 |
| USC00306774 | Port Jervis | Orange | 41.4 | −74.7 | 176.8 | 100.0 |
| USC00306867 | Pulaski | Oswego | 43.6 | −76.1 | 121.6 | 96.0 |
| USC00307134 | Riverhead Rsch Farm | Suffolk | 41.0 | −72.7 | 30.5 | 100.0 |
| USC00307274 | Rosendale 2 E | Ulster | 41.8 | −74.0 | 37.2 | 0.0 |
| USC00307329 | Rushford | Allegany | 42.4 | −78.2 | 463.9 | 0.0 |
| USC00307383 | St James | Suffolk | 40.9 | −73.1 | 38.1 | 0.0 |
| USC00307425 | Sanborn 4NE | Niagara | 43.2 | −78.8 | 192.9 | 0.0 |
| USC00307484 | Saratoga Springs 4 SW | Saratoga | 43.0 | −73.8 | 99.4 | 91.0 |
| USC00307705 | Sherburne | Chenango | 42.7 | −75.5 | 333.8 | 100.0 |
| USC00307742 | Shrub Oak | Westchester | 41.3 | −73.8 | 140.8 | 100.0 |
| USC00307749 | Silver Springs 3N | Wyoming | 42.7 | −78.1 | 508.1 | 0.0 |
| USC00307750 | Silver Creek | Chautauqua | 42.5 | −79.2 | 198.1 | 0.0 |
| USC00307780 | Skaneateles | Onondaga | 42.9 | −76.4 | 266.7 | 0.0 |
| USC00307842 | Sodus 1W | Wayne | 43.2 | −77.1 | 135.3 | 99.0 |
| USC00308132 | Springville 5NE | Erie | 42.5 | −78.6 | 515.4 | 0.0 |
| USC00308248 | Stillwater Rsvr | Herkimer | 43.9 | −75.0 | 515.1 | 94.0 |
| USC00308412 | Taylorville | Lewis | 43.9 | −75.3 | 303.3 | 0.0 |
| USC00308455 | Theresa 4NW | Jefferson | 44.3 | −75.8 | 110.0 | 0.0 |
| USC00308577 | Syosset | Nassau | 40.8 | −73.5 | 80.8 | 0.0 |
| USC00308578 | Trenton Falls | Herkimer | 43.3 | −75.2 | 243.8 | 96.0 |
| USC00308600 | Troy L&D | Rensselaer | 42.8 | −73.7 | 4.6 | 0.0 |
| USC00308631 | Tupper Lake Sunmount | Franklin | 44.2 | −74.4 | 512.1 | 54.0 |
| USC00308721 | Upton Coop - Nwsfo New York | Suffolk | 40.9 | −72.9 | 24.4 | 100.0 |
| USC00308839 | Victor 2NW | Ontario | 43.0 | −77.4 | 199.3 | 100.0 |
| USC00308910 | Wales | Erie | 42.7 | −78.5 | 342.9 | 100.0 |
| USC00308932 | Walton 2 | Delaware | 42.2 | −75.1 | 451.1 | 100.0 |
| USC00308961 | Warsaw 4 W | Wyoming | 42.7 | −78.2 | 533.4 | 0.0 |
| USC00308962 | Warsaw 6 SW | Wyoming | 42.7 | −78.2 | 554.7 | 100.0 |
| USC00309000 | Watertown | Jefferson | 44.0 | −75.9 | 151.5 | 100.0 |
| USC00309047 | Waverly | Tioga | 42.0 | −76.5 | 243.8 | 98.0 |
| USC00309049 | Webster 2 NE | Monroe | 43.2 | −77.4 | 83.8 | 100.0 |
| USC00309072 | Wellsville | Allegany | 42.1 | −77.9 | 460.2 | 100.0 |
| USC00309089 | W Bloomfield 1 S | Ontario | 42.9 | −77.5 | 301.8 | 0.0 |
| USC00309248 | Westmoreland 4N | Oneida | 43.2 | −75.5 | 172.2 | 0.0 |
| USC00309292 | W Pt | Orange | 41.4 | −74.0 | 97.5 | 8.0 |
| USC00309307 | West Seneca 1 NE | Erie | 42.8 | −78.8 | 200.9 | 0.0 |
| USC00309389 | Whitehall | Washington | 43.6 | −73.4 | 36.3 | 44.0 |
| USC00309425 | Whitesville 1N | Allegany | 42.1 | −77.8 | 661.4 | 0.0 |
| USC00309442 | Whitney Pt Dam | Broome | 42.3 | −76.0 | 317.0 | 100.0 |
| USC00309499 | Wilmington 2W | Essex | 44.4 | −73.9 | 615.7 | 0.0 |
| USC00309593 | Wyoming 3W | Wyoming | 42.8 | −78.1 | 475.2 | 0.0 |
| USC00309690 | Youngstown 1S | Niagara | 43.2 | −79.1 | 91.4 | 0.0 |
| USW00004720 | Jamestown | Chautauqua | 42.1 | −79.2 | 525.2 | 0.0 |
| USW00004724 | Niagara Falls Intl AP | Niagara | 43.1 | −78.9 | 178.3 | 97.0 |
| USW00004725 | Binghamton | Broome | 42.2 | −76.0 | 519.1 | 100.0 |
| USW00004742 | Plattsburgh Intl AP | Clinton | 44.6 | −73.5 | 71.9 | 99.0 |
| USW00004781 | Islip-Li Macarthur AP | Suffolk | 40.8 | −73.1 | 25.3 | 100.0 |
| USW00004789 | Montgomery Orange Co AP | Orange | 41.5 | −74.3 | 108.2 | 99.0 |
| USW00014714 | Stewart Fld | Orange | 41.5 | −74.1 | 177.1 | 98.0 |
| USW00014715 | Wheeler Sack Fld Aaf | Jefferson | 44.0 | −75.7 | 214.0 | 0.0 |
| USW00014719 | Westhampton Gabreski AP | Suffolk | 40.9 | −72.6 | 13.1 | 96.0 |
| USW00014732 | Laguardia AP | Queens | 40.8 | −73.9 | 3.0 | 100.0 |
| USW00014733 | Buffalo | Erie | 42.9 | −78.7 | 240.8 | 100.0 |
| USW00014735 | Albany Intl AP | Albany | 42.7 | −73.8 | 85.3 | 100.0 |
| USW00014747 | Dunkirk Chautauqua Co AP | Chautauqua | 42.5 | −79.3 | 203.9 | 92.0 |
| USW00014748 | Elmira Corning Rgnl AP | Chemung | 42.2 | −76.9 | 285.3 | 98.0 |
| USW00014750 | Glens Falls AP | Warren | 43.3 | −73.6 | 97.8 | 100.0 |
| USW00014757 | Poughkeepsie AP | Dutchess | 41.6 | −73.9 | 46.6 | 99.0 |
| USW00014768 | Rochester Gtr Intl | Monroe | 43.1 | −77.7 | 164.6 | 100.0 |
| USW00014771 | Syracuse Hancock Intl AP | Onondaga | 43.1 | −76.1 | 125.0 | 100.0 |
| USW00054746 | Monticello Sullivan | Sullivan | 41.7 | −74.8 | 427.6 | 0.0 |
| USW00054757 | Wellsville Muni AP | Allegany | 42.1 | −78.0 | 637.6 | 93.0 |
| USW00054773 | Fulton Oswego Co AP | Oswego | 43.4 | −76.4 | 143.6 | 98.0 |
| USW00054778 | Penn Yan AP | Yates | 42.6 | −77.1 | 267.3 | 99.0 |
| USW00054780 | Montauk AP | Suffolk | 41.1 | −71.9 | 2.1 | 97.0 |
| USW00054787 | Farmingdale Republic AP | Suffolk | 40.7 | −73.4 | 22.9 | 99.0 |
| USW00054790 | Shirley Brookhaven AP | Suffolk | 40.8 | −72.9 | 20.1 | 98.0 |
| USW00064756 | Millbrook 3 W | Dutchess | 41.8 | −73.7 | 125.9 | 100.0 |
| USW00064758 | Ithaca 13 E | Cortland | 42.4 | −76.2 | 374.3 | 100.0 |
| USW00064775 | Rome Griffiss Airfield | Oneida | 43.2 | −75.4 | 144.8 | 98.0 |
| USW00064776 | Plattsburgh Intl AP | Clinton | 44.6 | −73.5 | 50.3 | 98.0 |
| USW00094704 | Dansville Muni AP | Livingston | 42.6 | −77.7 | 196.0 | 96.0 |
| USW00094725 | Massena Intl AP | St. Lawrence | 44.9 | −74.8 | 61.0 | 98.0 |
| USW00094728 | Ny City Cntrl Park | New York | 40.8 | −74.0 | 42.7 | 100.0 |
| USW00094740 | Saranac Lk Adirondack Rgnl AP | Franklin | 44.4 | −74.2 | 505.7 | 99.0 |
| USW00094745 | Westchester Co AP | Westchester | 41.1 | −73.7 | 112.8 | 98.0 |
| USW00094789 | Jfk Intl AP | Queens | 40.6 | −73.8 | 2.7 | 100.0 |
| USW00094790 | Watertown AP | Jefferson | 44.0 | −76.0 | 94.8 | 100.0 |
Source: NOAA NCEI
11 Glossary, methodology and sources
Anomaly: difference between the observed value and its 1991–2020 normal. Percent of normal: observed total divided by the normal, times 100. Station record: most extreme daily value for the same month in all earlier years of record (at least 20 years).
Temperature: NOAA nClimGrid-Daily. Precipitation: NOAA nClimGrid-Daily. nClimGrid-Daily is the grid behind NOAA's official statewide values; it is averaged here from 1/24° to 1/8° (about 12 km). Mean temperature is (Tmax + Tmin)/2. Statewide, regional and county averages are weighted by the area of each grid cell inside each polygon. Temperature maps, frost days and annex tables are given by region; regions are NOAA NCEI climate divisions, with each county in the division of its centroid. Recent weeks use NCEI's preliminary file of the month; such reports are marked preliminary and updated when the final file is published. Normals refer to 1991-2020; ranks compare values rounded to one decimal. Stations: GHCN-Daily (NOAA NCEI) cooperative and first-order stations; values flagged by its quality control are discarded, as are daily values more than 5 robust standard deviations from the station median and variables whose monthly anomaly differs by more than 3 °C from the gridded analysis. Period means require at least 80% of days with data and station normals at least 20 complete years. This report is generated automatically and does not replace official information from the National Weather Service or the state climatologist.
| Source | Product | License | Citation |
|---|---|---|---|
| NOAA CPC | ONI, Niño-region SST indices (OISST v2.1), NAO and AO | Public domain (NOAA) | NOAA Climate Prediction Center climate indices. |
| NOAA NCEI / PSL | Extended Reconstructed SST v5 (ERSST v5), 2° | Public domain (NOAA) | Huang et al. (2017), J. Climate, doi:10.1175/JCLI-D-16-0836.1 |
| GDACS | Global Disaster Alert and Coordination System event list | See provider terms | — |
| NOAA NCEI | GHCN-Daily | Public domain (NOAA) | Menne et al. (2012), J. Atmos. Oceanic Technol., doi:10.1175/JTECH-D-11-00103.1 |
| NOAA NCEI | IBTrACS v04r01 tropical-cyclone best tracks | Public domain (NOAA) | Knapp et al. (2010), Bull. Amer. Meteor. Soc., doi:10.1175/2009BAMS2755.1 |
| NOAA NCEI | Pacific Decadal Oscillation index (ERSST v5) | Public domain (NOAA) | — |
| NOAA NCEI | nClimGrid-Daily, contiguous United States (1/24°, averaged here to 1/8°) | Public domain (NOAA) | Durre, I., et al. (2022). NOAA's nClimGrid-Daily Version 1. NOAA National Centers for Environmental Information. doi:10.25921/c4gt-r169 |
| NOAA CPC | North American Multi-Model Ensemble (NMME) tercile probabilities, 1° | Public domain (NOAA) | Kirtman et al. (2014), Bull. Amer. Meteor. Soc., doi:10.1175/BAMS-D-12-00050.1 |
| National Drought Mitigation Center, USDA, NOAA | U.S. Drought Monitor, weekly maps and area statistics | Free to use with credit (NDMC) | The U.S. Drought Monitor is jointly produced by the National Drought Mitigation Center at the University of Nebraska-Lincoln, the United States Department of Agriculture and the National Oceanic and Atmospheric Administration. Map courtesy of NDMC. |
| US Census Bureau TIGERweb | US Census Bureau, TIGERweb counties (generalised) | Public domain (US Government work) | — |
Generated by ClimaBulletin (climabulletin.org), open source. Questions and comments: [email protected].