Nueva York · Mensual
Septiembre 2026
Descargas
1 Mensajes clave y sinopsis climática
Fuente: NOAA NCEI
Fuente: NOAA NCEI
2 Condiciones globales y forzantes climáticos
Anomalía de la temperatura superficial del mar, Septiembre 2026 (°C, 1991–2020)
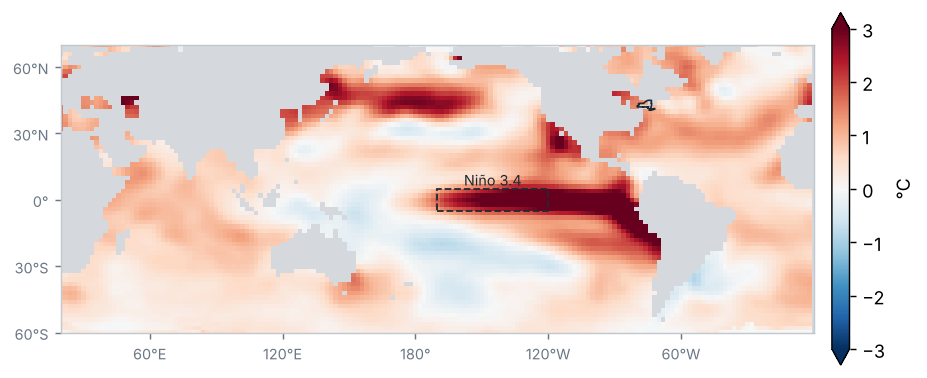
Fuente: NOAA NCEI / PSL
Anomalía de temperatura del mar en las regiones Niño (°C)
| Región | Anomalía (°C) | Cambio respecto al periodo anterior (°C) |
|---|---|---|
| Niño 1+2 | 4.7 | 0.6 |
| Niño 3 | 3.6 | 0.5 |
| Niño 3.4 | 2.8 | 0.3 |
| Niño 4 | 0.9 | 0.0 |
Promedio de los meses del periodo (OISST v2.1)
Fuente: NOAA CPC
Condiciones de El Niño de intensidad muy fuerte: el Índice Oceánico de El Niño (ONI) de JAS 2026 fue de +2.2 °C.
Fuente: NOAA CPC
Anomalía mensual de Niño 3.4, últimos 24 meses (°C)
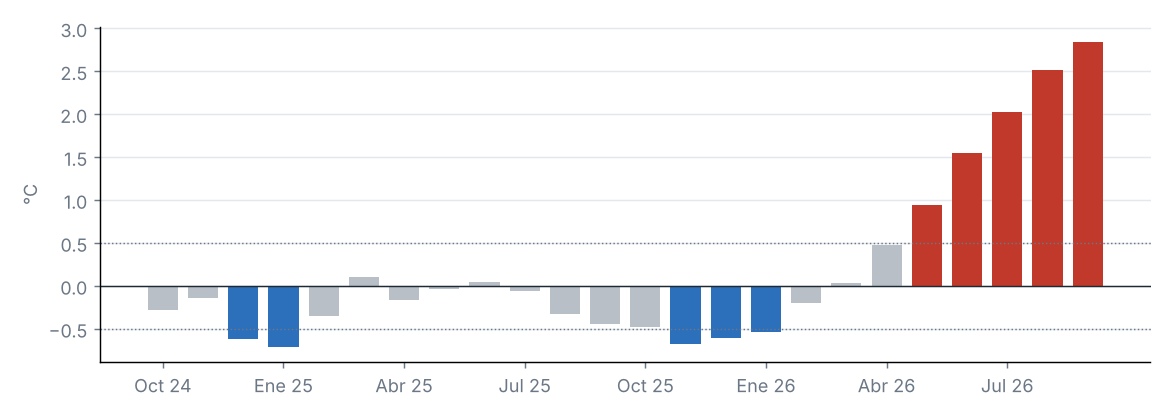
Fuente: NOAA CPC
Diagrama de fases de la MJO (OMI en tiempo real)
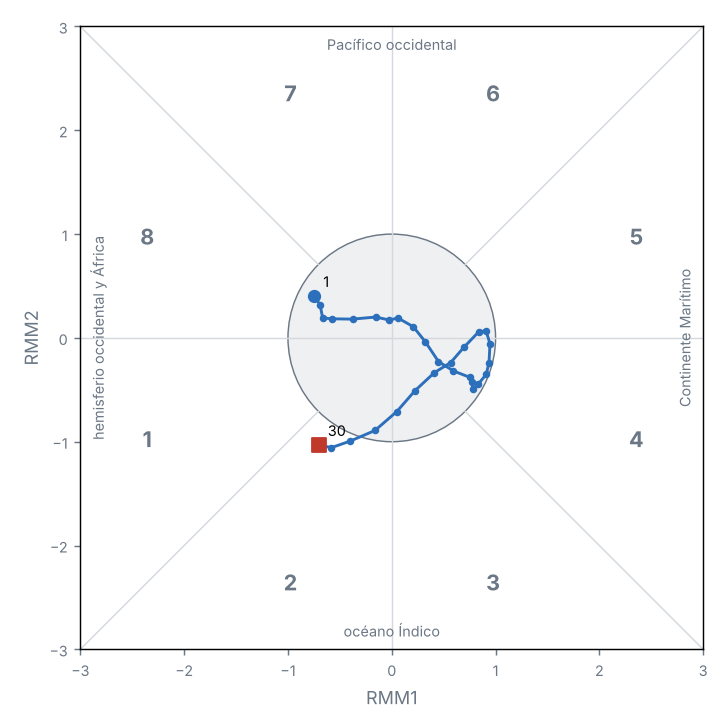
Fuente: NOAA PSL
Índices de teleconexión
| Índice | Valor | Fase |
|---|---|---|
| NAO | 0.5 | Positiva |
| AO | 1.2 | Positiva |
| PDO | −1.6 | Negativa |
Oscilación del Atlántico Norte (NAO); Oscilación Ártica (AO); Oscilación Decadal del Pacífico (PDO).
Fuente: NOAA CPC, NOAA NCEI
La anomalía de Niño 3.4 fue de +2.84 °C (+0.32 °C respecto al periodo anterior).
La MJO estuvo activa en 3 de 30 días, sobre todo en la fase 2 (océano Índico); amplitud media de 0.7.
Otros índices: NAO +0.53 (fase positiva); AO +1.16 (fase positiva); PDO −1.55 (fase negativa).
3 Precipitación
Fuente: NOAA NCEI
Precipitación acumulada
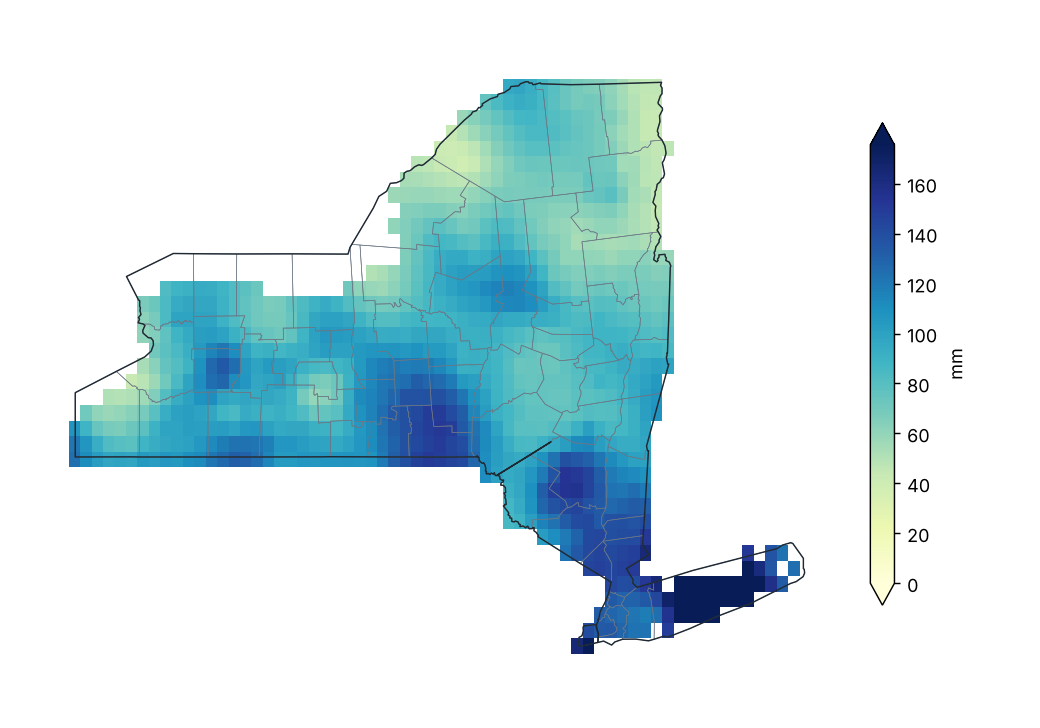
Fuente: NOAA NCEI
Porcentaje de la precipitación normal (1991–2020)
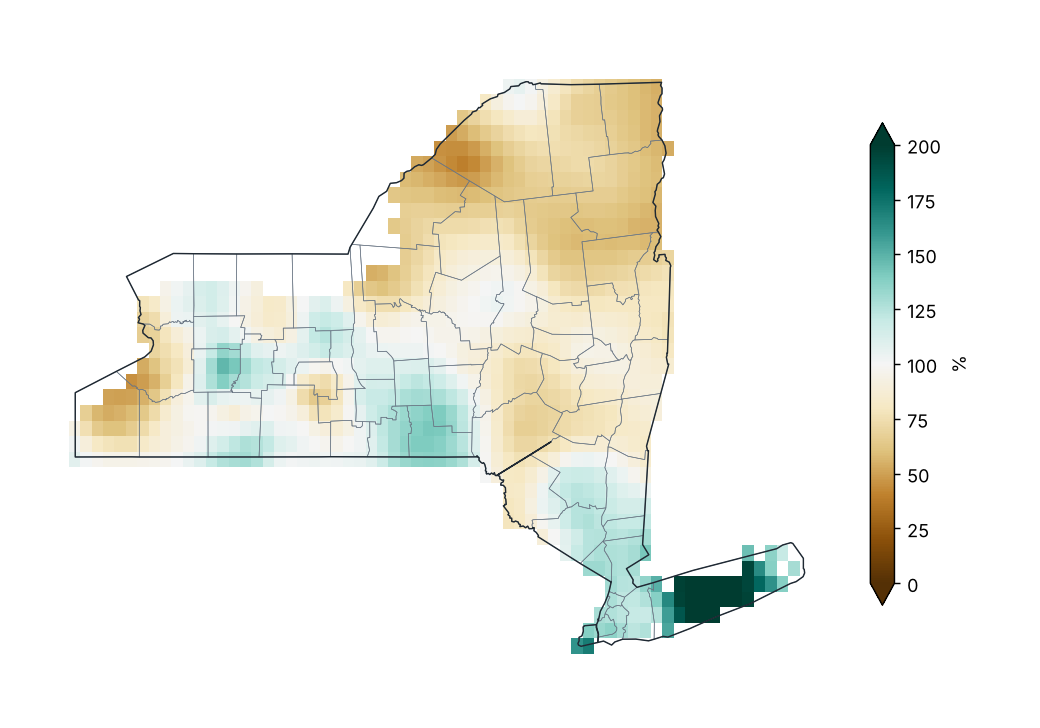
Fuente: NOAA NCEI
Porcentaje de lo normal por condado
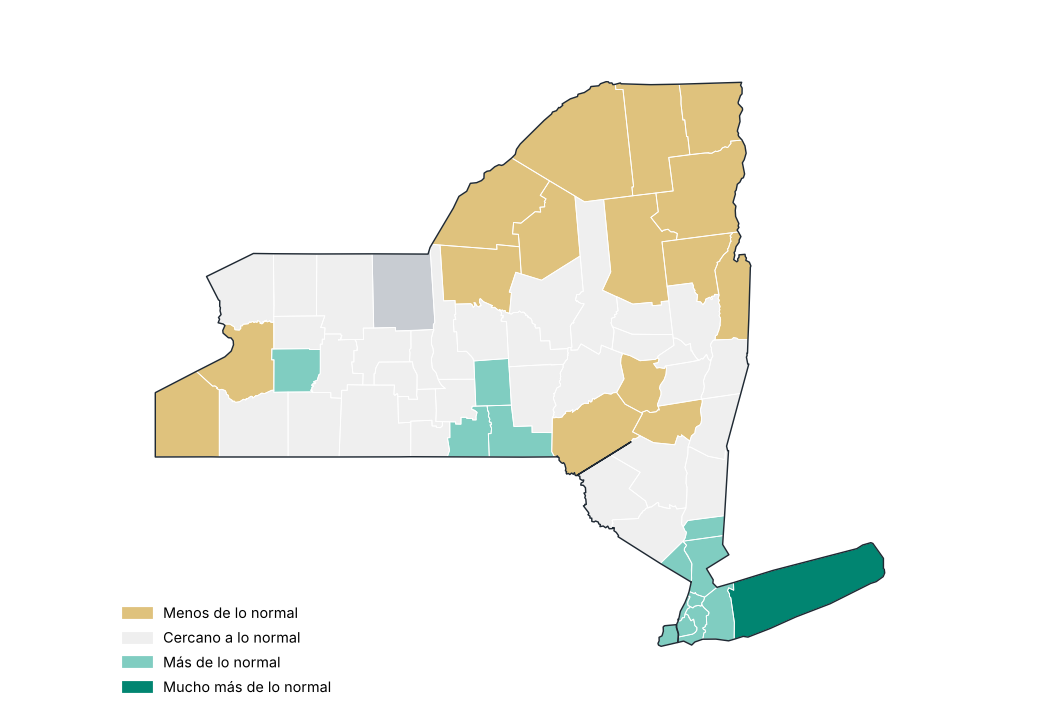
Fuente: NOAA NCEI
Precipitación por región
| Región | Acumulado (mm) | Normal (mm) | Diferencia (%) | Categoría |
|---|---|---|---|---|
| Meseta occidental | 98.3 | 100.0 | −1.7 | Cercano a lo normal |
| Meseta oriental | 107.9 | 110.5 | −2.4 | Cercano a lo normal |
| Meseta norte | 77.9 | 103.6 | −24.8 | Menos de lo normal |
| Costa | 164.4 | 99.6 | 65.1 | Mucho más de lo normal |
| Valle del Hudson | 105.2 | 106.2 | −1.0 | Cercano a lo normal |
| Valle del Mohawk | 92.4 | 100.8 | −8.3 | Cercano a lo normal |
| Valle del Champlain | 56.9 | 91.9 | −38.1 | Menos de lo normal |
| Valle del San Lorenzo | 70.2 | 101.6 | −30.8 | Menos de lo normal |
| Grandes Lagos | 76.5 | 95.9 | −20.3 | Menos de lo normal |
| Lagos centrales | 98.1 | 93.0 | 5.5 | Cercano a lo normal |
Fuente: NOAA NCEI
Estaciones con mayor exceso de precipitación
| Región | Condado | Estación | Altitud (m) | Anomalía (%) |
|---|---|---|---|---|
| Costa | Suffolk | Islip-Li Macarthur AP | 25.0 | 143.1 |
| Costa | Suffolk | Westhampton Gabreski AP | 13.0 | 142.9 |
| Costa | Suffolk | Riverhead Rsch Farm | 30.0 | 129.3 |
| Costa | Suffolk | Upton Coop - Nwsfo New York | 24.0 | 122.0 |
| Lagos centrales | Wyoming | Warsaw 6 SW | 555.0 | 79.5 |
| Meseta occidental | Allegany | Wellsville | 460.0 | 67.1 |
| Meseta oriental | Chenango | Greene | 280.0 | 64.3 |
| Grandes Lagos | Wayne | Newark | 131.0 | 64.0 |
| Lagos centrales | Livingston | Hemlock | 275.0 | 60.7 |
| Lagos centrales | Livingston | Mt Morris 2W | 268.0 | 58.9 |
Fuente: NOAA NCEI
Estaciones con mayor déficit de precipitación
| Región | Condado | Estación | Altitud (m) | Anomalía (%) |
|---|---|---|---|---|
| Valle del San Lorenzo | St. Lawrence | Gouverneur 3 NW | 128.0 | −72.1 |
| Grandes Lagos | Oswego | Oswego | 99.0 | −57.9 |
| Valle del Champlain | Essex | Elizabethtown | 186.0 | −53.0 |
| Grandes Lagos | Chautauqua | Dunkirk Chautauqua Co AP | 204.0 | −52.7 |
| Grandes Lagos | Niagara | N Tonawanda | 176.0 | −51.3 |
| Meseta norte | Hamilton | Indian Lake 2SW | 509.0 | −46.8 |
| Grandes Lagos | Oswego | Fulton Oswego Co AP | 144.0 | −46.3 |
| Meseta occidental | Allegany | Angelica | 450.0 | −44.3 |
| Lagos centrales | Yates | Penn Yan AP | 267.0 | −43.6 |
| Grandes Lagos | Niagara | Niagara Falls | 179.0 | −41.5 |
Fuente: NOAA NCEI
Mayores lluvias en 24 horas en estaciones
| Estación | Condado | Lluvia máxima en 24 h (mm) | Fecha |
|---|---|---|---|
| Massena Intl AP | St. Lawrence | 80.5 | 02/09/2026 |
| Pavilion 2 | Genesee | 80.0 | 04/09/2026 |
| Islip-Li Macarthur AP | Suffolk | 77.7 | 13/09/2026 |
| Buffalo | Erie | 77.2 | 03/09/2026 |
| Medina | Orleans | 76.7 | 03/09/2026 |
| Greene | Chenango | 68.3 | 03/09/2026 |
| Riverhead Rsch Farm | Suffolk | 64.0 | 13/09/2026 |
| Baiting Hollow | Suffolk | 58.4 | 28/09/2026 |
| Trenton Falls | Herkimer | 57.7 | 10/09/2026 |
| Warsaw 6 SW | Wyoming | 57.2 | 04/09/2026 |
Fuente: NOAA NCEI
Precipitación diaria promedio estatal
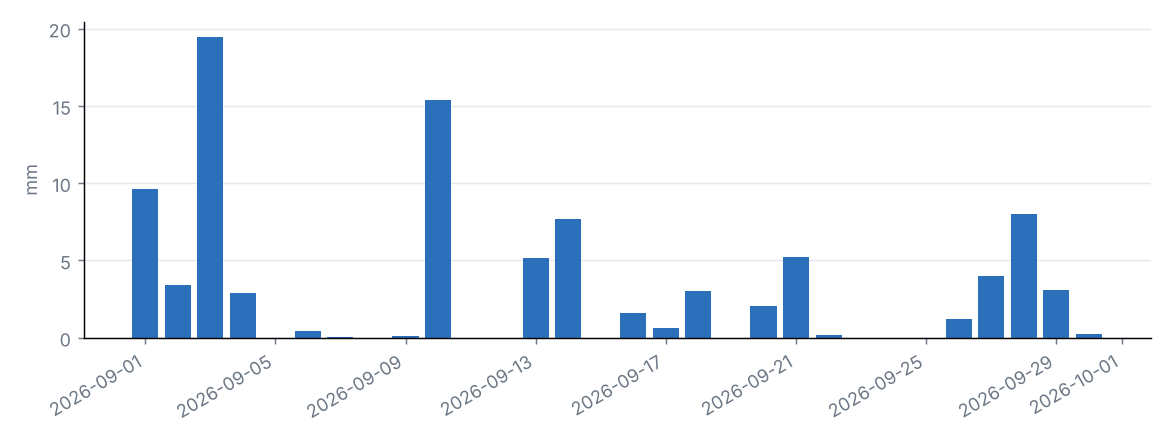
Fuente: NOAA NCEI
Lámina diaria estatal y máximo diario en la malla
| Día | Promedio estatal (mm) | Máximo en la malla (mm) | Condado |
|---|---|---|---|
| 01/09/2026 | 9.6 | 21.7 | Lewis |
| 02/09/2026 | 3.4 | 14.6 | Suffolk |
| 03/09/2026 | 19.5 | 57.5 | Wyoming |
| 04/09/2026 | 2.9 | 15.2 | Chautauqua |
| 05/09/2026 | 0.0 | 1.1 | Chautauqua |
| 06/09/2026 | 0.5 | 3.4 | Essex |
| 07/09/2026 | 0.0 | 1.5 | Rensselaer |
| 08/09/2026 | 0.0 | 0.1 | Ontario |
| 09/09/2026 | 0.1 | 2.1 | St. Lawrence |
| 10/09/2026 | 15.4 | 36.1 | Oneida |
| 11/09/2026 | 0.0 | 1.0 | Columbia |
| 12/09/2026 | 0.0 | 0.3 | Oswego |
| 13/09/2026 | 5.1 | 18.3 | Allegany |
| 14/09/2026 | 7.7 | 38.3 | Suffolk |
| 15/09/2026 | 0.0 | 0.1 | Ontario |
| 16/09/2026 | 1.6 | 9.1 | Chautauqua |
| 17/09/2026 | 0.7 | 9.4 | Chautauqua |
| 18/09/2026 | 3.0 | 10.4 | Chenango |
| 19/09/2026 | 0.0 | 0.1 | Chemung |
| 20/09/2026 | 2.1 | 8.7 | Chenango |
| 21/09/2026 | 5.2 | 18.9 | Ulster |
| 22/09/2026 | 0.2 | 5.5 | Chautauqua |
| 23/09/2026 | 0.0 | 0.8 | Richmond |
| 24/09/2026 | 0.0 | 0.0 | St. Lawrence |
| 25/09/2026 | 0.0 | 0.2 | Schoharie |
| 26/09/2026 | 1.2 | 24.8 | Suffolk |
| 27/09/2026 | 4.0 | 49.0 | Suffolk |
| 28/09/2026 | 8.0 | 48.6 | Suffolk |
| 29/09/2026 | 3.1 | 17.1 | Dutchess |
| 30/09/2026 | 0.2 | 1.5 | Essex |
Fuente: NOAA NCEI
Precipitación estatal en septiembre de cada año
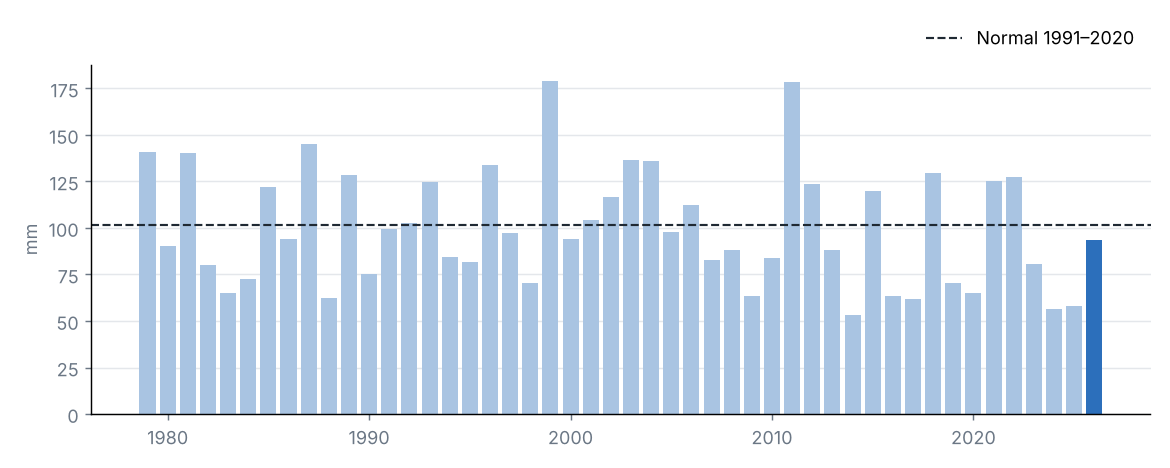
Fuente: NOAA NCEI
La precipitación acumulada en el estado fue de 93.4 mm, el 92 % de su promedio 1991–2020 (101.5 mm), categoría «cercano a lo normal». Fue el 23.º septiembre más seco de la serie 1979–2026.
La región con mayor porcentaje respecto a su normal fue Costa (165 %) y la de menor porcentaje, Valle del Champlain (62 %).
El mayor acumulado diario en la malla se estimó el 3 de septiembre en Wyoming (57.5 mm).
Fuente: NOAA NCEI
4 Temperatura
Fuente: NOAA NCEI
Temperatura media
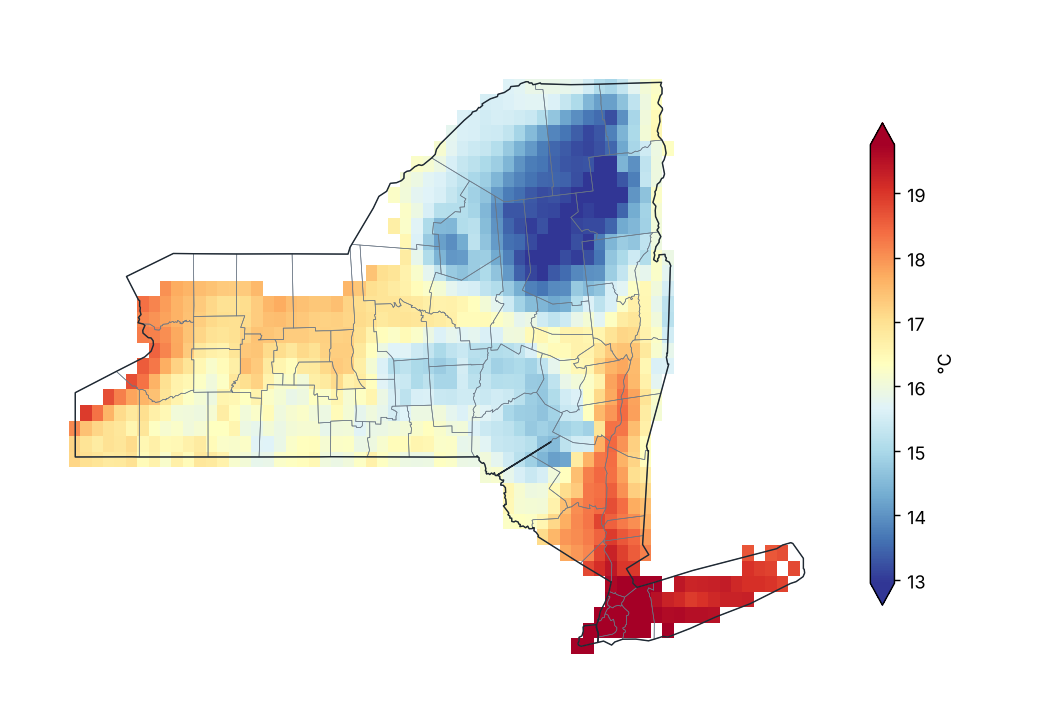
Fuente: NOAA NCEI
Anomalía de temperatura media (1991–2020)
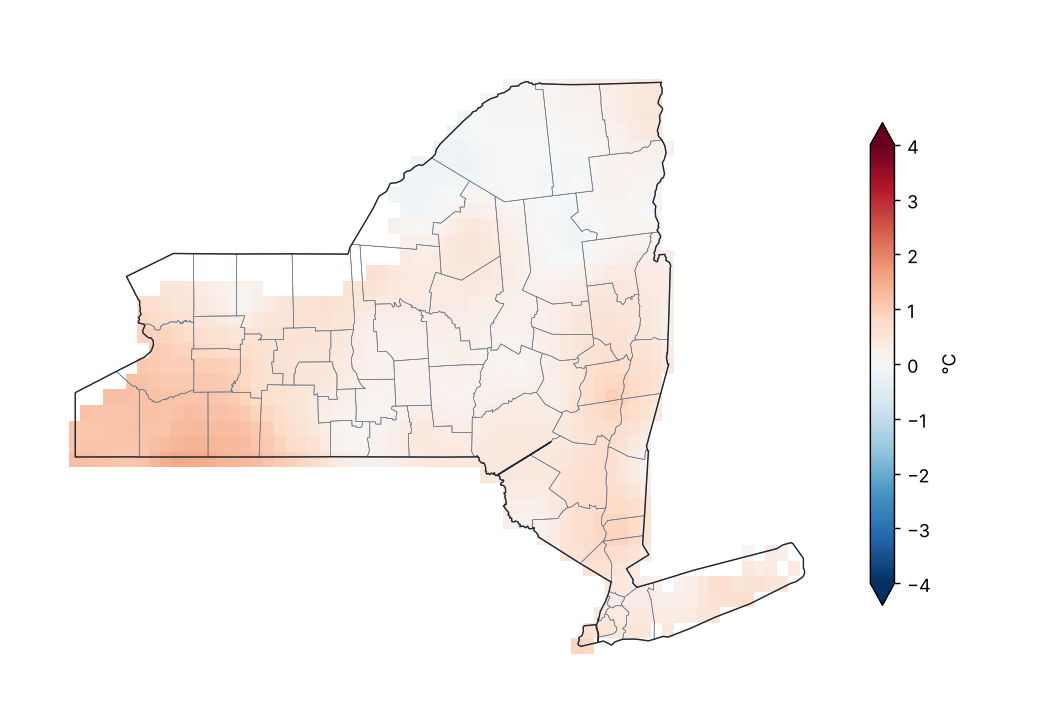
Fuente: NOAA NCEI
Anomalía de temperatura media por región
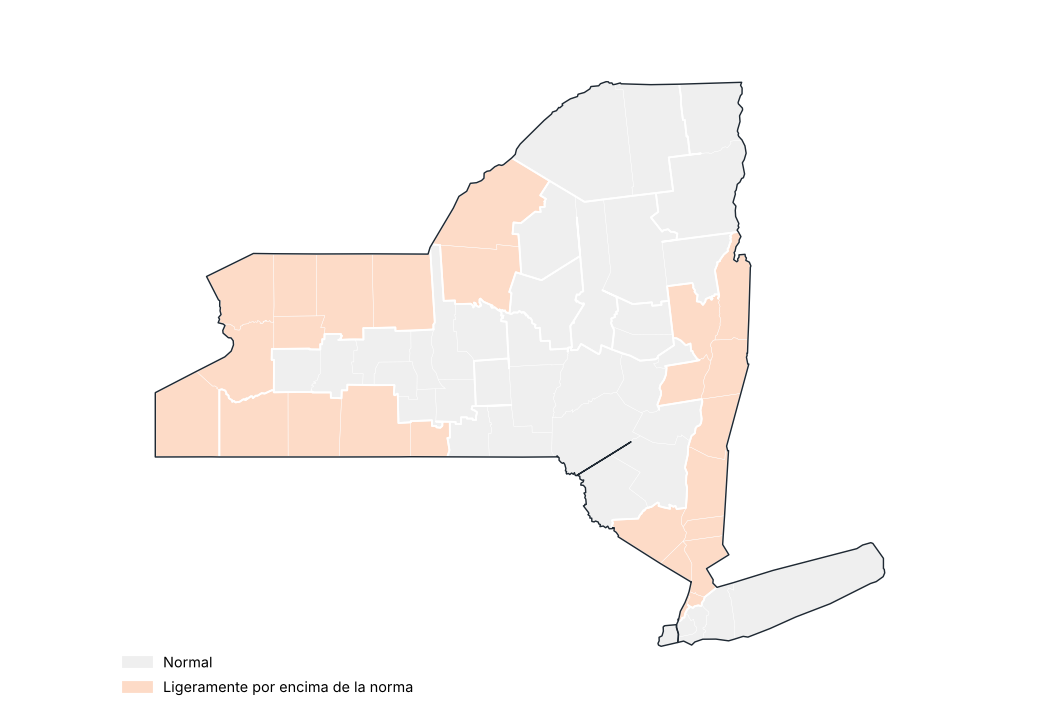
Fuente: NOAA NCEI
Estaciones con mayor anomalía positiva
| Región | Condado | Estación | Altitud (m) | Anomalía (°C) |
|---|---|---|---|---|
| Meseta occidental | Cattaraugus | Little Valley | 495.0 | 1.2 |
| Lagos centrales | Wyoming | Warsaw 6 SW | 555.0 | 1.1 |
| Meseta occidental | Cattaraugus | Allegany Sp | 457.0 | 1.0 |
| Grandes Lagos | Niagara | N Tonawanda | 176.0 | 1.0 |
| Grandes Lagos | Erie | Wales | 343.0 | 0.9 |
| Meseta occidental | Allegany | Angelica | 450.0 | 0.9 |
| Grandes Lagos | Oswego | Oswego | 99.0 | 0.8 |
| Meseta occidental | Cattaraugus | Franklinville | 485.0 | 0.8 |
| Costa | Suffolk | Westhampton Gabreski AP | 13.0 | 0.7 |
| Valle del San Lorenzo | St. Lawrence | Gouverneur 3 NW | 128.0 | 0.7 |
Fuente: NOAA NCEI
Estaciones con mayor anomalía negativa
| Región | Condado | Estación | Altitud (m) | Anomalía (°C) |
|---|---|---|---|---|
| Valle del Hudson | Orange | Port Jervis | 177.0 | −1.4 |
| Valle del San Lorenzo | Franklin | Saranac Lk Adirondack Rgnl AP | 506.0 | −0.8 |
| Meseta occidental | Chemung | Elmira | 289.0 | −0.8 |
| Meseta norte | Hamilton | Indian Lake 2SW | 509.0 | −0.7 |
| Valle del Champlain | Essex | Lake Placid 2 S | 576.0 | −0.6 |
| Meseta oriental | Chenango | Norwich | 301.0 | −0.5 |
| Grandes Lagos | Jefferson | Watertown AP | 95.0 | −0.4 |
| Valle del Hudson | New York | Ny City Cntrl Park | 43.0 | −0.4 |
| Lagos centrales | Tompkins | Ithaca Cornell Univ | 293.0 | −0.3 |
| Lagos centrales | Cayuga | Auburn | 235.0 | −0.3 |
Fuente: NOAA NCEI
Anomalía de la temperatura media estatal en septiembre de cada año
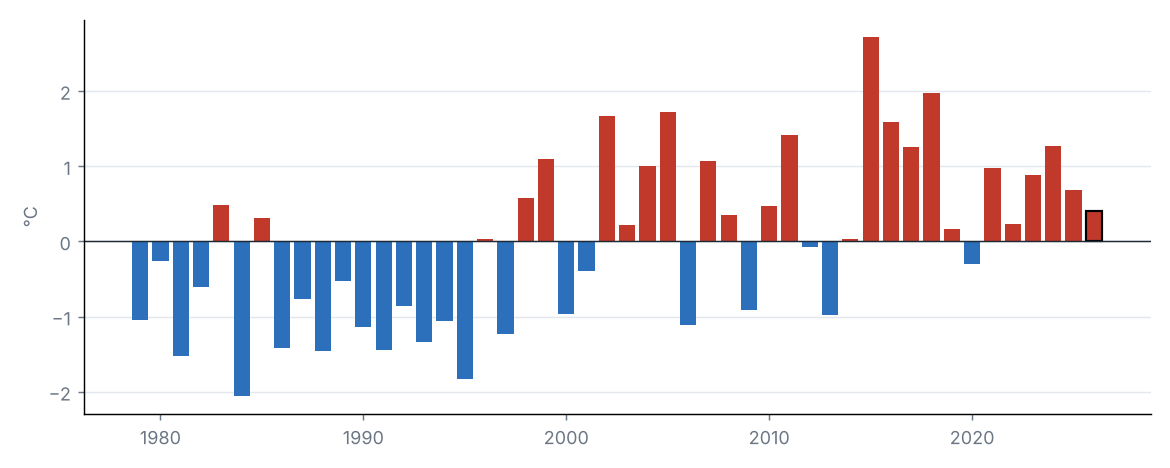
Fuente: NOAA NCEI
La temperatura media estatal fue de 16.1 °C, 0.4 °C por encima del promedio 1991–2020 (15.7 °C), categoría «normal». Fue el 18.º septiembre más cálido de la serie 1979–2026 (empatado con 2008).
Por regiones, la mayor anomalía se registró en Meseta occidental (+0.9 °C) y la menor en Valle del San Lorenzo (+0.0 °C).
Fuente: NOAA NCEI
Fuente: NOAA NCEI
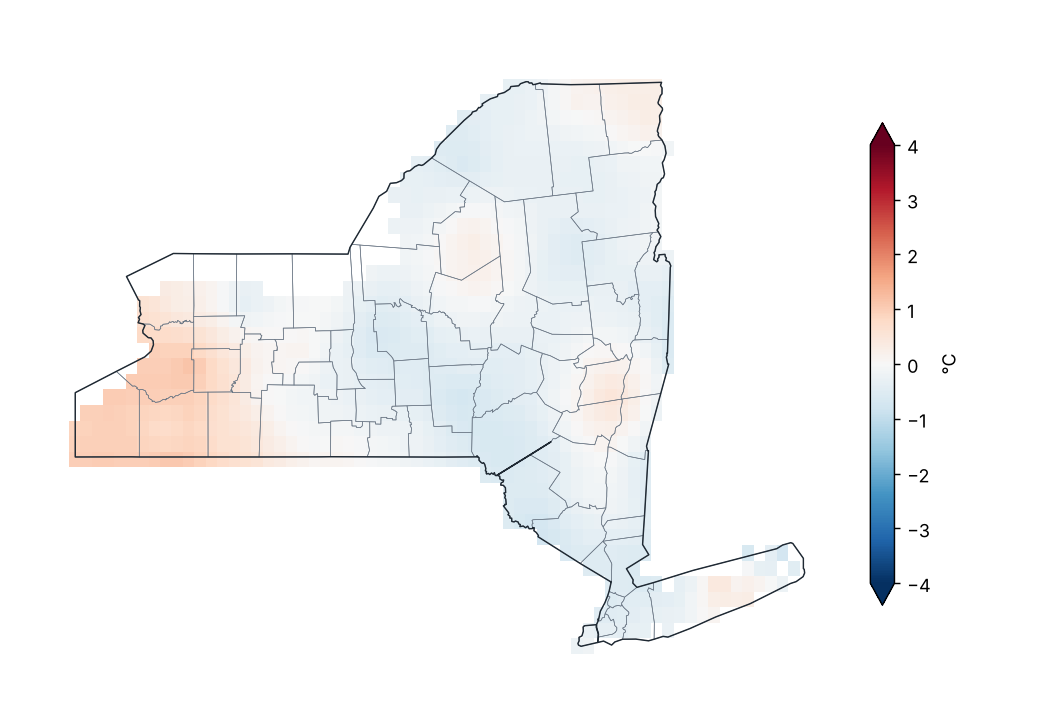
Anomalía de temperatura máxima (1991–2020)
Fuente: NOAA NCEI
Valores extremos de la temperatura máxima media mensual por región
| Región | Valor mínimo (°C) | Estación | Valor máximo (°C) | Estación |
|---|---|---|---|---|
| Meseta occidental | 20.8 | Wellsville Muni AP | 23.0 | Elmira |
| Meseta oriental | 19.9 | Cooperstown | 22.2 | Whitney Pt Dam |
| Meseta norte | 18.4 | Indian Lake 2SW | 21.4 | Lowville |
| Costa | 21.9 | Montauk AP | 24.4 | Laguardia AP |
| Valle del Hudson | 20.6 | Conklingville Dam | 23.6 | Poughkeepsie AP |
| Valle del Mohawk | 18.5 | Gloversville 7NW (Peck Lake) | 22.4 | Rome Griffiss Airfield |
| Valle del Champlain | 18.0 | Lake Placid 2 S | 21.2 | Plattsburgh Intl AP |
| Valle del San Lorenzo | 19.1 | Saranac Lk Adirondack Rgnl AP | 21.2 | Massena Intl AP |
| Grandes Lagos | 21.6 | Watertown AP | 24.1 | Dunkirk |
| Lagos centrales | 19.8 | Wyoming 3W | 23.5 | Dansville Muni AP |
Promedio mensual por estación (GHCN-Daily, ≥ 80 % de días con datos).
Fuente: NOAA NCEI
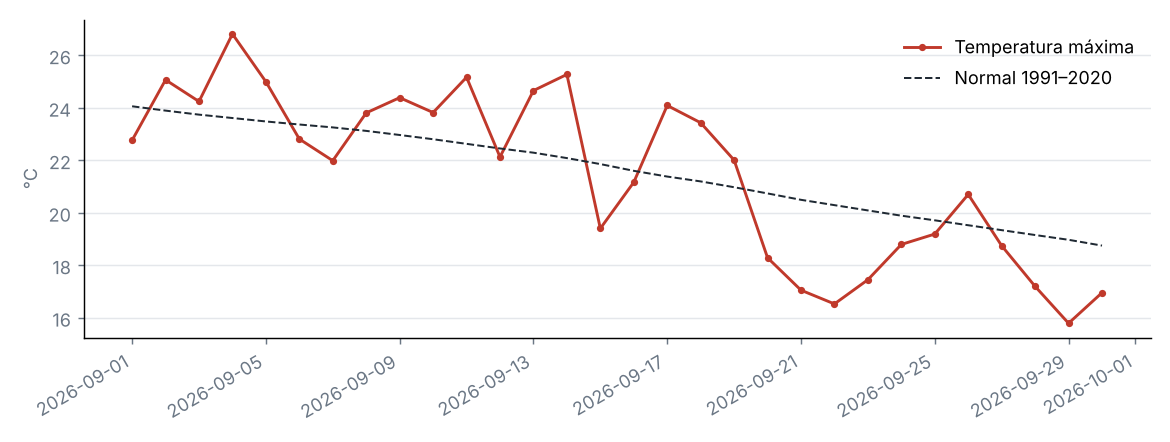
Marcha diaria de la temperatura máxima estatal
Fuente: NOAA NCEI
La temperatura máxima estatal fue de 21.5 °C, 0.1 °C por debajo del promedio 1991–2020 (21.6 °C), categoría «normal». Fue el 22.º septiembre más frío de la serie 1979–2026 (empatado con 2003, 2020).
Por regiones, la mayor anomalía se registró en Meseta occidental (+0.4 °C) y la menor en Meseta oriental (−0.4 °C).
Fuente: NOAA NCEI
Fuente: NOAA NCEI
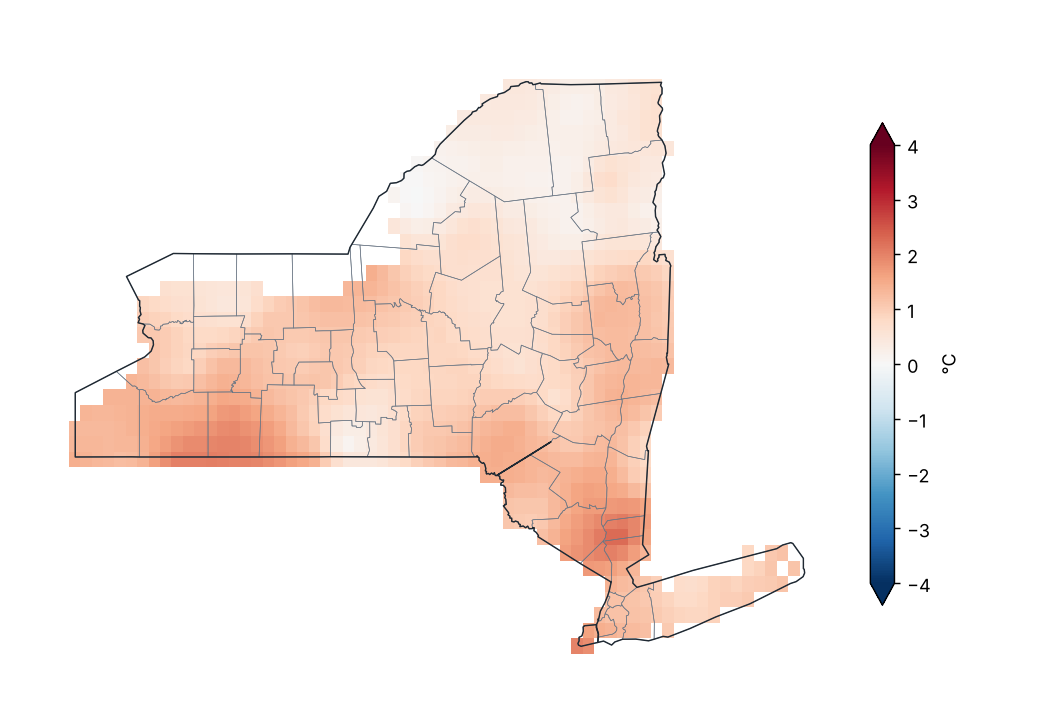
Anomalía de temperatura mínima (1991–2020)
Fuente: NOAA NCEI
Valores extremos de la temperatura mínima media mensual por región
| Región | Valor mínimo (°C) | Estación | Valor máximo (°C) | Estación |
|---|---|---|---|---|
| Meseta occidental | 8.6 | Elmira | 11.3 | Wellsville Muni AP |
| Meseta oriental | 9.5 | Norwich | 12.0 | Binghamton |
| Meseta norte | 7.2 | Indian Lake 2SW | 9.7 | Glens Falls AP |
| Costa | 14.1 | Upton Coop - Nwsfo New York | 18.2 | Laguardia AP |
| Valle del Hudson | 10.8 | Buskirk | 16.9 | Ny City Cntrl Park |
| Valle del Mohawk | 9.1 | Boonville 4 SSW | 12.1 | Rome Griffiss Airfield |
| Valle del Champlain | 7.8 | Newcomb | 11.3 | Plattsburgh Intl AP |
| Valle del San Lorenzo | 5.2 | Saranac Lk Adirondack Rgnl AP | 10.9 | Gouverneur 3 NW |
| Grandes Lagos | 9.0 | Watertown AP | 14.6 | Oswego |
| Lagos centrales | 9.9 | Ithaca Cornell Univ | 12.9 | Freeville 1 NE |
Promedio mensual por estación (GHCN-Daily, ≥ 80 % de días con datos).
Fuente: NOAA NCEI
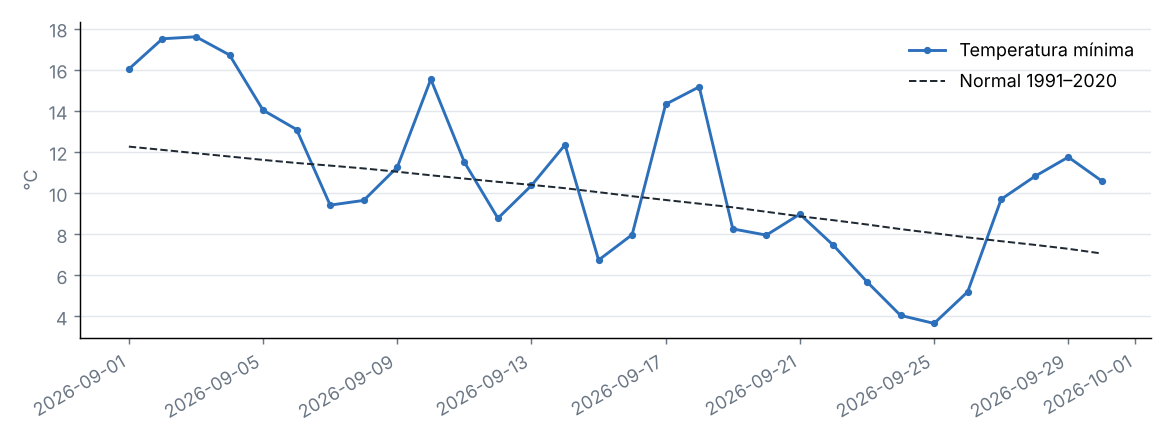
Marcha diaria de la temperatura mínima estatal
Fuente: NOAA NCEI
La temperatura mínima estatal fue de 10.7 °C, 0.9 °C por encima del promedio 1991–2020 (9.8 °C), categoría «ligeramente por encima de la norma». Fue el 13.º septiembre más cálido de la serie 1979–2026 (empatado con 1996, 2010, 2016).
Por regiones, la mayor anomalía se registró en Meseta occidental (+1.4 °C) y la menor en Valle del San Lorenzo (+0.3 °C).
Fuente: NOAA NCEI
5 Extremos climáticos y récords
Fuente: NOAA NCEI
Temperatura máxima más alta por condado
| Condado | Estación | Temperatura (°C) | Fecha |
|---|---|---|---|
| Chautauqua | Dunkirk | 32.2 | 03/09/2026 |
| Queens | Laguardia AP | 31.1 | 03/09/2026 |
| Suffolk | Farmingdale Republic AP | 31.1 | 03/09/2026 |
| Allegany | Alfred | 30.6 | 02/09/2026 |
| Dutchess | Poughkeepsie AP | 30.6 | 10/09/2026 |
| Livingston | Dansville Muni AP | 30.6 | 02/09/2026 |
| Monroe | Brockport | 30.6 | 02/09/2026 |
| Cattaraugus | Little Valley | 30.0 | 02/09/2026 |
| Chemung | Elmira Corning Rgnl AP | 30.0 | 01/09/2026 |
| Westchester | Shrub Oak | 30.0 | 11/09/2026 |
| Niagara | N Tonawanda | 29.4 | 03/09/2026 |
| Onondaga | Syracuse Hancock Intl AP | 29.4 | 02/09/2026 |
| Ontario | Canandaigua 3 S | 29.4 | 03/09/2026 |
| Orange | Montgomery Orange Co AP | 29.4 | 10/09/2026 |
| Erie | Colden 1W | 28.9 | 03/09/2026 |
| Genesee | Batavia | 28.9 | 03/09/2026 |
| New York | Ny City Cntrl Park | 28.9 | 03/09/2026 |
| Orleans | Albion | 28.9 | 02/09/2026 |
| Oswego | Oswego | 28.9 | 02/09/2026 |
| Yates | Penn Yan AP | 28.9 | 02/09/2026 |
Los 20 valores más extremos de 47.
Fuente: NOAA NCEI
Temperatura mínima más baja por condado
| Condado | Estación | Temperatura (°C) | Fecha |
|---|---|---|---|
| Franklin | Saranac Lk Adirondack Rgnl AP | −3.3 | 24/09/2026 |
| Chemung | Elmira | −0.6 | 11/09/2026 |
| Hamilton | Indian Lake 2SW | −0.6 | 25/09/2026 |
| Cattaraugus | Franklinville | 0.0 | 25/09/2026 |
| Delaware | Delhi 2 SE | 0.0 | 25/09/2026 |
| Lewis | Highmarket 2W | 0.0 | 25/09/2026 |
| Allegany | Angelica | 0.6 | 25/09/2026 |
| Chenango | Sherburne | 0.6 | 26/09/2026 |
| Essex | Newcomb | 0.6 | 20/09/2026 |
| Tompkins | Ithaca Cornell Univ | 0.6 | 24/09/2026 |
| Cortland | Ithaca 13 E | 0.9 | 24/09/2026 |
| Dutchess | Millbrook 3 W | 0.9 | 24/09/2026 |
| St. Lawrence | Massena Intl AP | 1.1 | 24/09/2026 |
| Warren | Glens Falls AP | 1.1 | 24/09/2026 |
| Chautauqua | Jamestown 4 ENE | 1.7 | 25/09/2026 |
| Jefferson | Watertown AP | 1.7 | 24/09/2026 |
| Rensselaer | Buskirk | 1.7 | 24/09/2026 |
| Schoharie | Lansing Manor | 1.7 | 24/09/2026 |
| Steuben | Hornell Almond Dam | 1.7 | 26/09/2026 |
| Clinton | Plattsburgh Intl AP | 2.2 | 24/09/2026 |
Los 20 valores más extremos de 48.
Fuente: NOAA NCEI
Índices de extremos climáticos (promedio estatal)
| Índice | Descripción | Valor | Normal | Diferencia | Unidad |
|---|---|---|---|---|---|
| TX90p | Días cálidos (máxima > percentil 90) | 1.9 | 10.0 | −8.1 | % |
| TN90p | Noches cálidas (mínima > percentil 90) | 10.5 | 10.0 | 0.5 | % |
| TX10p | Días frescos (máxima < percentil 10) | 1.6 | 10.0 | −8.4 | % |
| TN10p | Noches frías (mínima < percentil 10) | 1.2 | 10.0 | −8.8 | % |
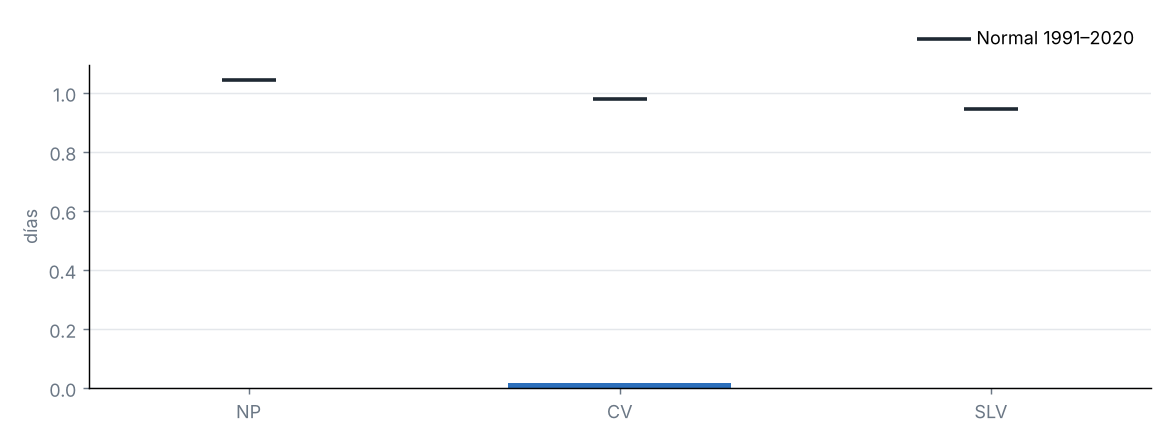
| FD | Días con helada (mínima < 0 °C) | 0.0 | 0.4 | −0.4 | d |
| SU | Días de verano (máxima > 25 °C) | 5.6 | 7.4 | −1.8 | d |
| TR | Noches tropicales (mínima > 20 °C) | 0.3 | 0.3 | 0.0 | d |
| WSDI | Días en rachas cálidas (≥ 6 días) | 0.0 | — | — | d |
| CSDI | Días en rachas frías (≥ 6 días) | 0.0 | — | — | d |
| Rx1day | Lluvia máxima en 1 día | 26.4 | 32.2 | −5.9 | mm |
| Rx5day | Lluvia máxima en 5 días | 43.6 | 49.8 | −6.2 | mm |
| CDD | Días secos consecutivos (< 1 mm) | 6.4 | 7.8 | −1.4 | d |
| CWD | Días húmedos consecutivos (≥ 1 mm) | 3.3 | 3.6 | −0.3 | d |
Índices de percentil respecto a los percentiles diarios de 1991–2020 (ventana de 5 días); conteos y máximos promediados sobre las celdas del estado.
Fuente: NOAA NCEI
Días con helada por región
Fuente: NOAA NCEI
6 Sequía
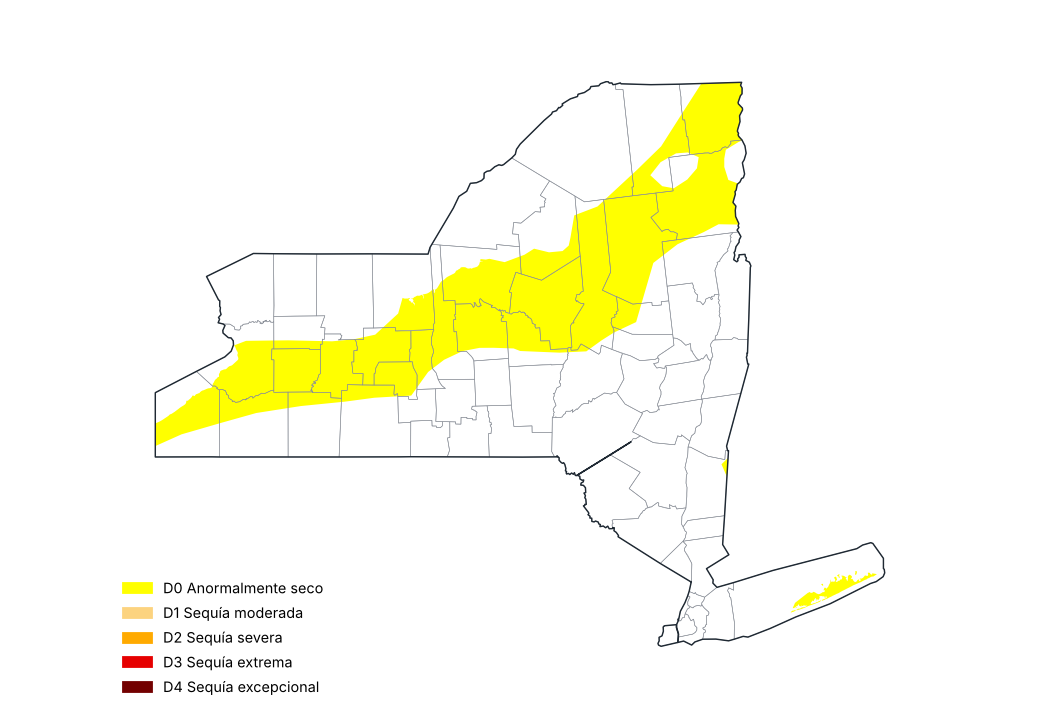
Monitor de Sequía de EE. UU., 29 de septiembre de 2026
Fuente: National Drought Mitigation Center, USDA, NOAA
Proporción del estado por categoría de sequía, mapas semanales del Monitor de Sequía de EE. UU. (%)
| Mapa del | Sin sequía (%) | D0–D4 (%) | D1–D4 (%) | D2–D4 (%) | D3–D4 (%) | D4 (%) |
|---|---|---|---|---|---|---|
| 01/09/2026 | 76.6 | 23.4 | 0.1 | 0.0 | 0.0 | 0.0 |
| 08/09/2026 | 77.7 | 22.3 | 0.1 | 0.0 | 0.0 | 0.0 |
| 15/09/2026 | 81.2 | 18.8 | 0.1 | 0.0 | 0.0 | 0.0 |
| 22/09/2026 | 82.0 | 18.0 | 0.0 | 0.0 | 0.0 | 0.0 |
| 29/09/2026 | 67.6 | 32.4 | 0.0 | 0.0 | 0.0 | 0.0 |
Proporciones acumuladas: D1–D4 es la proporción con sequía moderada o peor.
Fuente: National Drought Mitigation Center, USDA, NOAA
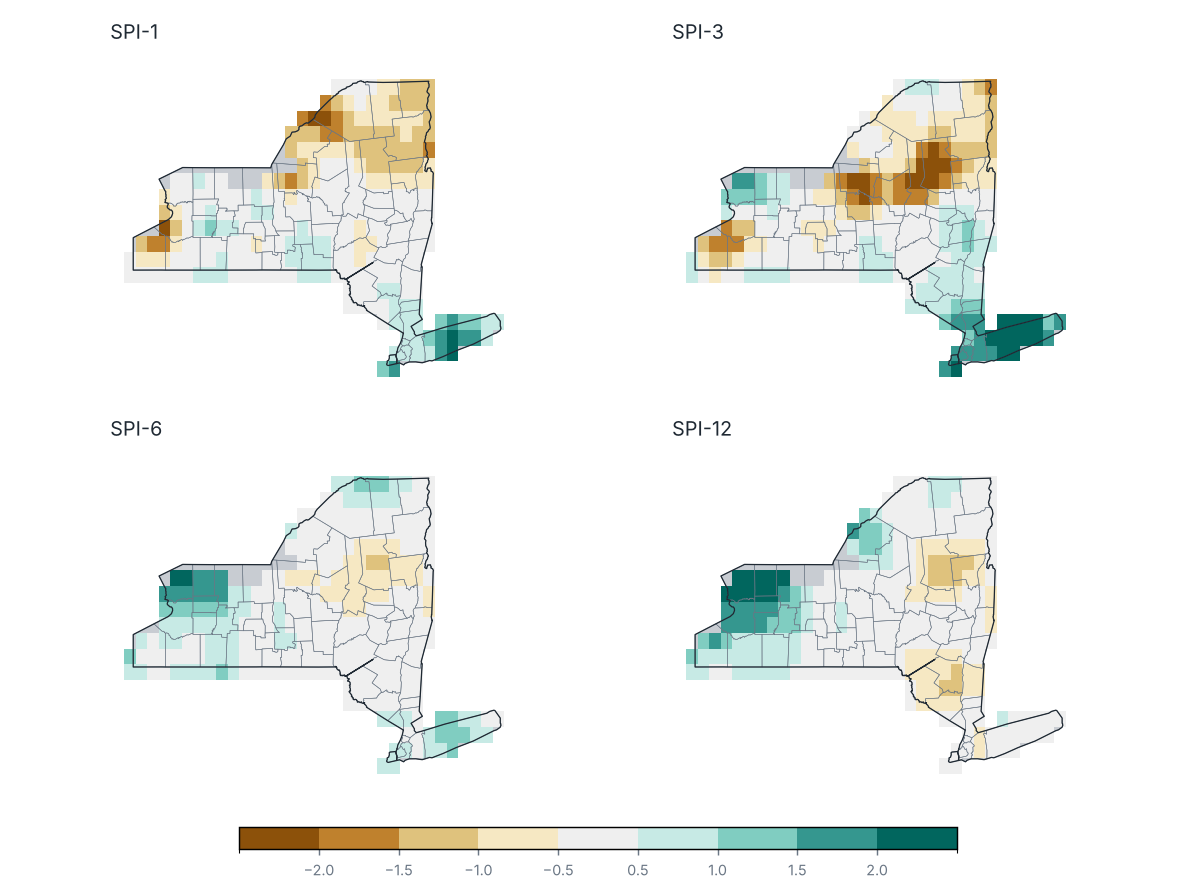
Índice Estandarizado de Precipitación (SPI) al cierre de septiembre 2026
Fuente: NOAA NCEI
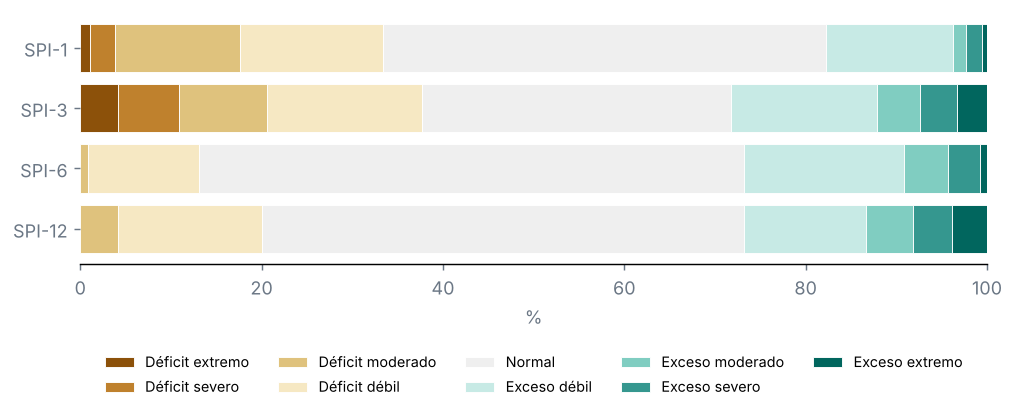
Porcentaje del territorio por categoría de SPI
Fuente: NOAA NCEI
Condados con el SPI-3 más bajo
| Condado | SPI-1 | SPI-3 | SPI-6 | SPI-12 | Categoría |
|---|---|---|---|---|---|
| Hamilton | −1.0 | −2.1 | −0.9 | −1.0 | Déficit extremo |
| Oswego | −1.0 | −1.7 | −0.4 | 0.3 | Déficit severo |
| Herkimer | −0.4 | −1.5 | −0.7 | −0.4 | Déficit severo |
| Oneida | −0.1 | −1.5 | −0.6 | −0.1 | Déficit moderado |
| Onondaga | −0.1 | −1.4 | −0.1 | 0.3 | Déficit moderado |
| Chautauqua | −0.9 | −1.1 | 0.4 | 1.1 | Déficit moderado |
| Warren | −1.0 | −1.0 | −0.7 | −0.9 | Déficit moderado |
| Essex | −1.2 | −1.0 | −0.2 | −0.3 | Déficit moderado |
| Clinton | −1.1 | −0.9 | 0.3 | 0.0 | Déficit débil |
| Yates | −0.2 | −0.8 | 0.2 | 0.2 | Déficit débil |
Fuente: NOAA NCEI
Monitor de Sequía de EE. UU., mapa del 29 de septiembre de 2026: el 0 % del estado con sequía (D1–D4), el 0 % con sequía severa o peor (D2–D4) y el 0 % con sequía extrema o excepcional (D3–D4); el 32 % estaba anormalmente seco o con sequía (D0–D4).
En el mapa del 25 de agosto de 2026, el 0 % del estado estaba con sequía: un cambio de −0 puntos en el periodo.
Ninguna parte del estado estaba con sequía (D1–D4).
SPI-3 (Jul–Sep 2026): promedio estatal de −0.12; el 21 % del estado con sequía (SPI ≤ −1.0) y el 11 % con sequía severa o extrema.
Condados más afectados: Hamilton (−2.06), Oswego (−1.71) y Herkimer (−1.52).
SPI-1 (septiembre 2026): el 18 % del estado con sequía.
SPI-6 (Abr–Sep 2026): el 1 % del estado con sequía.
SPI-12 (Oct 2025–Sep 2026): el 4 % del estado con sequía.
7 Eventos notables y tiempo severo
Ningún ciclón tropical se acercó a menos de 300 km del estado.
9 Perspectivas
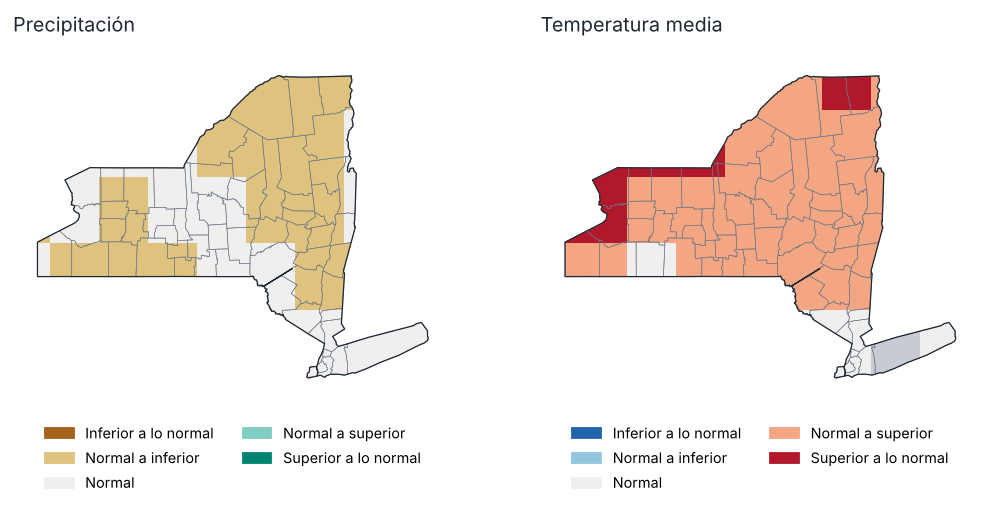
Perspectiva para octubre 2026: tercil más probable
Fuente: NOAA CPC
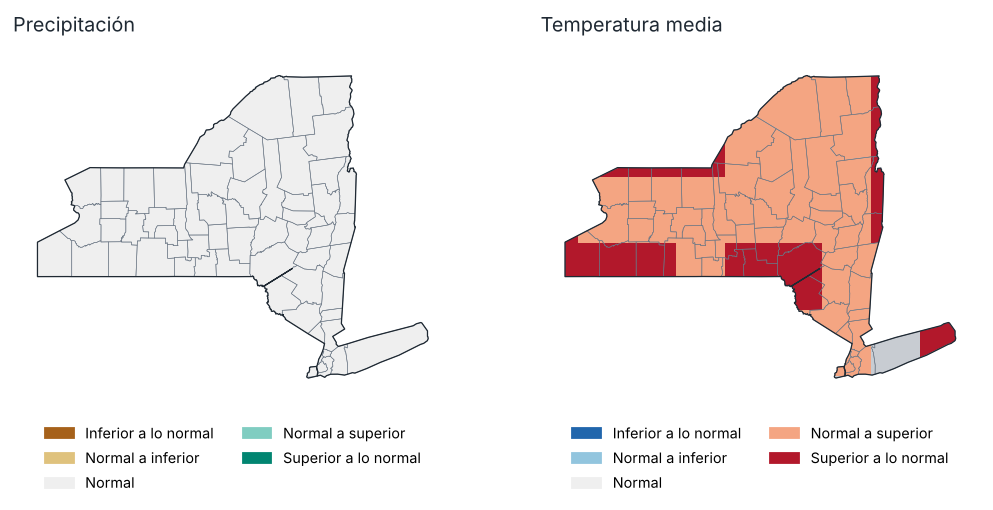
Perspectiva para Oct–Dic 2026: tercil más probable
Fuente: NOAA CPC
Probabilidad de cada tercil por región, Oct–Dic 2026 (%)
| Región | Precipitación: inferior | Precipitación: normal | Precipitación: superior | Temp.: inferior | Temp.: normal | Temp.: superior |
|---|---|---|---|---|---|---|
| Meseta occidental | 34.0 | 31.0 | 35.0 | 16.0 | 34.0 | 51.0 |
| Meseta oriental | 33.0 | 33.0 | 35.0 | 23.0 | 29.0 | 49.0 |
| Meseta norte | 32.0 | 34.0 | 34.0 | 24.0 | 29.0 | 47.0 |
| Costa | 33.0 | 33.0 | 34.0 | 22.0 | 27.0 | 51.0 |
| Valle del Hudson | 33.0 | 32.0 | 34.0 | 22.0 | 29.0 | 49.0 |
| Valle del Mohawk | 33.0 | 33.0 | 34.0 | 25.0 | 29.0 | 46.0 |
| Valle del Champlain | 32.0 | 33.0 | 34.0 | 22.0 | 28.0 | 50.0 |
| Valle del San Lorenzo | 32.0 | 33.0 | 34.0 | 23.0 | 28.0 | 48.0 |
| Grandes Lagos | 34.0 | 33.0 | 34.0 | 20.0 | 30.0 | 49.0 |
| Lagos centrales | 33.0 | 33.0 | 34.0 | 22.0 | 30.0 | 48.0 |
Fuente: NOAA CPC
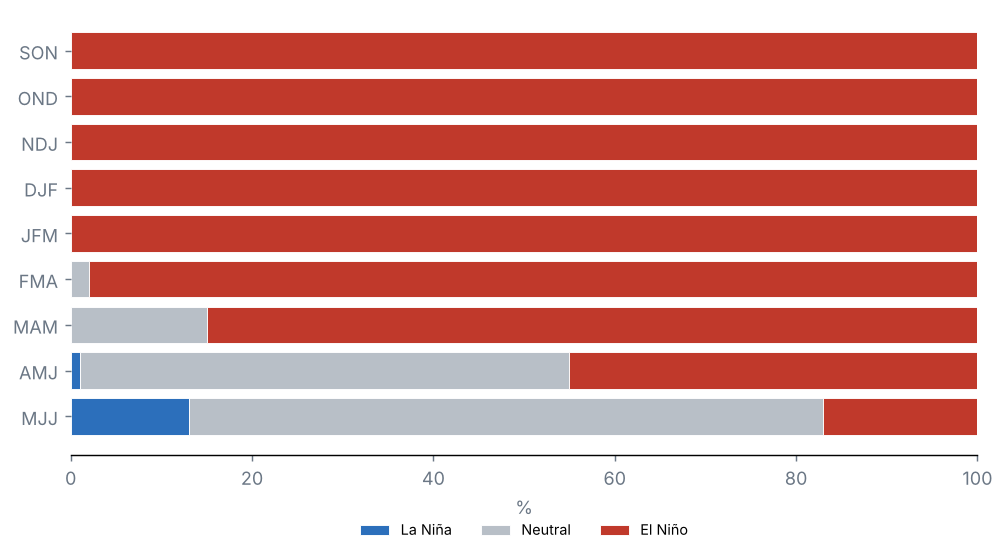
Pronóstico de ENOS: probabilidad de cada fase (%)
Fuente: NOAA CPC
Perspectiva probabilística del conjunto multimodelo norteamericano (NMME), inicializada en octubre 2026, respecto a los terciles de 1991–2020. No es un pronóstico oficial: consulte al National Weather Service y al Climate Prediction Center de la NOAA.
Precipitación, octubre 2026: se favorece un valor superior a lo normal en el 0 % del estado e inferior a lo normal en el 60 %.
Temperatura media, octubre 2026: se favorece un valor superior a lo normal en el 90 % del estado e inferior a lo normal en el 0 %.
Precipitación, Oct–Dic 2026: se favorece un valor superior a lo normal en el 0 % del estado e inferior a lo normal en el 0 %.
Temperatura media, Oct–Dic 2026: se favorece un valor superior a lo normal en el 100 % del estado e inferior a lo normal en el 0 %.
Probabilidad de El Niño según el pronóstico oficial de ENOS: SON 100 %, OND 100 %, NDJ 100 % y DJF 100 %.
10 Anexos
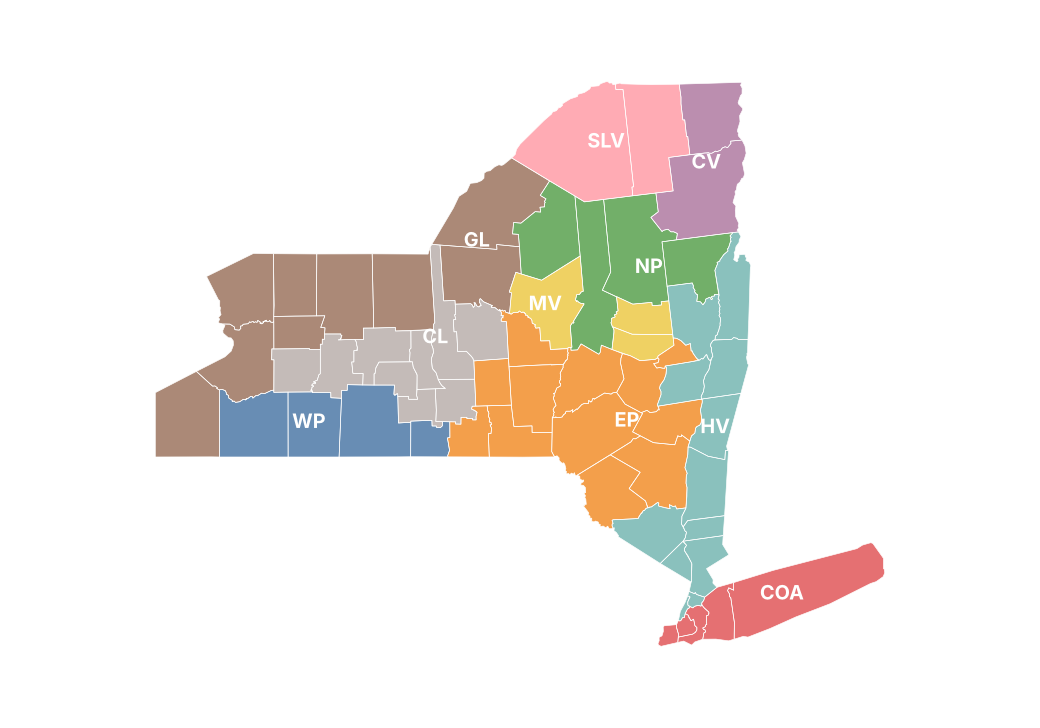
Regiones climáticas del reporte
Precipitación mensual por condado (mm)
| Condado | Ene | Feb | Mar | Abr | May | Jun | Jul | Ago | Sep |
|---|---|---|---|---|---|---|---|---|---|
| Albany | 53.3 | 27.5 | 88.0 | 70.0 | 66.3 | 87.7 | 233.0 | 66.7 | 85.8 |
| Allegany | 57.0 | 32.9 | 124.2 | 175.0 | 99.1 | 90.9 | 127.5 | 65.1 | 105.8 |
| Bronx | 57.4 | 54.3 | 93.8 | 61.2 | 76.8 | 72.2 | 146.7 | 191.5 | 133.0 |
| Broome | 63.1 | 37.4 | 135.1 | 118.4 | 78.2 | 85.9 | 140.2 | 92.8 | 144.5 |
| Cattaraugus | 71.8 | 35.8 | 136.4 | 178.2 | 110.7 | 105.9 | 94.2 | 90.0 | 95.3 |
| Cayuga | 77.9 | 47.5 | 124.2 | 154.7 | 107.4 | 84.6 | 117.1 | 40.8 | 98.3 |
| Chautauqua | 90.0 | 36.2 | 131.9 | 164.2 | 118.0 | 123.4 | 54.9 | 109.6 | 75.5 |
| Chemung | 41.6 | 25.5 | 109.7 | 128.8 | 85.4 | 72.6 | 101.9 | 77.8 | 100.4 |
| Chenango | 69.5 | 39.8 | 120.6 | 128.6 | 80.2 | 73.5 | 136.7 | 93.2 | 123.8 |
| Clinton | 50.8 | 27.5 | 60.1 | 78.8 | 116.4 | 154.6 | 82.7 | 99.8 | 53.0 |
| Columbia | 57.5 | 28.2 | 87.4 | 76.7 | 62.2 | 67.5 | 233.8 | 72.1 | 95.6 |
| Cortland | 71.1 | 47.5 | 116.3 | 147.4 | 85.6 | 78.5 | 144.9 | 69.5 | 127.9 |
| Delaware | 61.8 | 35.6 | 100.1 | 107.1 | 83.4 | 86.8 | 175.8 | 88.7 | 92.2 |
| Dutchess | 44.2 | 29.9 | 95.9 | 68.2 | 58.2 | 45.7 | 183.1 | 93.0 | 119.9 |
| Erie | 104.9 | 38.0 | 135.5 | 177.1 | 112.7 | 116.9 | 63.2 | 108.6 | 76.2 |
| Essex | 72.7 | 43.3 | 79.0 | 92.2 | 122.9 | 120.3 | 99.1 | 100.4 | 59.1 |
| Franklin | 63.0 | 38.5 | 76.8 | 99.0 | 105.8 | 159.9 | 116.1 | 109.7 | 73.6 |
| Fulton | 79.7 | 40.9 | 115.6 | 81.6 | 94.4 | 108.2 | 138.5 | 75.6 | 87.5 |
| Genesee | 83.4 | 36.8 | 117.8 | 154.2 | 108.1 | 117.3 | 101.9 | 101.4 | 98.1 |
| Greene | 53.0 | 33.8 | 89.5 | 89.1 | 66.1 | 76.0 | 232.8 | 83.8 | 88.0 |
| Hamilton | 90.4 | 46.3 | 103.5 | 108.2 | 125.8 | 89.2 | 87.6 | 74.8 | 71.5 |
| Herkimer | 99.9 | 42.7 | 130.1 | 126.5 | 110.4 | 82.5 | 84.5 | 82.2 | 93.5 |
| Jefferson | 129.0 | 45.5 | 123.1 | 133.3 | 83.4 | 95.2 | 87.2 | 107.9 | 60.6 |
| Kings | 60.9 | 62.7 | 91.6 | 62.4 | 78.2 | 65.7 | 139.6 | 214.2 | 133.1 |
| Lewis | 133.0 | 44.7 | 130.9 | 145.3 | 102.2 | 82.9 | 88.7 | 98.9 | 80.6 |
| Livingston | 59.1 | 34.1 | 104.9 | 157.5 | 102.0 | 93.7 | 103.8 | 69.0 | 97.2 |
| Madison | 74.9 | 46.2 | 110.1 | 137.4 | 94.1 | 83.2 | 111.6 | 73.4 | 95.6 |
| Monroe | 80.3 | 42.5 | 121.1 | 138.6 | 103.1 | 104.6 | 119.0 | 72.2 | 73.3 |
| Montgomery | 58.6 | 33.8 | 109.0 | 71.1 | 76.9 | 98.3 | 168.3 | 82.1 | 79.6 |
| Nassau | 51.7 | 47.4 | 90.9 | 54.2 | 80.0 | 48.4 | 165.4 | 165.8 | 127.2 |
| New York | 59.2 | 58.4 | 94.4 | 62.9 | 76.2 | 73.1 | 142.9 | 212.0 | 133.3 |
| Niagara | 78.2 | 33.2 | 116.5 | 163.7 | 105.1 | 106.8 | 103.2 | 141.6 | 83.8 |
| Oneida | 98.8 | 45.0 | 132.0 | 138.6 | 105.7 | 78.8 | 72.6 | 70.6 | 98.8 |
| Onondaga | 83.3 | 48.2 | 132.3 | 144.3 | 110.0 | 89.0 | 89.5 | 43.9 | 92.4 |
| Ontario | 57.7 | 43.6 | 108.4 | 144.2 | 103.0 | 84.4 | 103.2 | 46.7 | 93.9 |
| Orange | 42.1 | 23.3 | 111.6 | 66.4 | 66.4 | 48.2 | 190.1 | 139.0 | 130.5 |
| Orleans | 78.9 | 37.8 | 118.0 | 151.8 | 113.0 | 120.6 | 110.3 | 109.4 | 91.8 |
| Oswego | 122.0 | 48.4 | 152.5 | 129.9 | 106.1 | 90.2 | 70.5 | 56.8 | 71.2 |
| Otsego | 63.7 | 39.0 | 124.5 | 99.5 | 86.2 | 83.6 | 145.7 | 104.3 | 85.3 |
| Putnam | 52.0 | 37.7 | 110.9 | 57.2 | 57.5 | 58.2 | 220.5 | 127.4 | 140.0 |
| Queens | 59.6 | 61.4 | 90.7 | 61.2 | 81.4 | 60.7 | 140.3 | 197.9 | 128.0 |
| Rensselaer | 52.2 | 21.8 | 100.0 | 70.4 | 71.4 | 81.7 | 213.9 | 60.9 | 94.7 |
| Richmond | 60.4 | 55.8 | 88.7 | 61.8 | 75.9 | 62.6 | 149.4 | 223.8 | 151.2 |
| Rockland | 55.1 | 35.4 | 110.7 | 60.1 | 68.3 | 76.4 | 210.4 | 176.7 | 145.4 |
| St. Lawrence | 79.9 | 36.0 | 84.5 | 114.2 | 82.6 | 116.4 | 107.1 | 98.8 | 68.2 |
| Saratoga | 66.2 | 31.5 | 99.9 | 66.6 | 81.6 | 109.2 | 175.8 | 61.5 | 82.9 |
| Schenectady | 55.9 | 28.0 | 93.4 | 64.3 | 69.3 | 101.0 | 218.3 | 62.3 | 87.3 |
| Schoharie | 45.7 | 33.9 | 98.8 | 82.0 | 68.6 | 92.7 | 183.3 | 87.0 | 76.1 |
| Schuyler | 39.8 | 30.9 | 104.7 | 129.4 | 93.4 | 77.9 | 100.0 | 66.9 | 84.3 |
| Seneca | 54.7 | 40.8 | 104.5 | 123.3 | 105.0 | 88.2 | 110.9 | 38.1 | 95.3 |
| Steuben | 44.0 | 30.9 | 104.8 | 151.2 | 92.7 | 79.3 | 113.8 | 62.5 | 95.0 |
| Suffolk | 59.0 | 45.3 | 99.7 | 48.0 | 80.8 | 34.5 | 179.5 | 151.8 | 178.8 |
| Sullivan | 65.2 | 27.3 | 113.4 | 108.4 | 88.7 | 56.0 | 208.6 | 108.3 | 110.2 |
| Tioga | 56.2 | 36.9 | 125.9 | 122.7 | 79.9 | 79.5 | 132.7 | 76.8 | 127.7 |
| Tompkins | 53.6 | 39.4 | 106.0 | 153.2 | 87.2 | 78.2 | 147.0 | 52.8 | 118.7 |
| Ulster | 49.5 | 31.8 | 99.1 | 90.0 | 76.1 | 42.5 | 190.9 | 109.8 | 131.1 |
| Warren | 66.1 | 37.1 | 90.3 | 77.6 | 107.0 | 95.1 | 110.7 | 72.0 | 62.3 |
| Washington | 52.6 | 27.4 | 83.8 | 70.5 | 88.2 | 103.2 | 132.3 | 62.1 | 70.2 |
| Wayne | — | — | — | — | — | — | — | — | — |
| Westchester | 54.5 | 38.8 | 103.7 | 55.3 | 66.8 | 68.4 | 211.0 | 150.9 | 144.4 |
| Wyoming | 88.6 | 40.6 | 116.7 | 158.6 | 111.3 | 110.4 | 78.9 | 88.8 | 118.6 |
| Yates | 45.7 | 38.2 | 108.1 | 113.7 | 108.8 | 89.2 | 91.6 | 48.7 | 77.3 |
Fuente: NOAA NCEI
Temperatura máxima mensual por región (°C)
| Región | Ene | Feb | Mar | Abr | May | Jun | Jul | Ago | Sep |
|---|---|---|---|---|---|---|---|---|---|
| Meseta occidental | −3.0 | −0.3 | 9.5 | 17.0 | 18.3 | 24.8 | 27.4 | 25.3 | 22.1 |
| Meseta oriental | −2.9 | −1.5 | 8.2 | 15.8 | 18.4 | 25.0 | 26.8 | 25.4 | 21.2 |
| Meseta norte | −4.7 | −3.0 | 5.3 | 13.5 | 16.7 | 23.4 | 25.9 | 24.5 | 19.9 |
| Costa | 2.4 | 2.2 | 10.9 | 16.3 | 20.1 | 26.8 | 28.2 | 27.9 | 23.7 |
| Valle del Hudson | −0.9 | 0.3 | 9.7 | 16.9 | 20.3 | 26.8 | 28.2 | 27.4 | 22.5 |
| Valle del Mohawk | −3.4 | −2.0 | 7.3 | 15.4 | 18.4 | 25.2 | 27.3 | 26.0 | 21.6 |
| Valle del Champlain | −5.3 | −3.0 | 5.1 | 13.1 | 16.8 | 23.9 | 26.3 | 24.4 | 19.8 |
| Valle del San Lorenzo | −5.3 | −3.2 | 5.6 | 13.4 | 17.2 | 24.2 | 26.4 | 24.8 | 20.3 |
| Grandes Lagos | −3.0 | −1.1 | 8.3 | 15.6 | 17.9 | 24.1 | 27.0 | 25.5 | 22.2 |
| Lagos centrales | −2.6 | −0.8 | 8.8 | 16.0 | 18.2 | 24.5 | 27.2 | 25.4 | 21.8 |
Fuente: NOAA NCEI
Temperatura media mensual por región (°C)
| Región | Ene | Feb | Mar | Abr | May | Jun | Jul | Ago | Sep |
|---|---|---|---|---|---|---|---|---|---|
| Meseta occidental | −7.0 | −5.3 | 3.1 | 10.1 | 11.7 | 18.2 | 21.1 | 19.2 | 16.3 |
| Meseta oriental | −7.1 | −6.5 | 2.3 | 8.9 | 11.9 | 18.0 | 20.6 | 19.3 | 15.8 |
| Meseta norte | −9.3 | −8.9 | −0.7 | 6.8 | 10.6 | 16.8 | 19.4 | 18.4 | 14.2 |
| Costa | −1.6 | −1.9 | 6.0 | 10.8 | 15.3 | 21.4 | 23.6 | 23.6 | 19.6 |
| Valle del Hudson | −5.5 | −5.3 | 3.8 | 10.1 | 14.1 | 20.0 | 22.2 | 21.5 | 17.4 |
| Valle del Mohawk | −7.8 | −7.2 | 1.3 | 8.5 | 12.0 | 18.3 | 20.9 | 19.8 | 15.9 |
| Valle del Champlain | −9.6 | −9.2 | −0.7 | 6.5 | 11.0 | 17.6 | 20.0 | 18.6 | 14.3 |
| Valle del San Lorenzo | −10.0 | −9.0 | −0.4 | 6.9 | 11.4 | 18.0 | 20.3 | 19.0 | 14.5 |
| Grandes Lagos | −6.7 | −5.7 | 2.6 | 9.4 | 12.2 | 18.6 | 21.7 | 20.5 | 17.0 |
| Lagos centrales | −6.2 | −5.2 | 3.0 | 9.5 | 12.3 | 18.6 | 21.6 | 19.9 | 16.6 |
Fuente: NOAA NCEI
Temperatura mínima mensual por región (°C)
| Región | Ene | Feb | Mar | Abr | May | Jun | Jul | Ago | Sep |
|---|---|---|---|---|---|---|---|---|---|
| Meseta occidental | −11.0 | −10.3 | −3.2 | 3.2 | 5.1 | 11.6 | 14.7 | 13.1 | 10.4 |
| Meseta oriental | −11.3 | −11.6 | −3.6 | 2.1 | 5.5 | 11.1 | 14.3 | 13.2 | 10.4 |
| Meseta norte | −13.9 | −14.7 | −6.7 | 0.0 | 4.4 | 10.2 | 13.0 | 12.2 | 8.4 |
| Costa | −5.6 | −6.0 | 1.1 | 5.3 | 10.6 | 15.9 | 18.9 | 19.3 | 15.5 |
| Valle del Hudson | −10.2 | −10.8 | −2.2 | 3.4 | 7.8 | 13.3 | 16.2 | 15.5 | 12.2 |
| Valle del Mohawk | −12.2 | −12.4 | −4.7 | 1.6 | 5.6 | 11.4 | 14.5 | 13.6 | 10.2 |
| Valle del Champlain | −14.0 | −15.4 | −6.6 | −0.2 | 5.1 | 11.2 | 13.8 | 12.8 | 8.7 |
| Valle del San Lorenzo | −14.6 | −14.7 | −6.4 | 0.4 | 5.6 | 11.7 | 14.2 | 13.2 | 8.7 |
| Grandes Lagos | −10.4 | −10.4 | −3.0 | 3.2 | 6.6 | 13.0 | 16.3 | 15.4 | 11.8 |
| Lagos centrales | −9.7 | −9.5 | −2.9 | 2.9 | 6.4 | 12.7 | 15.9 | 14.4 | 11.4 |
Fuente: NOAA NCEI
Estaciones utilizadas
| Clave | Nombre | Condado | Latitud | Longitud | Altitud (m) | Días con datos (Tmáx) (%) |
|---|---|---|---|---|---|---|
| USC00300055 | Albion | Orleans | 43.2 | −78.2 | 183.8 | 100.0 |
| USC00300063 | Alcove Dam | Albany | 42.5 | −73.9 | 191.4 | 77.0 |
| USC00300085 | Alfred | Allegany | 42.3 | −77.8 | 586.4 | 37.0 |
| USC00300093 | Allegany Sp | Cattaraugus | 42.1 | −78.7 | 457.2 | 93.0 |
| USC00300183 | Angelica | Allegany | 42.3 | −78.0 | 449.6 | 87.0 |
| USC00300220 | Arcade | Wyoming | 42.5 | −78.5 | 434.9 | 0.0 |
| USC00300321 | Auburn | Cayuga | 42.9 | −76.5 | 234.7 | 100.0 |
| USC00300343 | Avon | Livingston | 42.9 | −77.8 | 166.1 | 100.0 |
| USC00300364 | Baiting Hollow | Suffolk | 40.9 | −72.7 | 21.3 | 63.0 |
| USC00300443 | Batavia | Genesee | 43.0 | −78.2 | 278.3 | 67.0 |
| USC00300608 | Bennetts Brg | Oswego | 43.5 | −76.0 | 201.2 | 0.0 |
| USC00300785 | Boonville 4 SSW | Oneida | 43.4 | −75.4 | 472.4 | 100.0 |
| USC00300870 | Brewerton Lock 23 | Onondaga | 43.2 | −76.2 | 114.9 | 97.0 |
| USC00300889 | Bridgehampton | Suffolk | 41.0 | −72.3 | 12.8 | 37.0 |
| USC00300910 | Bristol Harbour | Ontario | 42.7 | −77.3 | 286.5 | 0.0 |
| USC00300937 | Brockport | Monroe | 43.2 | −78.0 | 151.8 | 97.0 |
| USC00301068 | Buskirk | Rensselaer | 42.9 | −73.4 | 152.1 | 100.0 |
| USC00301102 | Callicoon Ctr | Sullivan | 41.8 | −75.0 | 372.2 | 27.0 |
| USC00301152 | Canandaigua 3 S | Ontario | 42.8 | −77.3 | 219.5 | 100.0 |
| USC00301211 | Carmel 4N | Putnam | 41.5 | −73.7 | 207.3 | 83.0 |
| USC00301264 | Cattaraugus 3W | Cattaraugus | 42.3 | −78.9 | 520.6 | 0.0 |
| USC00301265 | Cayuga Lock #1 | Cayuga | 42.9 | −76.7 | 115.8 | 0.0 |
| USC00301309 | Centerport | Suffolk | 40.9 | −73.4 | 9.1 | 93.0 |
| USC00301388 | Chases Lake | Lewis | 43.8 | −75.3 | 390.4 | 0.0 |
| USC00301580 | Clyde Lock 26 | Wayne | 43.1 | −76.8 | 119.5 | 0.0 |
| USC00301625 | Colden 1W | Erie | 42.6 | −78.7 | 467.9 | 97.0 |
| USC00301708 | Conklingville Dam | Saratoga | 43.3 | −73.9 | 246.3 | 100.0 |
| USC00301752 | Cooperstown | Otsego | 42.7 | −74.9 | 383.1 | 93.0 |
| USC00301787 | Corning | Steuben | 42.1 | −77.1 | 349.6 | 53.0 |
| USC00301974 | Dansville | Livingston | 42.6 | −77.7 | 201.2 | 100.0 |
| USC00302036 | Delhi 2 SE | Delaware | 42.3 | −74.9 | 445.0 | 83.0 |
| USC00302197 | Dunkirk | Chautauqua | 42.5 | −79.3 | 192.3 | 93.0 |
| USC00302454 | E Sidney | Delaware | 42.3 | −75.2 | 352.0 | 93.0 |
| USC00302554 | Elizabethtown | Essex | 44.2 | −73.6 | 186.2 | 0.0 |
| USC00302610 | Elmira | Chemung | 42.1 | −76.8 | 288.6 | 97.0 |
| USC00302934 | Ft Drum | Jefferson | 44.1 | −75.7 | 213.4 | 0.0 |
| USC00303025 | Franklinville | Cattaraugus | 42.3 | −78.5 | 484.6 | 100.0 |
| USC00303050 | Freeville 1 NE | Tompkins | 42.5 | −76.3 | 317.6 | 100.0 |
| USC00303087 | Fulton | Oswego | 43.3 | −76.4 | 109.7 | 0.0 |
| USC00303088 | Fulton Lock O-3 | Oswego | 43.3 | −76.4 | 102.4 | 0.0 |
| USC00303184 | Geneva Rsch Farm | Ontario | 42.9 | −77.0 | 218.8 | 67.0 |
| USC00303322 | Gloversville 7NW (Peck Lake) | Fulton | 43.1 | −74.4 | 443.5 | 100.0 |
| USC00303346 | Gouverneur 3 NW | St. Lawrence | 44.4 | −75.5 | 128.0 | 100.0 |
| USC00303444 | Greene | Chenango | 42.3 | −75.8 | 280.4 | 0.0 |
| USC00303773 | Hemlock | Livingston | 42.8 | −77.6 | 274.9 | 63.0 |
| USC00303851 | Highmarket 2W | Lewis | 43.6 | −75.6 | 549.9 | 100.0 |
| USC00303983 | Hornell Almond Dam | Steuben | 42.3 | −77.7 | 403.9 | 93.0 |
| USC00304102 | Indian Lake 2SW | Hamilton | 43.8 | −74.3 | 509.0 | 100.0 |
| USC00304174 | Ithaca Cornell Univ | Tompkins | 42.4 | −76.4 | 292.6 | 97.0 |
| USC00304207 | Jamestown 4 ENE | Chautauqua | 42.1 | −79.2 | 381.0 | 67.0 |
| USC00304526 | La Fargeville 4E | Jefferson | 44.2 | −75.9 | 132.6 | 0.0 |
| USC00304537 | Lake Luzerne | Saratoga | 43.3 | −73.8 | 185.9 | 0.0 |
| USC00304555 | Lake Placid 2 S | Essex | 44.3 | −74.0 | 575.5 | 100.0 |
| USC00304564 | Lake View 1NE | Erie | 42.7 | −78.9 | 197.2 | 0.0 |
| USC00304565 | Lakeside | Orleans | 43.4 | −78.3 | 87.8 | 0.0 |
| USC00304566 | Lakeville | Livingston | 42.8 | −77.7 | 250.2 | 0.0 |
| USC00304575 | Lansing Manor | Schoharie | 42.4 | −74.5 | 338.3 | 70.0 |
| USC00304684 | Le Roy 1E | Genesee | 43.0 | −78.0 | 272.8 | 0.0 |
| USC00304715 | Lewiston | Niagara | 43.2 | −79.0 | 108.2 | 0.0 |
| USC00304808 | Little Valley | Cattaraugus | 42.2 | −78.8 | 495.3 | 100.0 |
| USC00304844 | Lockport 2SE | Niagara | 43.2 | −78.7 | 195.7 | 100.0 |
| USC00304912 | Lowville | Lewis | 43.8 | −75.5 | 263.0 | 100.0 |
| USC00304952 | Macedon Lock E30 | Wayne | 43.1 | −77.3 | 142.0 | 0.0 |
| USC00304996 | Malone | Franklin | 44.8 | −74.3 | 267.6 | 100.0 |
| USC00305236 | Medina | Orleans | 43.2 | −78.4 | 164.0 | 0.0 |
| USC00305280 | Mexico 2SW | Oswego | 43.4 | −76.3 | 129.5 | 0.0 |
| USC00305426 | Mohonk Lake | Ulster | 41.8 | −74.2 | 336.5 | 0.0 |
| USC00305512 | Morrisville 6 SW | Madison | 42.8 | −75.7 | 512.4 | 50.0 |
| USC00305597 | Mt Morris 2W | Livingston | 42.7 | −77.9 | 268.2 | 93.0 |
| USC00305606 | Mt Sinai | Suffolk | 40.9 | −73.0 | 15.2 | 0.0 |
| USC00305679 | Newark | Wayne | 43.0 | −77.1 | 131.1 | 0.0 |
| USC00305714 | Newcomb | Essex | 44.0 | −74.2 | 502.0 | 87.0 |
| USC00305715 | Newfane | Niagara | 43.3 | −78.7 | 104.2 | 0.0 |
| USC00305840 | Niagara Falls | Niagara | 43.1 | −79.0 | 179.2 | 0.0 |
| USC00305925 | N Creek 5 SE | Warren | 43.7 | −73.9 | 271.3 | 0.0 |
| USC00306047 | N Tonawanda | Niagara | 43.1 | −78.9 | 176.2 | 97.0 |
| USC00306062 | Northville | Fulton | 43.2 | −74.2 | 240.8 | 0.0 |
| USC00306085 | Norwich | Chenango | 42.5 | −75.5 | 301.4 | 93.0 |
| USC00306184 | Old Forge | Herkimer | 43.7 | −75.0 | 520.0 | 0.0 |
| USC00306196 | Olean | Cattaraugus | 42.1 | −78.5 | 432.8 | 93.0 |
| USC00306276 | Orient Pt Sp | Suffolk | 41.1 | −72.3 | 0.9 | 0.0 |
| USC00306314 | Oswego | Oswego | 43.5 | −76.5 | 98.8 | 100.0 |
| USC00306376 | Palermo 2SSE | Oswego | 43.3 | −76.3 | 135.6 | 0.0 |
| USC00306465 | Pavilion 2 | Genesee | 42.9 | −78.0 | 353.6 | 0.0 |
| USC00306480 | Pendleton 1NE | Niagara | 43.1 | −78.7 | 179.5 | 0.0 |
| USC00306525 | Perrysburg | Cattaraugus | 42.5 | −79.0 | 368.8 | 77.0 |
| USC00306747 | Portland 1SW | Chautauqua | 42.4 | −79.5 | 246.3 | 40.0 |
| USC00306774 | Port Jervis | Orange | 41.4 | −74.7 | 176.8 | 80.0 |
| USC00306867 | Pulaski | Oswego | 43.6 | −76.1 | 121.6 | 17.0 |
| USC00307134 | Riverhead Rsch Farm | Suffolk | 41.0 | −72.7 | 30.5 | 70.0 |
| USC00307274 | Rosendale 2 E | Ulster | 41.8 | −74.0 | 37.2 | 0.0 |
| USC00307329 | Rushford | Allegany | 42.4 | −78.2 | 463.9 | 0.0 |
| USC00307425 | Sanborn 4NE | Niagara | 43.2 | −78.8 | 192.9 | 0.0 |
| USC00307484 | Saratoga Springs 4 SW | Saratoga | 43.0 | −73.8 | 99.4 | 0.0 |
| USC00307705 | Sherburne | Chenango | 42.7 | −75.5 | 333.8 | 97.0 |
| USC00307742 | Shrub Oak | Westchester | 41.3 | −73.8 | 140.8 | 97.0 |
| USC00307749 | Silver Springs 3N | Wyoming | 42.7 | −78.1 | 508.1 | 0.0 |
| USC00307750 | Silver Creek | Chautauqua | 42.5 | −79.2 | 198.1 | 0.0 |
| USC00307780 | Skaneateles | Onondaga | 42.9 | −76.4 | 266.7 | 0.0 |
| USC00307842 | Sodus 1W | Wayne | 43.2 | −77.1 | 135.3 | 0.0 |
| USC00308132 | Springville 5NE | Erie | 42.5 | −78.6 | 515.4 | 0.0 |
| USC00308248 | Stillwater Rsvr | Herkimer | 43.9 | −75.0 | 515.1 | 0.0 |
| USC00308577 | Syosset | Nassau | 40.8 | −73.5 | 80.8 | 0.0 |
| USC00308578 | Trenton Falls | Herkimer | 43.3 | −75.2 | 243.8 | 77.0 |
| USC00308600 | Troy L&D | Rensselaer | 42.8 | −73.7 | 4.6 | 0.0 |
| USC00308631 | Tupper Lake Sunmount | Franklin | 44.2 | −74.4 | 512.1 | 33.0 |
| USC00308721 | Upton Coop - Nwsfo New York | Suffolk | 40.9 | −72.9 | 24.4 | 97.0 |
| USC00308839 | Victor 2NW | Ontario | 43.0 | −77.4 | 199.3 | 0.0 |
| USC00308910 | Wales | Erie | 42.7 | −78.5 | 342.9 | 93.0 |
| USC00308932 | Walton 2 | Delaware | 42.2 | −75.1 | 451.1 | 97.0 |
| USC00308961 | Warsaw 4 W | Wyoming | 42.7 | −78.2 | 533.4 | 0.0 |
| USC00308962 | Warsaw 6 SW | Wyoming | 42.7 | −78.2 | 554.7 | 93.0 |
| USC00309000 | Watertown | Jefferson | 44.0 | −75.9 | 151.5 | 0.0 |
| USC00309047 | Waverly | Tioga | 42.0 | −76.5 | 243.8 | 0.0 |
| USC00309049 | Webster 2 NE | Monroe | 43.2 | −77.4 | 83.8 | 97.0 |
| USC00309072 | Wellsville | Allegany | 42.1 | −77.9 | 460.2 | 90.0 |
| USC00309089 | W Bloomfield 1 S | Ontario | 42.9 | −77.5 | 301.8 | 0.0 |
| USC00309248 | Westmoreland 4N | Oneida | 43.2 | −75.5 | 172.2 | 0.0 |
| USC00309389 | Whitehall | Washington | 43.6 | −73.4 | 36.3 | 0.0 |
| USC00309442 | Whitney Pt Dam | Broome | 42.3 | −76.0 | 317.0 | 100.0 |
| USC00309499 | Wilmington 2W | Essex | 44.4 | −73.9 | 615.7 | 0.0 |
| USC00309593 | Wyoming 3W | Wyoming | 42.8 | −78.1 | 475.2 | 100.0 |
| USC00309690 | Youngstown 1S | Niagara | 43.2 | −79.1 | 91.4 | 0.0 |
| USW00004720 | Jamestown | Chautauqua | 42.1 | −79.2 | 525.2 | 0.0 |
| USW00004724 | Niagara Falls Intl AP | Niagara | 43.1 | −78.9 | 178.3 | 100.0 |
| USW00004725 | Binghamton | Broome | 42.2 | −76.0 | 519.1 | 100.0 |
| USW00004742 | Plattsburgh Intl AP | Clinton | 44.6 | −73.5 | 71.9 | 100.0 |
| USW00004781 | Islip-Li Macarthur AP | Suffolk | 40.8 | −73.1 | 25.3 | 100.0 |
| USW00004789 | Montgomery Orange Co AP | Orange | 41.5 | −74.3 | 108.2 | 90.0 |
| USW00014714 | Stewart Fld | Orange | 41.5 | −74.1 | 177.1 | 100.0 |
| USW00014715 | Wheeler Sack Fld Aaf | Jefferson | 44.0 | −75.7 | 214.0 | 0.0 |
| USW00014719 | Westhampton Gabreski AP | Suffolk | 40.9 | −72.6 | 13.1 | 97.0 |
| USW00014732 | Laguardia AP | Queens | 40.8 | −73.9 | 3.0 | 100.0 |
| USW00014733 | Buffalo | Erie | 42.9 | −78.7 | 240.8 | 100.0 |
| USW00014735 | Albany Intl AP | Albany | 42.7 | −73.8 | 85.3 | 100.0 |
| USW00014747 | Dunkirk Chautauqua Co AP | Chautauqua | 42.5 | −79.3 | 203.9 | 97.0 |
| USW00014748 | Elmira Corning Rgnl AP | Chemung | 42.2 | −76.9 | 285.3 | 93.0 |
| USW00014750 | Glens Falls AP | Warren | 43.3 | −73.6 | 97.8 | 100.0 |
| USW00014757 | Poughkeepsie AP | Dutchess | 41.6 | −73.9 | 46.6 | 100.0 |
| USW00014768 | Rochester Gtr Intl | Monroe | 43.1 | −77.7 | 164.6 | 100.0 |
| USW00014771 | Syracuse Hancock Intl AP | Onondaga | 43.1 | −76.1 | 125.0 | 100.0 |
| USW00054746 | Monticello Sullivan | Sullivan | 41.7 | −74.8 | 427.6 | 0.0 |
| USW00054757 | Wellsville Muni AP | Allegany | 42.1 | −78.0 | 637.6 | 97.0 |
| USW00054773 | Fulton Oswego Co AP | Oswego | 43.4 | −76.4 | 143.6 | 97.0 |
| USW00054778 | Penn Yan AP | Yates | 42.6 | −77.1 | 267.3 | 97.0 |
| USW00054780 | Montauk AP | Suffolk | 41.1 | −71.9 | 2.1 | 100.0 |
| USW00054787 | Farmingdale Republic AP | Suffolk | 40.7 | −73.4 | 22.9 | 93.0 |
| USW00054790 | Shirley Brookhaven AP | Suffolk | 40.8 | −72.9 | 20.1 | 90.0 |
| USW00064756 | Millbrook 3 W | Dutchess | 41.8 | −73.7 | 125.9 | 100.0 |
| USW00064758 | Ithaca 13 E | Cortland | 42.4 | −76.2 | 374.3 | 100.0 |
| USW00064775 | Rome Griffiss Airfield | Oneida | 43.2 | −75.4 | 144.8 | 97.0 |
| USW00064776 | Plattsburgh Intl AP | Clinton | 44.6 | −73.5 | 50.3 | 100.0 |
| USW00094704 | Dansville Muni AP | Livingston | 42.6 | −77.7 | 196.0 | 97.0 |
| USW00094725 | Massena Intl AP | St. Lawrence | 44.9 | −74.8 | 61.0 | 100.0 |
| USW00094728 | Ny City Cntrl Park | New York | 40.8 | −74.0 | 42.7 | 100.0 |
| USW00094740 | Saranac Lk Adirondack Rgnl AP | Franklin | 44.4 | −74.2 | 505.7 | 100.0 |
| USW00094745 | Westchester Co AP | Westchester | 41.1 | −73.7 | 112.8 | 90.0 |
| USW00094789 | Jfk Intl AP | Queens | 40.6 | −73.8 | 2.7 | 100.0 |
| USW00094790 | Watertown AP | Jefferson | 44.0 | −76.0 | 94.8 | 100.0 |
Fuente: NOAA NCEI
11 Glosario, metodología y fuentes
Anomalía: diferencia entre el valor observado y su normal 1991–2020. Porcentaje de lo normal: acumulado observado dividido entre el normal, por 100. Récord de estación: valor diario más extremo del mismo mes en todos los años previos del registro (al menos 20 años).
Temperatura: NOAA nClimGrid-Daily. Precipitación: NOAA nClimGrid-Daily. nClimGrid-Daily es la malla de los valores estatales oficiales de la NOAA; aquí se promedia de 1/24° a 1/8° (unos 12 km). La temperatura media es (Tmáx + Tmín)/2. Los promedios estatales, regionales y por condado se ponderan por el área de cada celda dentro de cada polígono. Los mapas de temperatura, los días con helada y las tablas de anexos se presentan por región; las regiones son las divisiones climáticas de NOAA NCEI, con cada condado en la división de su centroide. Las semanas recientes usan el archivo preliminar del mes de NCEI; esos reportes se marcan como preliminares y se actualizan cuando se publica el archivo final. Las normales corresponden a 1991-2020; la posición en la serie compara valores redondeados a un decimal. Estaciones: GHCN-Daily (NOAA NCEI), estaciones cooperativas y de primer orden; se descartan los datos marcados por su control de calidad, los valores diarios a más de 5 desviaciones robustas de la mediana de la estación y las variables cuya anomalía mensual difiere más de 3 °C de la del análisis en malla. Los promedios requieren al menos 80 % de días con datos y las normales de estación al menos 20 años completos. Este reporte se genera automáticamente y no sustituye la información oficial del National Weather Service ni del climatólogo estatal.
| Fuente | Producto | Licencia | Cita |
|---|---|---|---|
| NOAA CPC | Official ENSO probabilities | Public domain (NOAA) | — |
| NOAA CPC | ONI, Niño-region SST indices (OISST v2.1), NAO and AO | Public domain (NOAA) | NOAA Climate Prediction Center climate indices. |
| NOAA NCEI / PSL | Extended Reconstructed SST v5 (ERSST v5), 2° | Public domain (NOAA) | Huang et al. (2017), J. Climate, doi:10.1175/JCLI-D-16-0836.1 |
| GDACS | Global Disaster Alert and Coordination System event list | See provider terms | — |
| NOAA NCEI | GHCN-Daily | Public domain (NOAA) | Menne et al. (2012), J. Atmos. Oceanic Technol., doi:10.1175/JTECH-D-11-00103.1 |
| NOAA NCEI | IBTrACS v04r01 tropical-cyclone best tracks | Public domain (NOAA) | Knapp et al. (2010), Bull. Amer. Meteor. Soc., doi:10.1175/2009BAMS2755.1 |
| NOAA NCEI | Pacific Decadal Oscillation index (ERSST v5) | Public domain (NOAA) | — |
| NOAA NCEI | nClimGrid-Daily, contiguous United States (1/24°, averaged here to 1/8°) | Public domain (NOAA) | Durre, I., et al. (2022). NOAA's nClimGrid-Daily Version 1. NOAA National Centers for Environmental Information. doi:10.25921/c4gt-r169 |
| NOAA CPC | North American Multi-Model Ensemble (NMME) tercile probabilities, 1° | Public domain (NOAA) | Kirtman et al. (2014), Bull. Amer. Meteor. Soc., doi:10.1175/BAMS-D-12-00050.1 |
| NOAA PSL | Real-time OLR MJO Index (ROMI) | Public domain (NOAA) | Kiladis et al. (2014), Mon. Wea. Rev., doi:10.1175/MWR-D-13-00301.1 |
| National Drought Mitigation Center, USDA, NOAA | U.S. Drought Monitor, weekly maps and area statistics | Free to use with credit (NDMC) | The U.S. Drought Monitor is jointly produced by the National Drought Mitigation Center at the University of Nebraska-Lincoln, the United States Department of Agriculture and the National Oceanic and Atmospheric Administration. Map courtesy of NDMC. |
| US Census Bureau TIGERweb | US Census Bureau, TIGERweb counties (generalised) | Public domain (US Government work) | — |
Generado por ClimaBulletin (climabulletin.org), código abierto. Preguntas y comentarios: [email protected].