Mexico · Weekly
Week 38, 2026 (14–20 September)
Downloads
Version history (3)
- version 3 · Final · 2026-10-11 — no change in the headline figures
- version 2 · Final · 2026-10-11 — no change in the headline figures
- version 1 · Final · 2026-10-11 — first issue
1 Key messages and climate synopsis
Source: NOAA CPC / PSL
Source: NOAA CPC / PSL
2 Global and regional climate drivers
Sea-surface temperature anomaly in the Niño regions (°C)
| Region | Anomaly (°C) | Change from preceding period (°C) |
|---|---|---|
| Niño 1+2 | 4.6 | 0.0 |
| Niño 3 | 3.8 | 0.1 |
| Niño 3.4 | 3.0 | 0.2 |
| Niño 4 | 1.0 | 0.2 |
Weekly mean (OISST v2.1)
Source: NOAA CPC
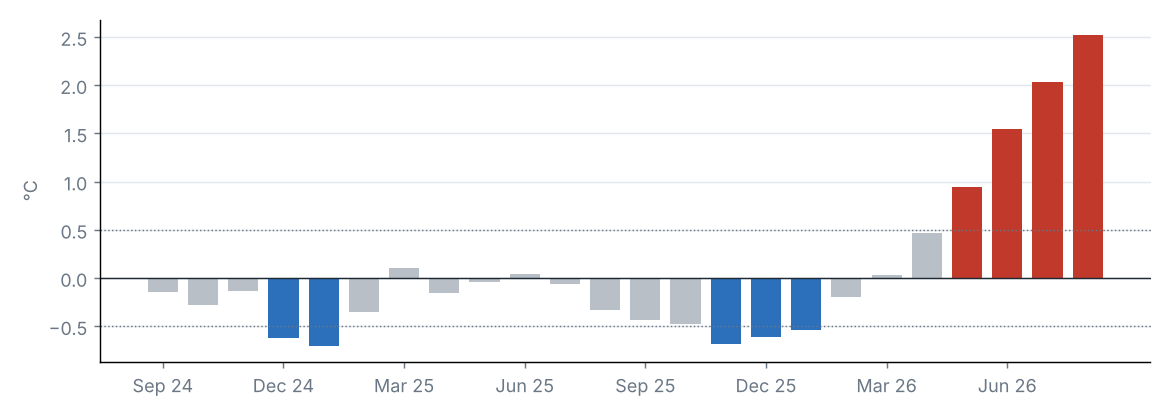
El Niño conditions of strong intensity: the Oceanic Niño Index (ONI) for JJA 2026 was +1.8 °C.
Source: NOAA CPC
Monthly Niño 3.4 anomaly, last 24 months (°C)
Source: NOAA CPC
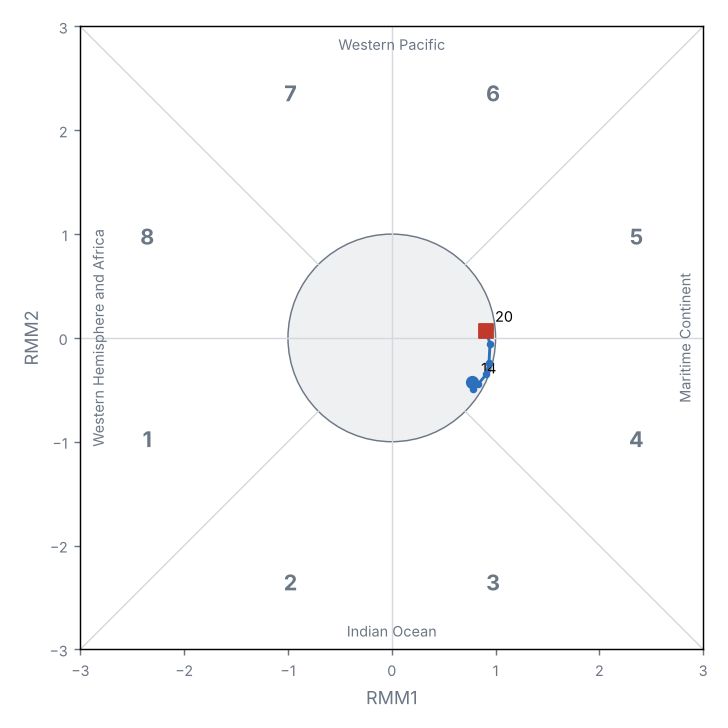
MJO phase diagram (real-time OMI)
Source: NOAA PSL
The Niño 3.4 anomaly was +3.00 °C (+0.20 °C relative to the preceding period).
The MJO was weak or inactive (amplitude below 1 on every day; mean 0.9).
3 Precipitation
Source: NOAA CPC / PSL
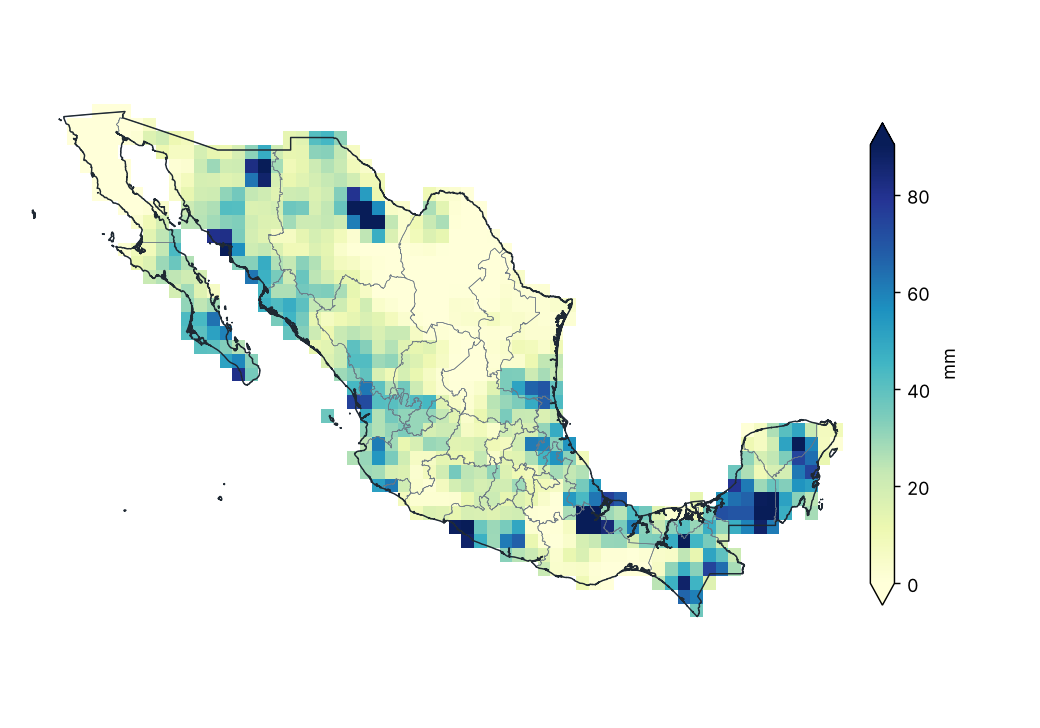
Accumulated precipitation
Source: NOAA CPC / PSL
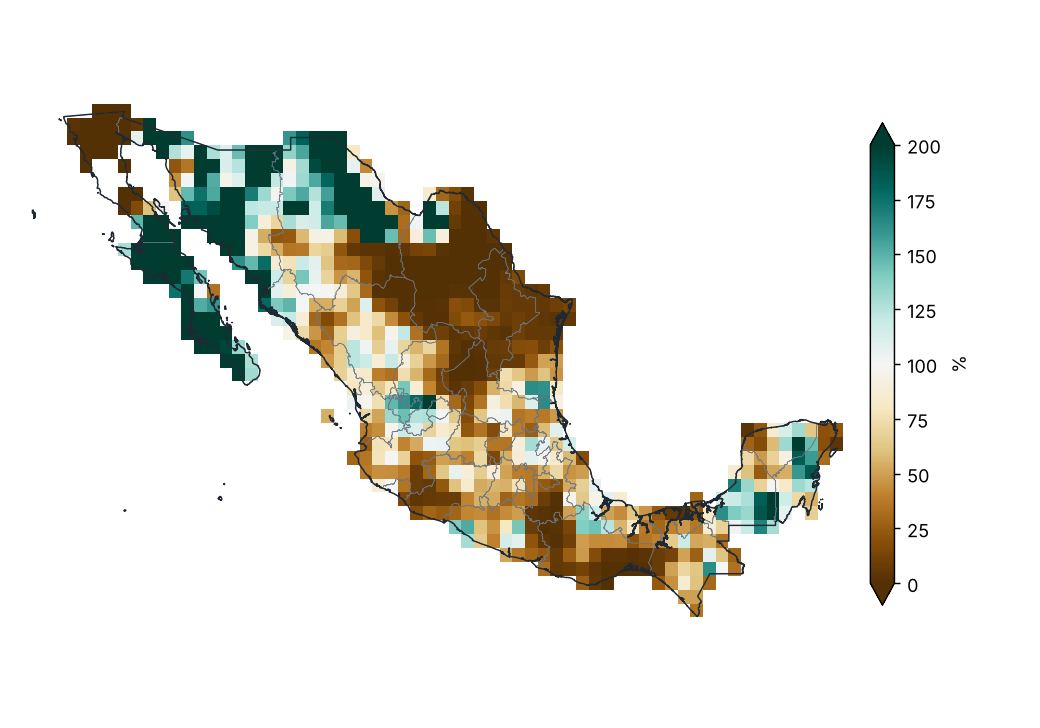
Percent of normal precipitation (1991–2020)
Source: NOAA CPC / PSL
Precipitation by region
| Region | Total (mm) | Normal (mm) | Difference (%) | Category |
|---|---|---|---|---|
| Northwest | 24.0 | 14.4 | 66.7 | Much above normal |
| North | 16.3 | 19.0 | −14.3 | Near normal |
| Northeast | 10.5 | 40.5 | −74.2 | Much below normal |
| North-central | 13.6 | 25.3 | −46.2 | Below normal |
| West-central | 22.9 | 39.2 | −41.7 | Below normal |
| Central | 19.3 | 39.0 | −50.4 | Below normal |
| South | 29.6 | 60.2 | −50.8 | Below normal |
| East | 37.1 | 61.8 | −39.9 | Below normal |
| Yucatán Peninsula | 45.7 | 42.0 | 8.8 | Near normal |
Source: NOAA CPC / PSL
Stations with the largest precipitation excess
| Region | State | Station | Altitude (m) | Anomaly (%) |
|---|---|---|---|---|
| Northwest | Baja California Sur | La Paz (City) | 18.0 | 2297.3 |
| North | Coahuila | Saltillo | 1790.0 | 745.2 |
| Northwest | Baja California Sur | Ciudad Constitucion | 48.0 | 732.8 |
| Central | Hidalgo | Tulancingo | 2181.0 | 533.8 |
| North | Durango | Durango | 1872.0 | 278.0 |
| South | Chiapas | Comitan | 1646.0 | 114.8 |
| Central | Tlaxcala | Tlaxcala De Xicontecatl (Dge) | 2230.0 | 50.0 |
| Northwest | Sinaloa | Colonia Juan Carras | 4.0 | 37.7 |
| East | Veracruz | Jalapa | 1389.0 | 29.9 |
| North | Chihuahua | Temosachi (Obs) | 1932.0 | 26.7 |
Source: NOAA NCEI
Stations with the largest precipitation deficit
| Region | State | Station | Altitude (m) | Anomaly (%) |
|---|---|---|---|---|
| Northwest | Baja California | Ejido Nuevo Leon (Obs) | 11.0 | −100.0 |
| Yucatán Peninsula | Yucatán | Progreso | 2.0 | −100.0 |
| South | Chiapas | Tapachula | 118.0 | −76.9 |
| North-central | San Luis Potosí | Rio Verde | 983.0 | −71.7 |
| Northeast | Tamaulipas | Tampico | 25.0 | −66.2 |
| Central | Estado de México | Toluca (Obs) | 2726.0 | −48.9 |
Source: NOAA NCEI
Largest 24-hour rainfall at stations
| Station | State | Max 24 h rainfall (mm) | Date |
|---|---|---|---|
| La Paz (City) | Baja California Sur | 94.6 | 2026-09-16 |
| Ciudad Constitucion | Baja California Sur | 55.8 | 2026-09-16 |
| Villahermosa | Tabasco | 53.7 | 2026-09-19 |
| Zacatecas Zac. (La Bufa | Zacatecas | 50.8 | 2026-09-16 |
| Saltillo | Coahuila | 45.4 | 2026-09-16 |
| Colonia Juan Carras | Sinaloa | 43.2 | 2026-09-17 |
| Tuxpan.Ver. | Veracruz | 39.6 | 2026-09-19 |
| Tulancingo | Hidalgo | 35.0 | 2026-09-16 |
| Comitan | Chiapas | 31.0 | 2026-09-14 |
| Ciudad Victoria | Tamaulipas | 27.4 | 2026-09-20 |
Source: NOAA NCEI
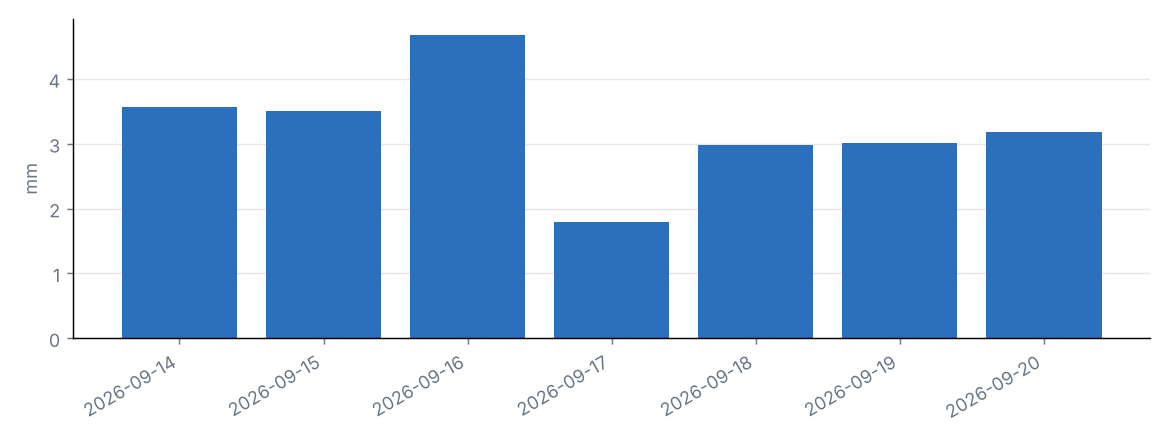
Daily national mean precipitation
Source: NOAA CPC / PSL
National accumulated precipitation was 22.7 mm, 71% of the 1991–2020 average (31.9 mm), category “Below normal”. It was the 17th driest week 38 in the 1979–2026 series.
The region with the highest percentage of normal was Northwest (167%) and the lowest was Northeast (26%).
The largest daily grid-cell total was estimated on 16 September in Chihuahua (146.7 mm).
Source: NOAA CPC / PSL
4 Temperature
Source: NOAA CPC / PSL
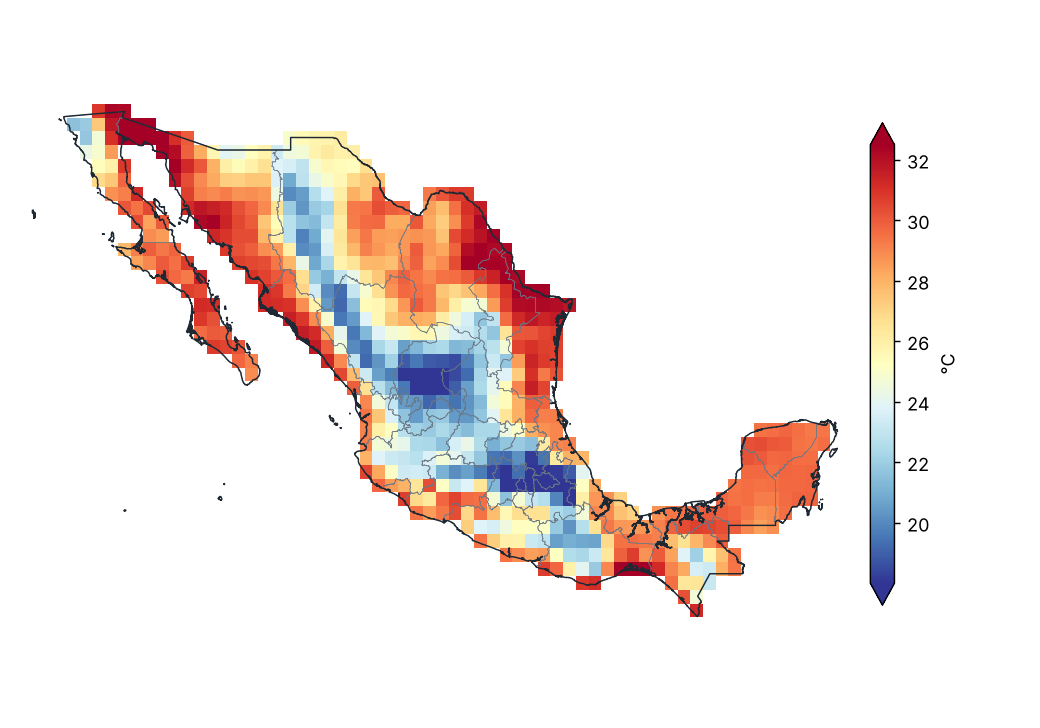
Mean temperature
Source: NOAA CPC / PSL
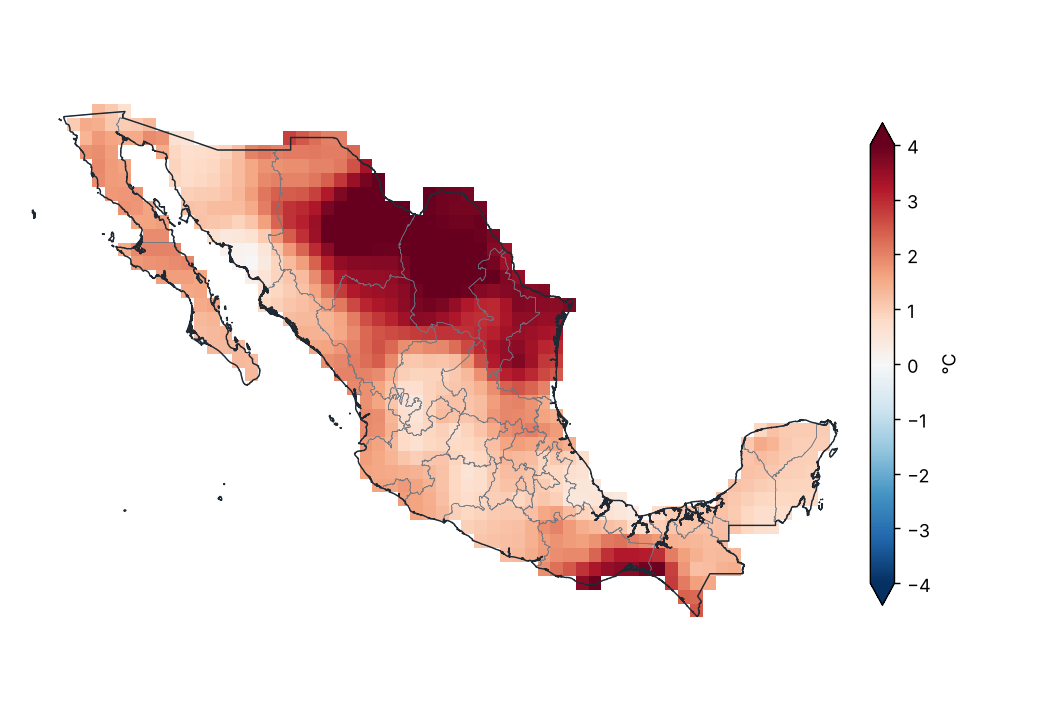
Mean temperature anomaly (1991–2020)
Source: NOAA CPC / PSL
Stations with the largest positive anomaly
| Region | State | Station | Altitude (m) | Anomaly (°C) |
|---|---|---|---|---|
| Northwest | Sinaloa | Colonia Juan Carras | 4.0 | 0.4 |
Source: NOAA NCEI
The national mean temperature was 26.5 °C, 1.9 °C above the 1991–2020 average (24.6 °C), category “Well above normal”. It was the 2nd warmest week 38 in the 1979–2026 series.
By region, the largest anomaly was in Northeast (+3.3 °C) and the smallest in East (+1.0 °C).
Source: NOAA CPC / PSL
Source: NOAA CPC / PSL
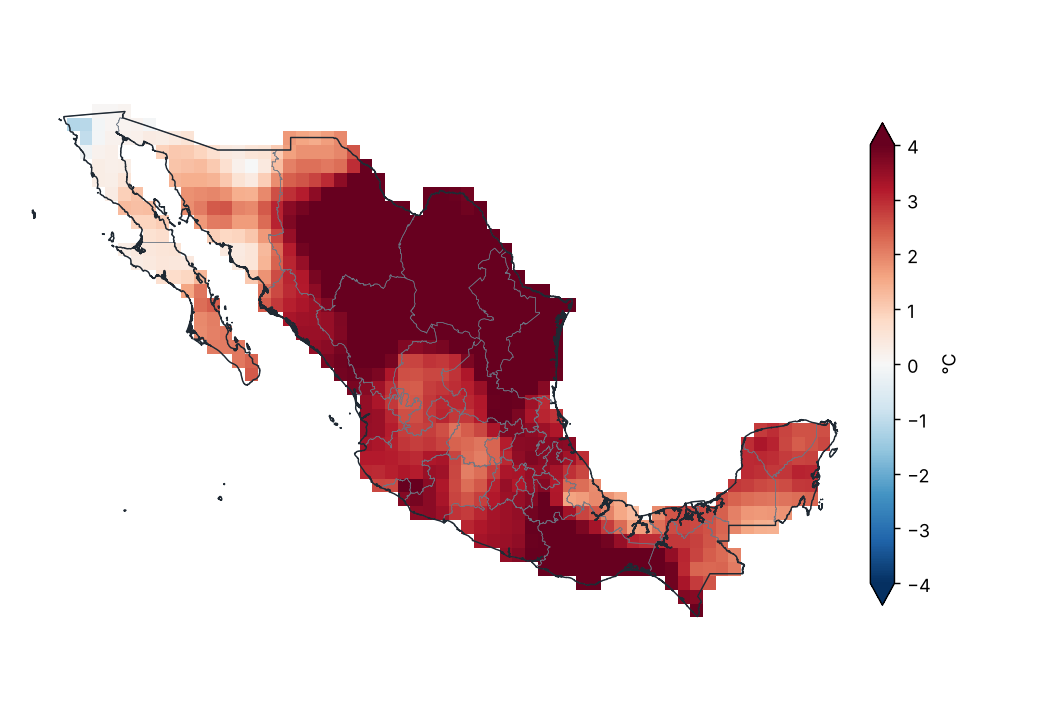
Maximum temperature anomaly (1991–2020)
Source: NOAA CPC / PSL
Lowest and highest monthly mean maximum temperature by region
| Region | Lowest value (°C) | Station | Highest value (°C) | Station |
|---|---|---|---|---|
| Northwest | 34.7 | Colonia Juan Carras, Sin. | 35.8 | Ciudad Constitucion, B.C.S. |
Station monthly means (GHCN-Daily, ≥ 80% of days with data).
Source: NOAA NCEI
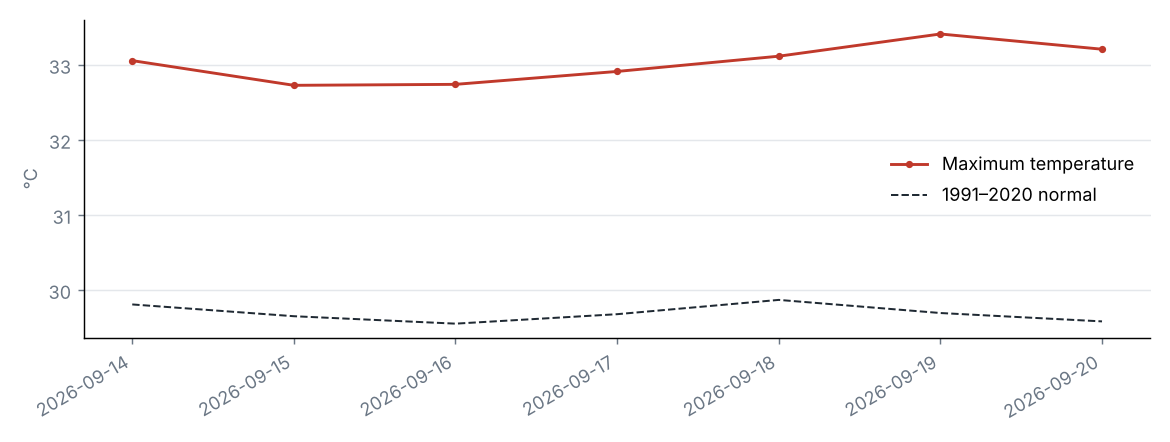
Daily national maximum temperature
Source: NOAA CPC / PSL
The national maximum temperature was 33.0 °C, 3.3 °C above the 1991–2020 average (29.7 °C), category “Extremely above normal”. It was the 2nd warmest week 38 in the 1979–2026 series.
By region, the largest anomaly was in Northeast (+5.1 °C) and the smallest in Northwest (+1.4 °C).
Source: NOAA CPC / PSL
Source: NOAA CPC / PSL
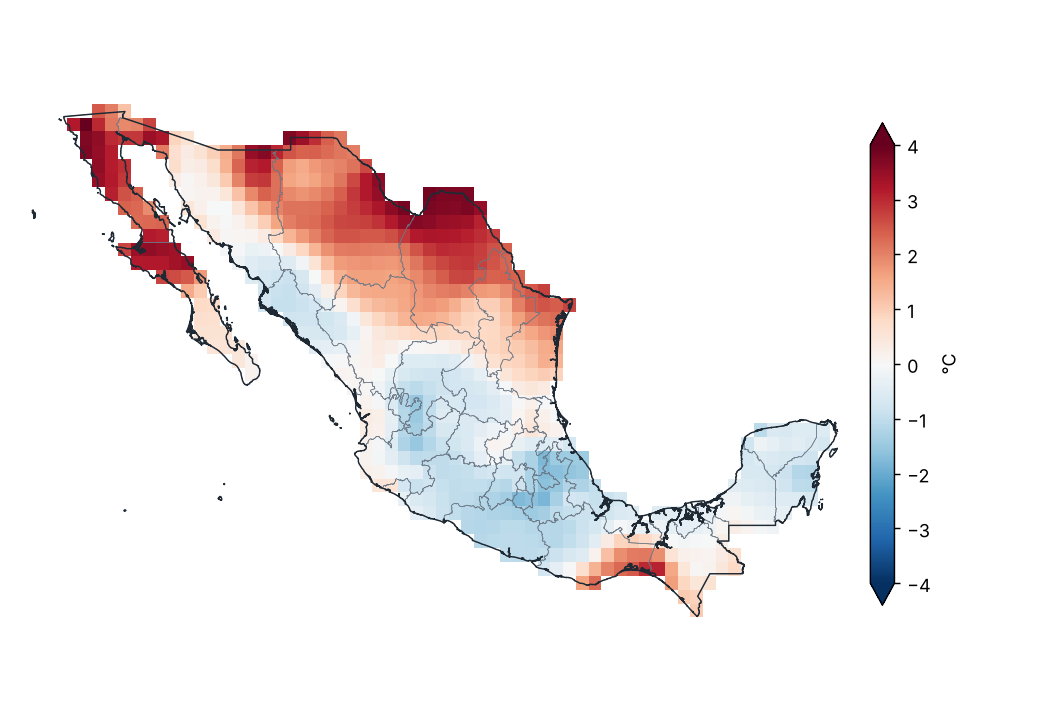
Minimum temperature anomaly (1991–2020)
Source: NOAA CPC / PSL
Lowest and highest monthly mean minimum temperature by region
| Region | Lowest value (°C) | Station | Highest value (°C) | Station |
|---|---|---|---|---|
| East | 13.8 | Jalapa, Ver. | 21.4 | Tuxpan.Ver., Ver. |
Station monthly means (GHCN-Daily, ≥ 80% of days with data).
Source: NOAA NCEI
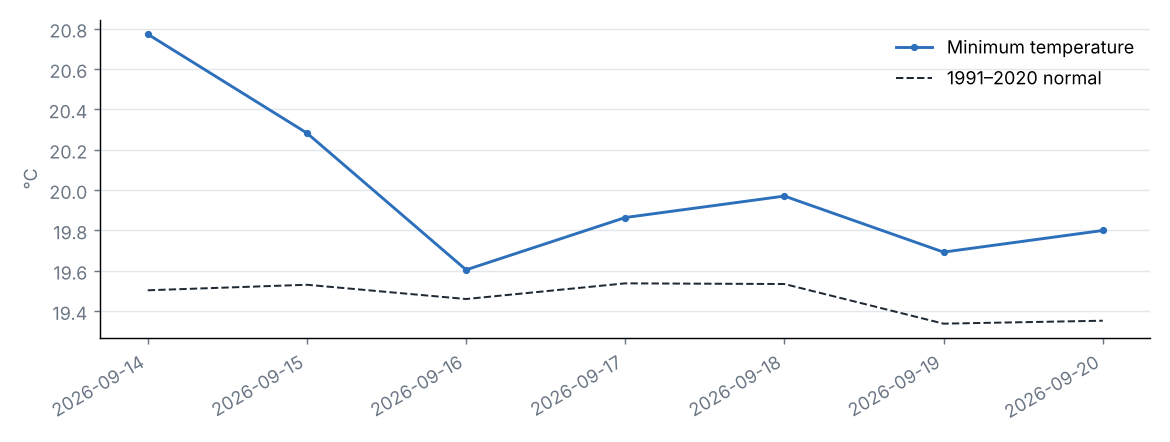
Daily national minimum temperature
Source: NOAA CPC / PSL
The national minimum temperature was 20.0 °C, 0.5 °C above the 1991–2020 average (19.5 °C), category “Slightly above normal”. It was the 9th warmest week 38 in the 1979–2026 series (tied with 2001, 2005, 2010, 2017).
By region, the largest anomaly was in North (+1.8 °C) and the smallest in Central (−1.0 °C).
Source: NOAA CPC / PSL
5 Climate extremes and records
Source: NOAA NCEI
Highest maximum temperature by state
| State | Station | Temperature (°C) | Date |
|---|---|---|---|
| Baja California Sur | Ciudad Constitucion | 39.8 | 2026-09-18 |
| Chiapas | Comitan | 33.9 | 2026-09-14 |
| Durango | Durango | 37.6 | 2026-09-18 |
| Jalisco | Guadalajara | 34.4 | 2026-09-17 |
| Michoacán | Zamora | 36.0 | 2026-09-18 |
| Sinaloa | Colonia Juan Carras | 38.0 | 2026-09-17 |
| Tamaulipas | Tampico | 38.6 | 2026-09-17 |
| Veracruz | Tuxpan.Ver. | 38.4 | 2026-09-18 |
| Yucatán | Valladolid | 35.4 | 2026-09-16 |
Source: NOAA NCEI
Lowest minimum temperature by state
| State | Station | Temperature (°C) | Date |
|---|---|---|---|
| Chiapas | Comitan | 11.7 | 2026-09-16 |
| Guerrero | Chilpancingo Ro. | 12.8 | 2026-09-19 |
| Sinaloa | Choix | 18.4 | 2026-09-18 |
| Tamaulipas | Tampico | 15.8 | 2026-09-17 |
| Veracruz | Jalapa | 11.2 | 2026-09-17 |
| Yucatán | Valladolid | 22.1 | 2026-09-20 |
Source: NOAA NCEI
Station records broken
| Station | State | Variable | New value | Date | Previous record | Previous date |
|---|---|---|---|---|---|---|
| Durango | Durango | Highest maximum temperature | 37.6 | 2026-09-18 | 37.4 | 2023-09-26 |
| Colonia Juan Carras | Sinaloa | Highest maximum temperature | 38.0 | 2026-09-17 | 36.8 | 2023-09-05 |
| Tampico | Tamaulipas | Lowest minimum temperature | 15.8 | 2026-09-17 | 17.0 | 2020-09-30 |
| Guadalajara | Jalisco | Highest maximum temperature | 34.4 | 2026-09-17 | 32.7 | 2023-09-13 |
| Comitan | Chiapas | Highest maximum temperature | 33.9 | 2026-09-14 | 32.4 | 1992-09-01 |
Most extreme daily value of the period against the same period in all earlier years of record (at least 20 years; for weeks, the same calendar month).
Source: NOAA NCEI
Climate-extremes indices (national mean)
| Index | Description | Value | Normal | Difference | Unit |
|---|---|---|---|---|---|
| TX90p | Warm days (Tmax > 90th percentile) | 66.1 | 10.0 | 56.1 | % |
| TN90p | Warm nights (Tmin > 90th percentile) | 16.0 | 10.0 | 6.0 | % |
| TX10p | Cool days (Tmax < 10th percentile) | 0.2 | 10.0 | −9.8 | % |
| TN10p | Cold nights (Tmin < 10th percentile) | 5.6 | 10.0 | −4.4 | % |
| FD | Frost days (Tmin < 0 °C) | 0.0 | 0.0 | −0.0 | d |
| SU | Summer days (Tmax > 25 °C) | 6.8 | 5.8 | 1.0 | d |
| TR | Tropical nights (Tmin > 20 °C) | 3.8 | 3.3 | 0.5 | d |
| WSDI | Warm spell days (≥ 6 days) | 2.4 | — | — | d |
| CSDI | Cold spell days (≥ 6 days) | 0.0 | — | — | d |
| Rx1day | Maximum 1-day precipitation | 12.6 | 15.6 | −3.0 | mm |
| Rx5day | Maximum 5-day precipitation | 20.6 | 28.6 | −8.0 | mm |
| CDD | Consecutive dry days (< 1 mm) | 3.5 | 3.4 | 0.1 | d |
| CWD | Consecutive wet days (≥ 1 mm) | 2.0 | 2.4 | −0.4 | d |
Percentile indices relative to calendar-day percentiles of 1991–2020 (5-day window); counts and maxima averaged over the country's grid cells.
Source: NOAA CPC / PSL
Heat and cold waves
| Dates | Type | Details |
|---|---|---|
| 2026-09-14 – 2026-09-20 | Heat wave | Up to 72% of the country above the 90th percentile of Tmax. Regions: North, Northeast, North-central, West-central, Central, South, East and Yucatán Peninsula. |
Wave: at least 3 consecutive days with at least half of the country above the 90th percentile of maximum temperature (heat) or below the 10th percentile of minimum temperature (cold). At most the 10 most intense are listed.
Source: NOAA CPC / PSL
6 Drought
The SPI is computed from monthly totals; see the latest monthly report (SPI).
7 Severe weather and notable events
Notable events
| Dates | Type | Details |
|---|---|---|
| 2026-04-21 – 2026-10-09 | Drought | GDACS Orange alert: Drought in The Bahamas, Belize, Costa Rica, Cuba, Dominican Republic, Guatemala, Honduras, Haiti, Mexico, Nicaragua, El Salvador. |
GDACS alerts and station rainfall of 150 mm or more in 24 hours (after quality control).
Source: GDACS
No tropical cyclone came within 300 km of the country.
9 Outlook
Weekly reports do not include a forecast yet; see the outlook in the latest monthly report (NMME seasonal forecast).
11 Glossary, methodology and sources
Anomaly: difference between the observed value and its 1991–2020 normal. Percent of normal: observed total divided by the normal, times 100. Station record: most extreme daily value for the same month in all earlier years of record (at least 20 years).
Temperature: CPC_TEMP (0.5° daily grid); mean temperature is (Tmax + Tmin)/2. Precipitation: CPC. National, regional and state averages are weighted by the area of each grid cell inside each polygon. Normals refer to 1991-2020; ranks compare values rounded to one decimal. Stations: GHCN-Daily (NOAA NCEI); values flagged by its quality control are discarded, as are daily values more than 5 robust standard deviations from the station median and variables whose monthly anomaly differs by more than 3 °C from the gridded analysis. Period means require at least 80% of days with data and station normals at least 20 complete years. This report is generated automatically and does not replace official information from the national meteorological service.
| Source | Product | License | Citation |
|---|---|---|---|
| NOAA CPC | ONI, Niño-region SST indices (OISST v2.1), NAO and AO | Public domain (NOAA) | NOAA Climate Prediction Center climate indices. |
| NOAA CPC / PSL | CPC Global Unified Gauge-Based Analysis of Daily Precipitation, 0.5° | Public domain (NOAA) | CPC Global Unified Precipitation data provided by NOAA PSL, Boulder, CO, USA. |
| NOAA CPC / PSL | CPC Global Unified Temperature, daily 0.5° | Public domain (NOAA) | CPC Global Unified Temperature data provided by NOAA PSL, Boulder, CO, USA. |
| GDACS | Global Disaster Alert and Coordination System event list | See provider terms | — |
| NOAA NCEI | GHCN-Daily | Public domain (NOAA) | Menne et al. (2012), J. Atmos. Oceanic Technol., doi:10.1175/JTECH-D-11-00103.1 |
| NOAA NCEI | IBTrACS v04r01 tropical-cyclone best tracks | Public domain (NOAA) | Knapp et al. (2010), Bull. Amer. Meteor. Soc., doi:10.1175/2009BAMS2755.1 |
| NOAA PSL | Real-time OLR MJO Index (ROMI) | Public domain (NOAA) | Kiladis et al. (2014), Mon. Wea. Rev., doi:10.1175/MWR-D-13-00301.1 |
| geoBoundaries | geoBoundaries gbOpen (Instituto Nacional de Estadística y Geografía (INEGI)) | Creative Commons Attribution 3.0 Intergovernmental Organisations (CC BY 3.0 IGO) | — |
Generated by ClimaBulletin (climabulletin.org), open source. Feedback: open an issue in the project repository.