Texas · Monthly
September 2026
Downloads
1 Key messages and climate synopsis
Source: NOAA NCEI
Source: NOAA NCEI
2 Global and regional climate drivers
Sea-surface temperature anomaly, September 2026 (°C, 1991–2020)
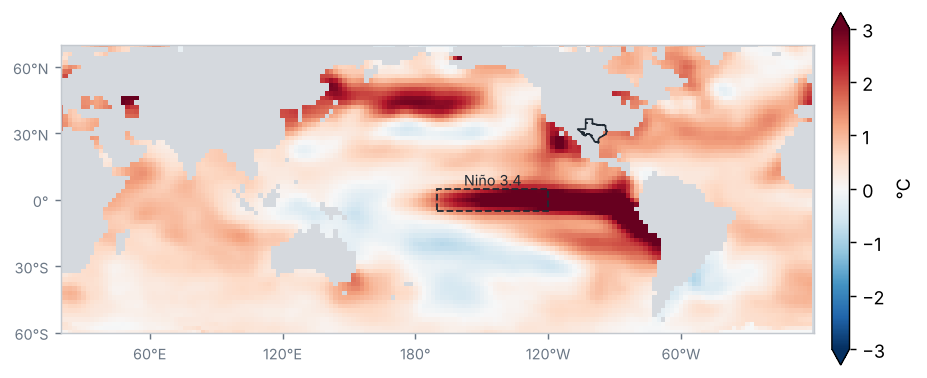
Source: NOAA NCEI / PSL
Sea-surface temperature anomaly in the Niño regions (°C)
| Region | Anomaly (°C) | Change from preceding period (°C) |
|---|---|---|
| Niño 1+2 | 4.7 | 0.6 |
| Niño 3 | 3.6 | 0.5 |
| Niño 3.4 | 2.8 | 0.3 |
| Niño 4 | 0.9 | 0.0 |
Mean of the months in the period (OISST v2.1)
Source: NOAA CPC
El Niño conditions of very strong intensity: the Oceanic Niño Index (ONI) for JAS 2026 was +2.2 °C.
Source: NOAA CPC
Monthly Niño 3.4 anomaly, last 24 months (°C)
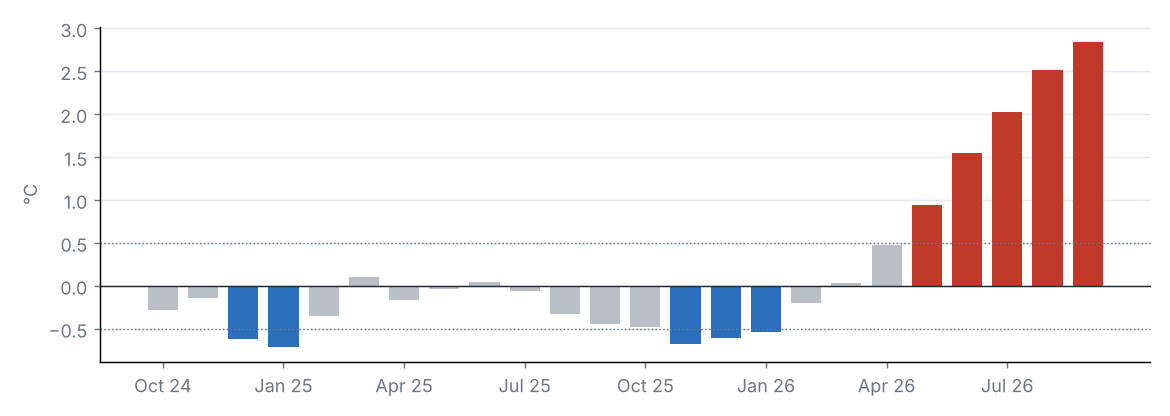
Source: NOAA CPC
MJO phase diagram (real-time OMI)
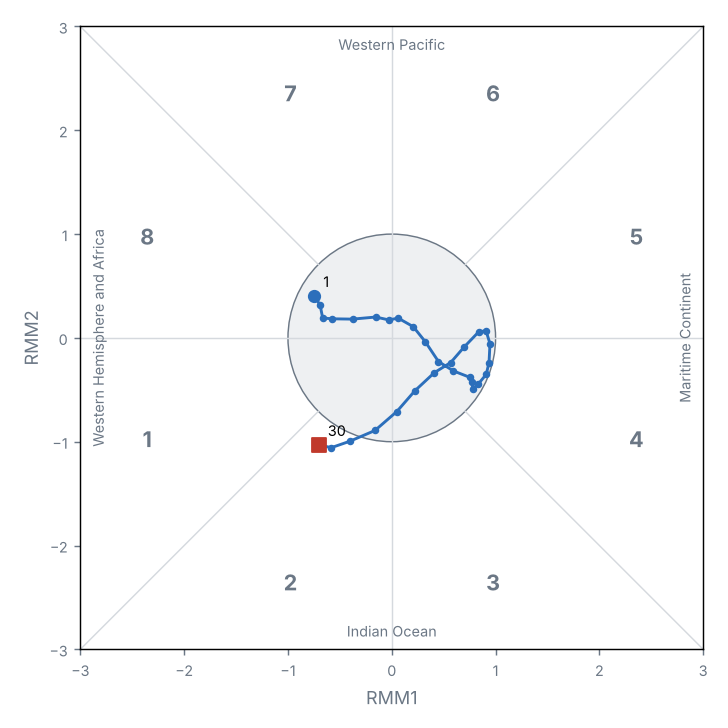
Source: NOAA PSL
Teleconnection indices
| Index | Value | Phase |
|---|---|---|
| NAO | 0.5 | Positive |
| AO | 1.2 | Positive |
| PDO | −1.6 | Negative |
North Atlantic Oscillation (NAO); Arctic Oscillation (AO); Pacific Decadal Oscillation (PDO).
Source: NOAA CPC, NOAA NCEI
The Niño 3.4 anomaly was +2.84 °C (+0.32 °C relative to the preceding period).
The MJO was active on 3 of 30 days, most often in phase 2 (Indian Ocean); mean amplitude 0.7.
Other indices: NAO +0.53 (positive phase); AO +1.16 (positive phase); PDO −1.55 (negative phase).
3 Precipitation
Source: NOAA NCEI
Accumulated precipitation
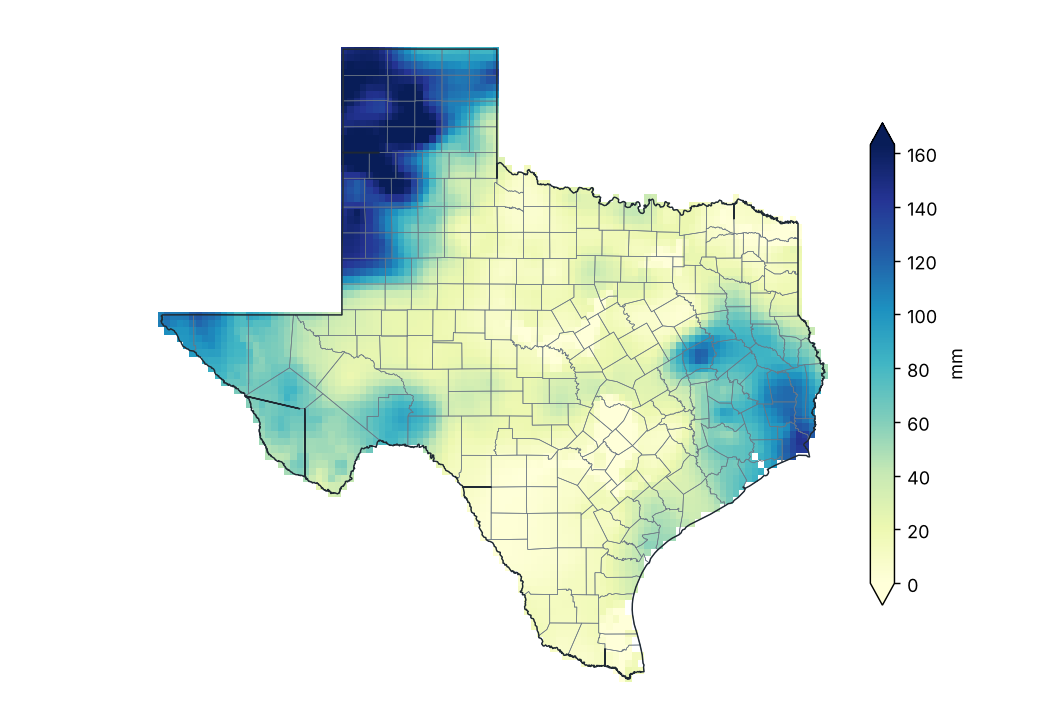
Source: NOAA NCEI
Percent of normal precipitation (1991–2020)
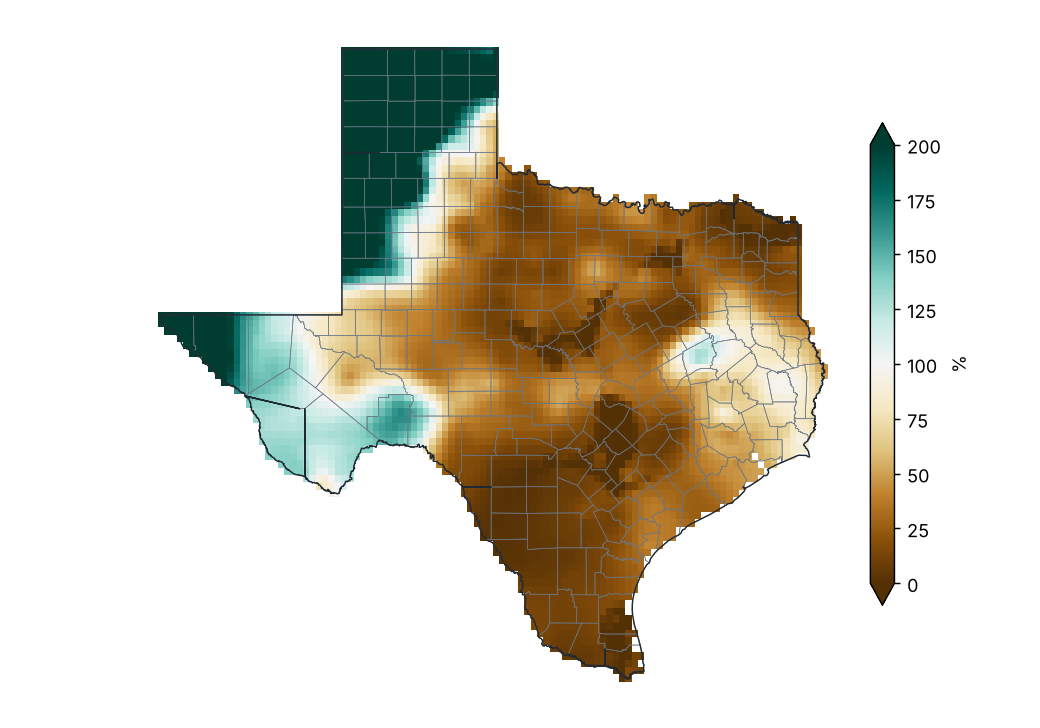
Source: NOAA NCEI
Percent of normal by county
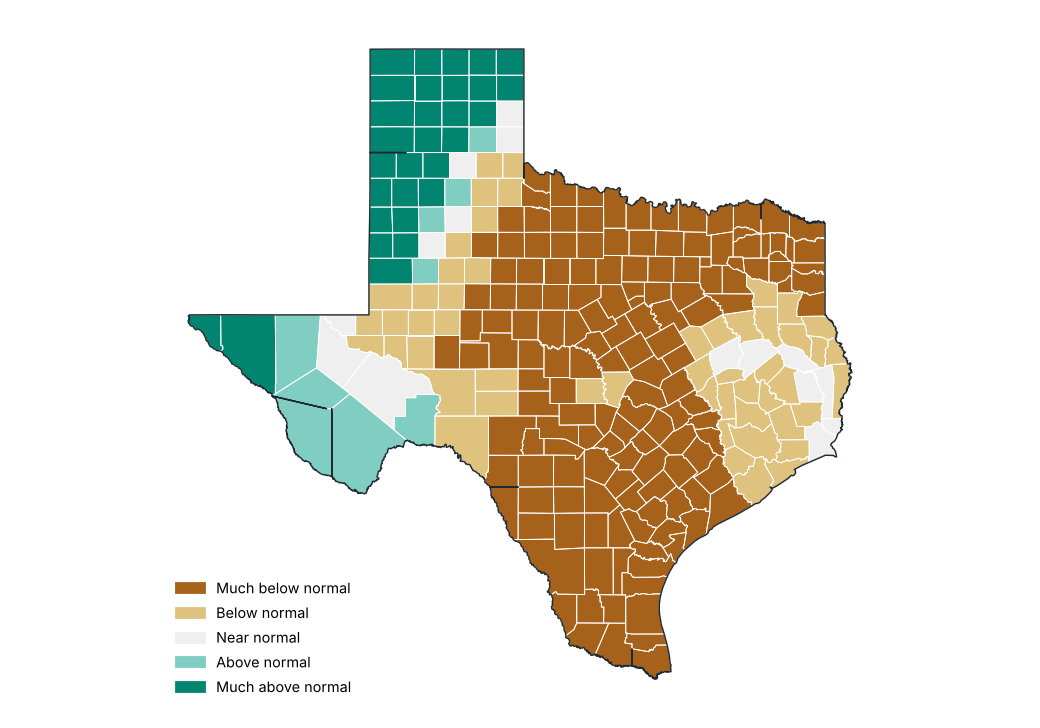
Source: NOAA NCEI
Precipitation by region
| Region | Total (mm) | Normal (mm) | Difference (%) | Category |
|---|---|---|---|---|
| High Plains | 116.5 | 52.1 | 123.5 | Much above normal |
| Low Rolling Plains | 27.1 | 67.8 | −60.1 | Much below normal |
| North Central | 17.7 | 80.1 | −78.0 | Much below normal |
| East Texas | 54.6 | 98.2 | −44.4 | Below normal |
| Trans Pecos | 59.1 | 46.1 | 28.2 | Above normal |
| Edwards Plateau | 24.3 | 71.5 | −66.0 | Much below normal |
| South Central | 15.4 | 100.3 | −84.7 | Much below normal |
| Upper Coast | 64.9 | 137.7 | −52.9 | Below normal |
| Southern | 7.9 | 97.9 | −91.9 | Much below normal |
| Lower Valley | 8.4 | 125.7 | −93.3 | Much below normal |
Source: NOAA NCEI
Stations with the largest precipitation excess
| Region | County | Station | Altitude (m) | Anomaly (%) |
|---|---|---|---|---|
| High Plains | Hartley | Dalhart Faa AP | 1216.0 | 442.8 |
| High Plains | Hutchinson | Sanford Dam | 895.0 | 420.1 |
| High Plains | Potter | Amarillo | 1129.0 | 360.9 |
| High Plains | Parmer | Friona | 1227.0 | 301.7 |
| High Plains | Oldham | Boys Rch | 973.0 | 272.2 |
| High Plains | Castro | Hart | 1116.0 | 259.7 |
| High Plains | Hale | Plainview | 1027.0 | 234.3 |
| High Plains | Cochran | Morton | 1148.0 | 228.3 |
| High Plains | Hale | Plainview Water Production | 1052.0 | 224.0 |
| High Plains | Yoakum | Plains | 1120.0 | 223.8 |
Source: NOAA NCEI
Stations with the largest precipitation deficit
| Region | County | Station | Altitude (m) | Anomaly (%) |
|---|---|---|---|---|
| North Central | Stephens | Breckenridge | 357.0 | −100.0 |
| North Central | Delta | Cooper | 148.0 | −100.0 |
| Southern | Webb | Encinal | 166.0 | −100.0 |
| North Central | Bell | Killeen | 248.0 | −100.0 |
| Low Rolling Plains | Taylor | Tuscola 2NW | 611.0 | −100.0 |
| Southern | La Salle | Los Angeles 4 WSW | 128.0 | −100.0 |
| Edwards Plateau | Uvalde | Sabinal | 290.0 | −100.0 |
| North Central | Navarro | Corsicana Campbell Fld | 135.0 | −100.0 |
| North Central | Tarrant | Ft Worth Nas | 185.0 | −100.0 |
| Lower Valley | Hidalgo | Mcallen | 34.0 | −99.2 |
Source: NOAA NCEI
Largest 24-hour rainfall at stations
| Station | County | Max 24 h rainfall (mm) | Date |
|---|---|---|---|
| Centerville | Leon | 134.6 | 2026-09-04 |
| Sanford Dam | Hutchinson | 115.8 | 2026-09-30 |
| Bushland 1 WSW | Potter | 110.7 | 2026-09-30 |
| Gruver | Hansford | 101.6 | 2026-09-30 |
| Port Arthur City | Jefferson | 91.7 | 2026-09-04 |
| Town Bluff Dam | Tyler | 88.9 | 2026-09-02 |
| Lumberton | Hardin | 86.4 | 2026-09-02 |
| Port Arthur SE Tx Rgnl AP | Jefferson | 84.6 | 2026-09-01 |
| Nacogdoches | Nacogdoches | 81.5 | 2026-09-03 |
| Randall 10SE | Randall | 81.3 | 2026-09-30 |
Source: NOAA NCEI
Daily statewide mean precipitation
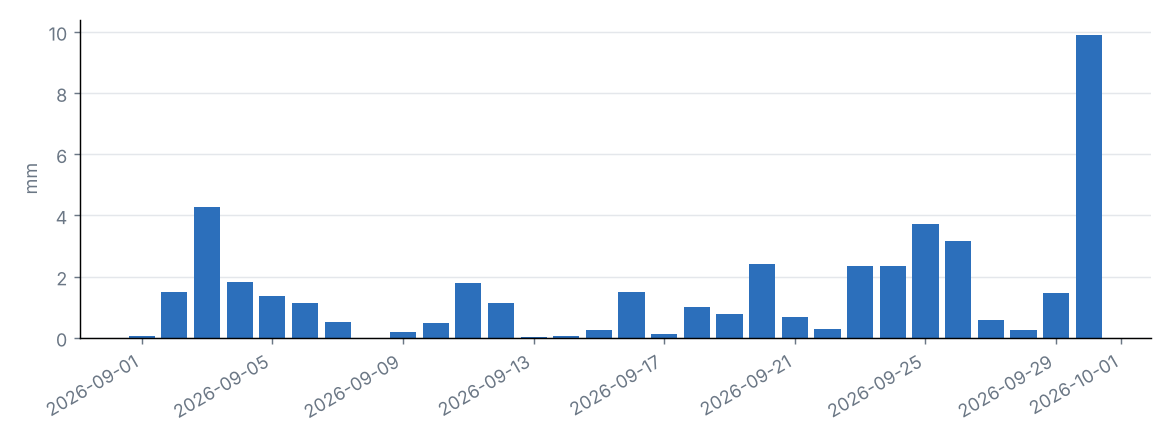
Source: NOAA NCEI
Daily statewide mean and grid-cell maximum
| Day | Statewide mean (mm) | Grid maximum (mm) | County |
|---|---|---|---|
| 2026-09-01 | 0.0 | 2.3 | Jeff Davis |
| 2026-09-02 | 1.5 | 63.1 | Jefferson |
| 2026-09-03 | 4.3 | 74.1 | Houston |
| 2026-09-04 | 1.8 | 57.1 | Leon |
| 2026-09-05 | 1.4 | 20.7 | Pecos |
| 2026-09-06 | 1.1 | 17.6 | Shelby |
| 2026-09-07 | 0.5 | 22.8 | Montgomery |
| 2026-09-08 | 0.0 | 2.7 | Titus |
| 2026-09-09 | 0.2 | 8.2 | Jefferson |
| 2026-09-10 | 0.5 | 10.4 | Kenedy |
| 2026-09-11 | 1.8 | 40.1 | Parker |
| 2026-09-12 | 1.1 | 31.3 | Tarrant |
| 2026-09-13 | 0.0 | 5.6 | Lipscomb |
| 2026-09-14 | 0.1 | 5.8 | DeWitt |
| 2026-09-15 | 0.2 | 6.3 | Oldham |
| 2026-09-16 | 1.5 | 25.8 | Terry |
| 2026-09-17 | 0.1 | 10.7 | El Paso |
| 2026-09-18 | 1.0 | 56.6 | Aransas |
| 2026-09-19 | 0.8 | 19.6 | Kenedy |
| 2026-09-20 | 2.4 | 28.3 | Brewster |
| 2026-09-21 | 0.7 | 28.7 | Llano |
| 2026-09-22 | 0.3 | 17.5 | Erath |
| 2026-09-23 | 2.3 | 31.3 | El Paso |
| 2026-09-24 | 2.3 | 74.3 | Dallam |
| 2026-09-25 | 3.7 | 55.7 | Parmer |
| 2026-09-26 | 3.2 | 46.5 | Hale |
| 2026-09-27 | 0.6 | 18.8 | Coleman |
| 2026-09-28 | 0.3 | 27.3 | Burnet |
| 2026-09-29 | 1.5 | 17.5 | Crockett |
| 2026-09-30 | 9.9 | 101.2 | Moore |
Source: NOAA NCEI
Statewide precipitation in September of each year
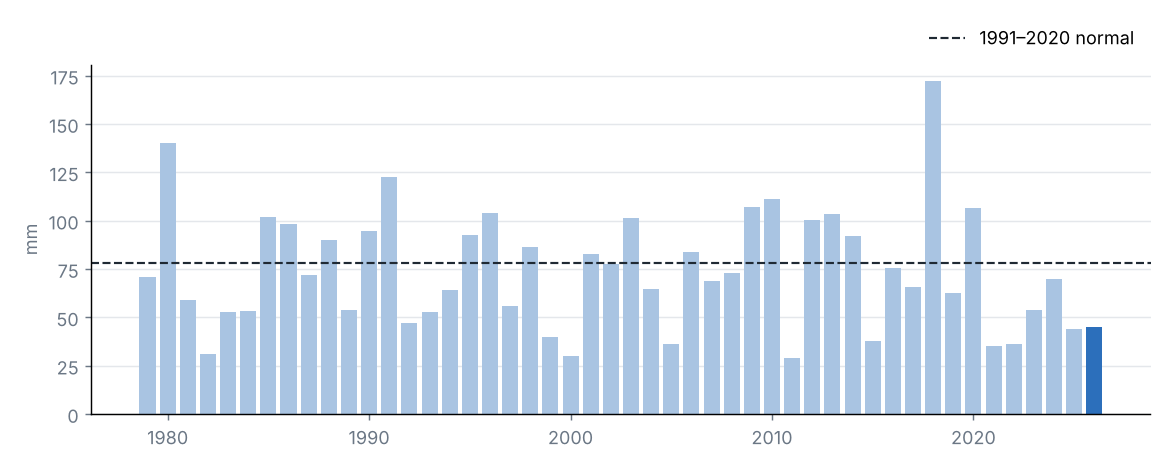
Source: NOAA NCEI
Statewide accumulated precipitation was 45.1 mm, 58% of the 1991–2020 average (78.2 mm), category “Below normal”. It was the 10th driest September in the 1979–2026 series.
The region with the highest percentage of normal was High Plains (224%) and the lowest was Lower Valley (7%).
The largest daily grid-cell total was estimated on 30 September in Moore (101.2 mm).
Source: NOAA NCEI
4 Temperature
Source: NOAA NCEI
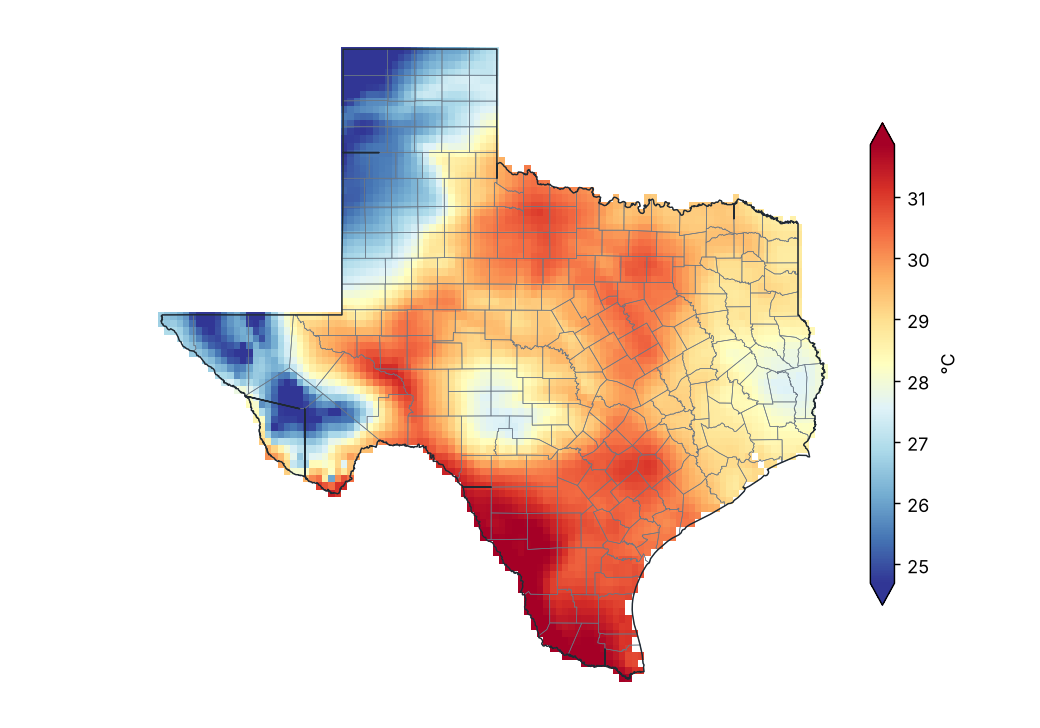
Mean temperature
Source: NOAA NCEI
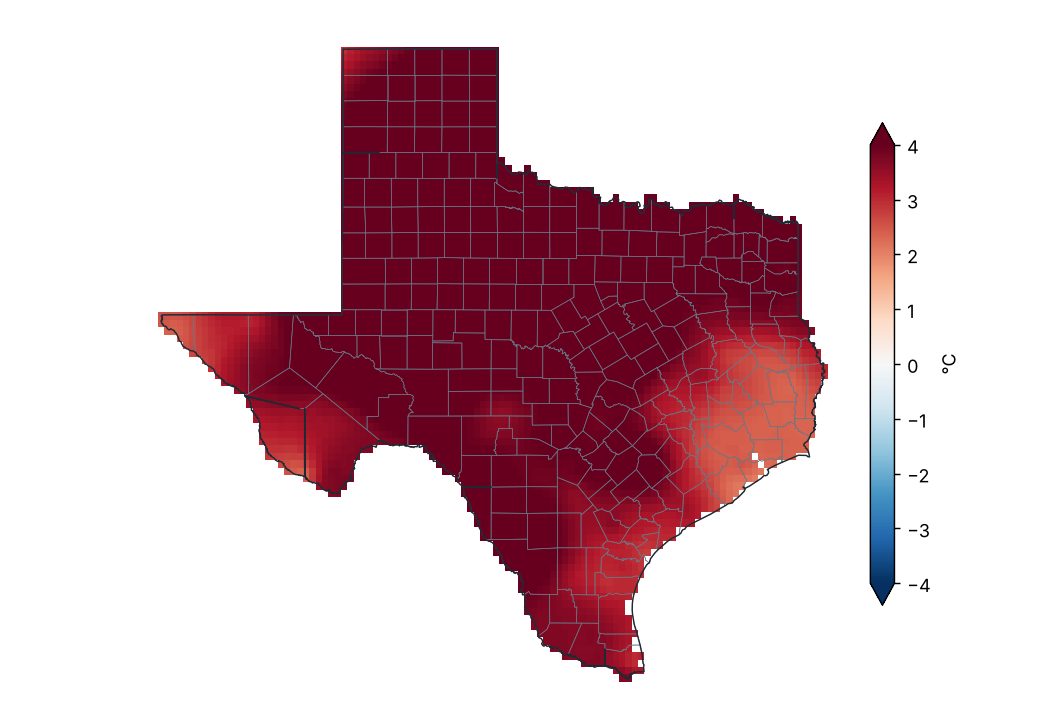
Mean temperature anomaly (1991–2020)
Source: NOAA NCEI
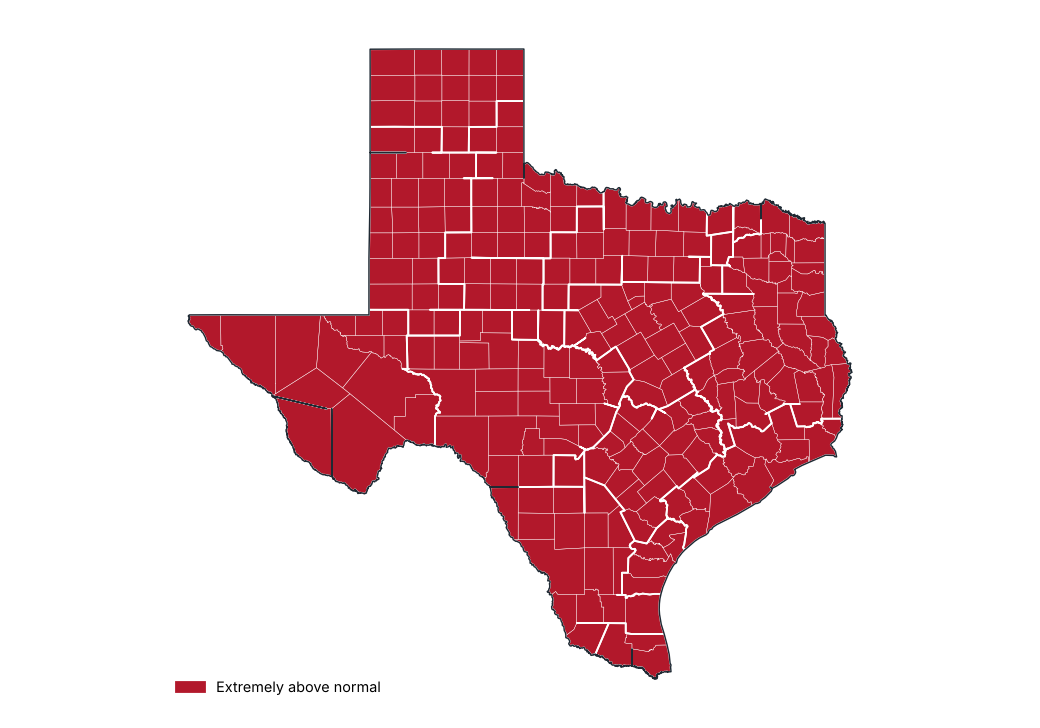
Mean temperature anomaly by region
Source: NOAA NCEI
Stations with the largest positive anomaly
| Region | County | Station | Altitude (m) | Anomaly (°C) |
|---|---|---|---|---|
| Low Rolling Plains | King | Guthrie | 536.0 | 6.7 |
| Low Rolling Plains | Baylor | Lake Kemp | 356.0 | 6.6 |
| Edwards Plateau | Reagan | Cope Rch | 756.0 | 6.4 |
| Low Rolling Plains | Knox | Truscott 3 W | 479.0 | 6.1 |
| Low Rolling Plains | Stonewall | Aspermont | 535.0 | 6.1 |
| Low Rolling Plains | Dickens | Spur | 700.0 | 6.0 |
| Low Rolling Plains | Scurry | Snyder | 707.0 | 6.0 |
| Low Rolling Plains | Jones | Stamford 1 | 491.0 | 5.9 |
| High Plains | Lipscomb | Follett | 844.0 | 5.8 |
| Low Rolling Plains | King | Paducah 15S | 566.0 | 5.8 |
Source: NOAA NCEI
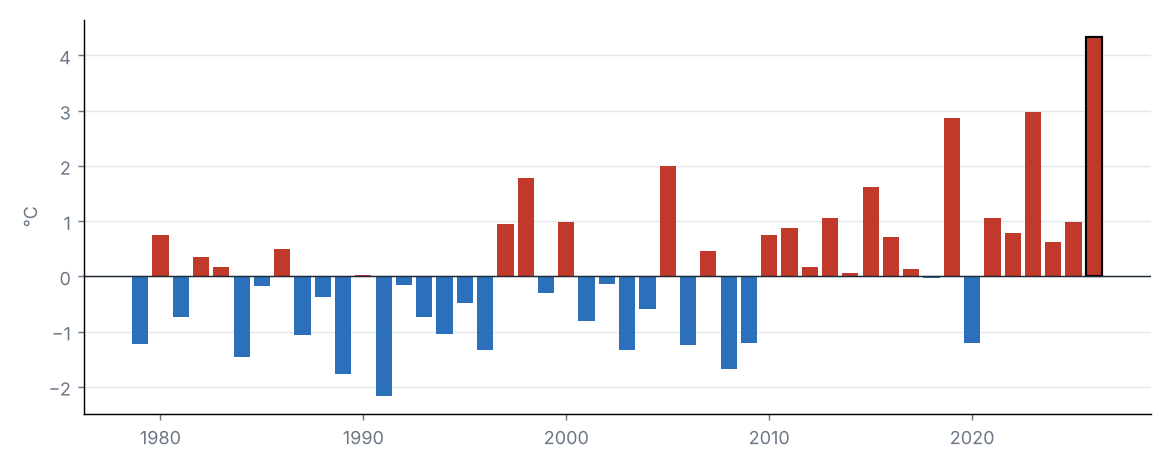
Statewide mean temperature anomaly in September of each year
Source: NOAA NCEI
The statewide mean temperature was 29.0 °C, 4.3 °C above the 1991–2020 average (24.6 °C), category “Extremely above normal”. It was the warmest September in the 1979–2026 series.
By region, the largest anomaly was in Low Rolling Plains (+5.6 °C) and the smallest in Upper Coast (+2.7 °C).
Source: NOAA NCEI
Source: NOAA NCEI
Maximum temperature anomaly (1991–2020)
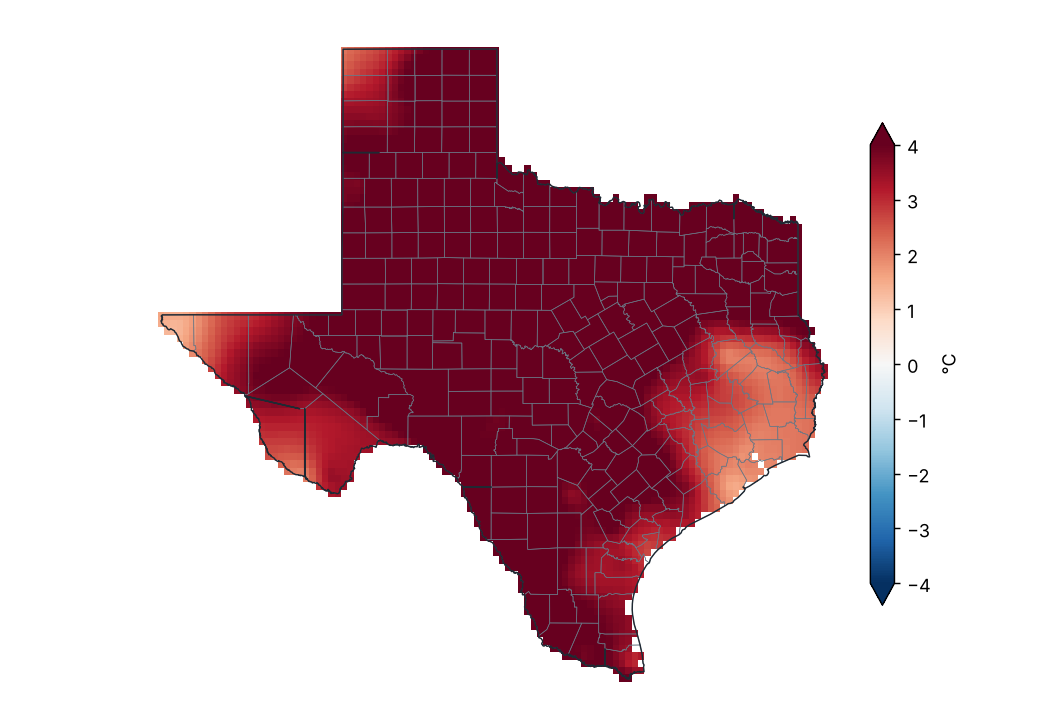
Source: NOAA NCEI
Lowest and highest monthly mean maximum temperature by region
| Region | Lowest value (°C) | Station | Highest value (°C) | Station |
|---|---|---|---|---|
| High Plains | 31.8 | Dalhart Faa AP | 35.9 | Big Spring Wrinkle AP |
| Low Rolling Plains | 34.7 | Snyder Winston Fld AP | 38.6 | Lake Kemp |
| North Central | 34.6 | Sherman | 39.9 | Comanche Co City AP |
| East Texas | 33.4 | Town Bluff Dam | 39.2 | Mt Pleasant |
| Trans Pecos | 29.7 | Chisos Basin | 40.0 | Rio Grande Village |
| Edwards Plateau | 33.8 | Harper 3ENE | 37.9 | Cope Rch |
| South Central | 33.4 | Corpus Christi Nas | 37.6 | Beeville 5 NE |
| Upper Coast | 32.0 | Orange 9 N | 37.0 | Victoria Rgnl AP |
| Southern | 36.2 | Mathis 4 SSW | 39.5 | Freer |
| Lower Valley | 33.9 | Port Isabel | 39.6 | Mcallen Miller Intl AP |
Station monthly means (GHCN-Daily, ≥ 80% of days with data).
Source: NOAA NCEI
Daily statewide maximum temperature
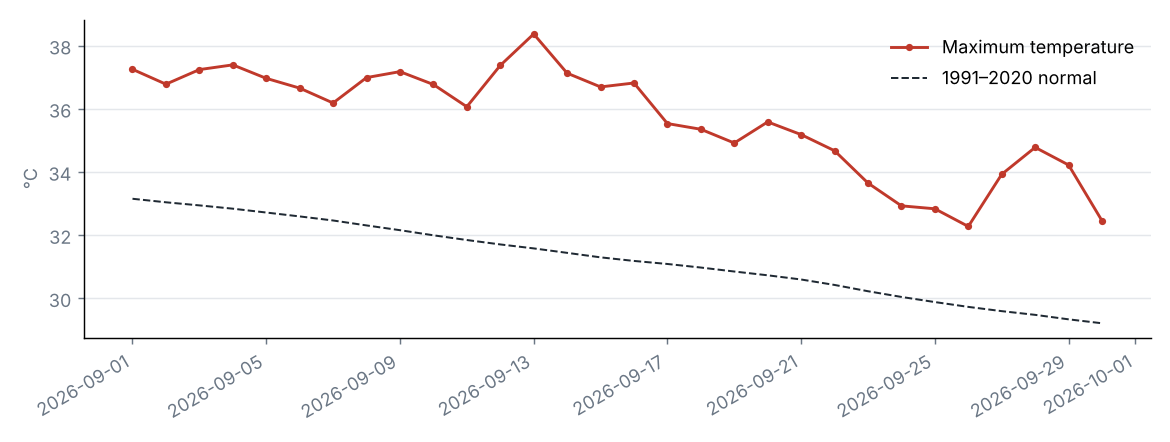
Source: NOAA NCEI
The statewide maximum temperature was 35.7 °C, 4.4 °C above the 1991–2020 average (31.2 °C), category “Extremely above normal”. It was the warmest September in the 1979–2026 series.
By region, the largest anomaly was in Low Rolling Plains (+5.8 °C) and the smallest in Upper Coast (+2.6 °C).
Source: NOAA NCEI
Source: NOAA NCEI
Minimum temperature anomaly (1991–2020)
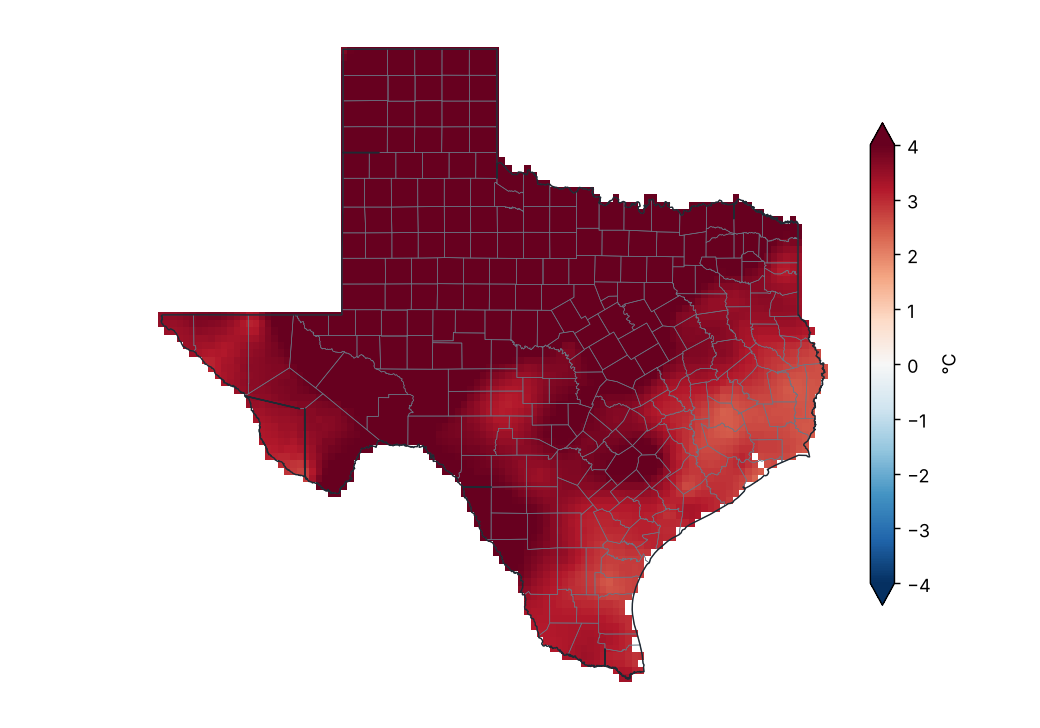
Source: NOAA NCEI
Lowest and highest monthly mean minimum temperature by region
| Region | Lowest value (°C) | Station | Highest value (°C) | Station |
|---|---|---|---|---|
| High Plains | 16.2 | Muleshoe Nwr | 23.6 | Midland Airpark |
| Low Rolling Plains | 20.8 | Memphis | 24.3 | Lake Kemp |
| North Central | 21.9 | Comanche Co City AP | 26.1 | Dallas Faa AP |
| East Texas | 20.5 | Jefferson | 24.1 | College Stn Easterwood Fld |
| Trans Pecos | 19.2 | Alpine Casparis AP | 25.1 | Castolon |
| Edwards Plateau | 20.4 | Eldorado | 25.4 | Del Rio Intl AP |
| South Central | 22.7 | Dripping Springs 6 E | 27.3 | Corpus Christi Nas |
| Upper Coast | 21.8 | Orange 9 N | 26.7 | Galveston Scholes Fld |
| Southern | 23.0 | Armstrong 4SE | 25.7 | Laredo Intl AP |
| Lower Valley | 24.5 | Harlingen Rio Grande Vly Intl | 27.5 | Edinburg 17 NNE |
Station monthly means (GHCN-Daily, ≥ 80% of days with data).
Source: NOAA NCEI
Daily statewide minimum temperature
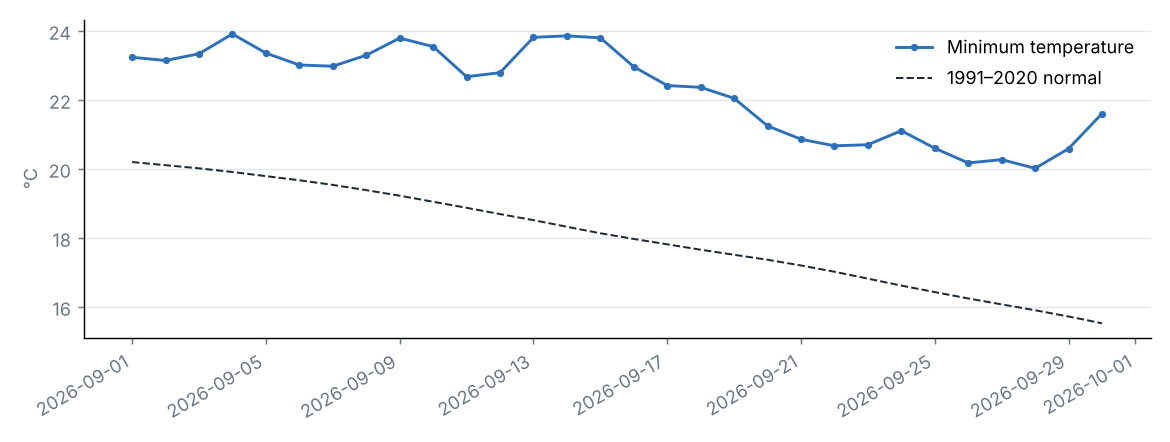
Source: NOAA NCEI
The statewide minimum temperature was 22.3 °C, 4.2 °C above the 1991–2020 average (18.0 °C), category “Extremely above normal”. It was the warmest September in the 1979–2026 series.
By region, the largest anomaly was in Low Rolling Plains (+5.5 °C) and the smallest in Upper Coast (+2.9 °C).
Source: NOAA NCEI
5 Climate extremes and records
Source: NOAA NCEI
Highest maximum temperature by county
| County | Station | Temperature (°C) | Date |
|---|---|---|---|
| San Saba | San Saba 7NW | 45.6 | 2026-09-17 |
| McMullen | Cross | 43.9 | 2026-09-20 |
| Brewster | Rio Grande Village | 43.3 | 2026-09-04 |
| Comanche | Comanche Co City AP | 43.3 | 2026-09-03 |
| Baylor | Lake Kemp | 42.8 | 2026-09-13 |
| Knox | Truscott 3 W | 42.8 | 2026-09-14 |
| Reagan | Cope Rch | 42.8 | 2026-09-04 |
| Hall | Memphis | 42.2 | 2026-09-13 |
| King | Paducah 15S | 42.2 | 2026-09-13 |
| Shackelford | Ft Griffin | 42.2 | 2026-09-04 |
| Stonewall | Aspermont | 42.2 | 2026-09-04 |
| Webb | Laredo Intl AP | 42.2 | 2026-09-03 |
| Wichita | Wichita Falls Muni AP | 42.2 | 2026-09-12 |
| Childress | Childress 2 | 41.7 | 2026-09-08 |
| Cottle | Paducah 7E | 41.7 | 2026-09-13 |
| Duval | Freer | 41.7 | 2026-09-03 |
| Hidalgo | Mcallen Miller Intl AP | 41.7 | 2026-09-10 |
| Jones | Stamford 1 | 41.7 | 2026-09-13 |
| Motley | Matador | 41.7 | 2026-09-13 |
| Reeves | Pecos Muni AP | 41.7 | 2026-09-12 |
The 20 most extreme of 172.
Source: NOAA NCEI
Lowest minimum temperature by county
| County | Station | Temperature (°C) | Date |
|---|---|---|---|
| Bailey | Muleshoe #1 | 11.1 | 2026-09-28 |
| Hutchinson | Sanford Dam | 11.1 | 2026-09-22 |
| Castro | Hart | 11.7 | 2026-09-22 |
| Parmer | Friona | 12.8 | 2026-09-28 |
| Lipscomb | Follett | 13.3 | 2026-09-22 |
| Hansford | Gruver | 13.9 | 2026-09-23 |
| Hartley | Dalhart Faa AP | 13.9 | 2026-09-22 |
| Jeff Davis | Mt Locke | 13.9 | 2026-09-29 |
| Swisher | Tulia | 13.9 | 2026-09-28 |
| Cochran | Morton | 14.4 | 2026-09-26 |
| Harrison | Marshall | 14.4 | 2026-09-25 |
| Lamb | Littlefield | 14.4 | 2026-09-28 |
| Marion | Jefferson | 14.4 | 2026-09-26 |
| Oldham | Boys Rch | 14.4 | 2026-09-22 |
| Potter | Bushland 1 WSW | 14.4 | 2026-09-28 |
| Cass | Atlanta | 15.0 | 2026-09-26 |
| Crosby | Crosbyton | 15.0 | 2026-09-20 |
| Franklin | Mt Vernon | 15.0 | 2026-09-25 |
| San Augustine | San Augustine | 15.0 | 2026-09-25 |
| Brewster | Alpine Casparis AP | 15.6 | 2026-09-28 |
The 20 most extreme of 173.
Source: NOAA NCEI
Station records broken
| Station | County | Variable | New value | Date | Previous record | Previous date |
|---|---|---|---|---|---|---|
| Abernathy | Hale | Highest maximum temperature | 40.0 | 2026-09-05 | 39.4 | 2023-09-08 |
| Abilene 6ESE | Taylor | Highest maximum temperature | 41.7 | 2026-09-04 | 41.1 | 2012-09-08 |
| Armstrong 4SE | Kenedy | Highest maximum temperature | 41.1 | 2026-09-03 | 40.6 | 2005-09-26 |
| Bushland 1 WSW | Potter | Highest 24 h rainfall | 110.7 | 2026-09-30 | 74.9 | 2014-09-06 |
| Centerville | Leon | Highest 24 h rainfall | 134.6 | 2026-09-04 | 115.3 | 1961-09-12 |
| Cope Rch | Reagan | Highest maximum temperature | 42.8 | 2026-09-04 | 42.2 | 2023-09-05 |
| Cross | McMullen | Highest maximum temperature | 43.9 | 2026-09-20 | 42.8 | 2005-09-26 |
| Denver City | Yoakum | Highest maximum temperature | 40.6 | 2026-09-13 | 40.0 | 2023-09-09 |
| Friona | Parmer | Highest 24 h rainfall | 77.7 | 2026-09-25 | 71.4 | 1999-09-16 |
| Gruver | Hansford | Highest 24 h rainfall | 101.6 | 2026-09-30 | 95.8 | 1960-09-23 |
| Matador | Motley | Highest maximum temperature | 41.7 | 2026-09-13 | 41.1 | 1977-09-27 |
| Morton | Cochran | Highest maximum temperature | 41.1 | 2026-09-13 | 40.0 | 2023-09-09 |
| Plainview Water Production | Hale | Highest 24 h rainfall | 53.8 | 2026-09-26 | 44.5 | 2007-09-07 |
| San Saba 7NW | San Saba | Highest maximum temperature | 45.6 | 2026-09-17 | 42.8 | 2000-09-05 |
| Sanford Dam | Hutchinson | Highest 24 h rainfall | 115.8 | 2026-09-30 | 91.4 | 2004-09-23 |
| Silverton | Briscoe | Highest maximum temperature | 40.0 | 2026-09-04 | 39.4 | 2000-09-11 |
| Tahoka | Lynn | Highest maximum temperature | 40.6 | 2026-09-12 | 40.0 | 1930-09-19 |
| Texline | Dallam | Highest 24 h rainfall | 79.8 | 2026-09-24 | 63.0 | 2013-09-12 |
| Vigo Park | Swisher | Highest maximum temperature | 41.1 | 2026-09-05 | 39.4 | 2023-09-08 |
| Muleshoe 19 S | Bailey | Highest maximum temperature | 39.5 | 2026-09-12 | 39.2 | 2023-09-07 |
| Laredo Intl AP | Webb | Highest maximum temperature | 42.2 | 2026-09-03 | 41.1 | 2012-09-04 |
Most extreme daily value of the period against the same period in all earlier years of record (at least 20 years; for weeks, the same calendar month).
Source: NOAA NCEI
Climate-extremes indices (statewide mean)
| Index | Description | Value | Normal | Difference | Unit |
|---|---|---|---|---|---|
| TX90p | Warm days (Tmax > 90th percentile) | 68.9 | 10.0 | 58.9 | % |
| TN90p | Warm nights (Tmin > 90th percentile) | 75.4 | 10.0 | 65.4 | % |
| TX10p | Cool days (Tmax < 10th percentile) | 0.2 | 10.0 | −9.8 | % |
| TN10p | Cold nights (Tmin < 10th percentile) | 0.0 | 10.0 | −10.0 | % |
| FD | Frost days (Tmin < 0 °C) | 0.0 | 0.0 | −0.0 | d |
| SU | Summer days (Tmax > 25 °C) | 29.8 | 27.8 | 2.0 | d |
| TR | Tropical nights (Tmin > 20 °C) | 24.6 | 11.4 | 13.2 | d |
| WSDI | Warm spell days (≥ 6 days) | 15.0 | — | — | d |
| CSDI | Cold spell days (≥ 6 days) | 0.0 | — | — | d |
| Rx1day | Maximum 1-day precipitation | 19.8 | 30.9 | −11.0 | mm |
| Rx5day | Maximum 5-day precipitation | 29.5 | 51.5 | −22.0 | mm |
| CDD | Consecutive dry days (< 1 mm) | 16.0 | 13.0 | 3.0 | d |
| CWD | Consecutive wet days (≥ 1 mm) | 2.1 | 3.2 | −1.1 | d |
Percentile indices relative to calendar-day percentiles of 1991–2020 (5-day window); counts and maxima averaged over the state's grid cells.
Source: NOAA NCEI
Heat and cold waves
| Dates | Type | Details |
|---|---|---|
| 2026-09-01 – 2026-09-18 | Heat wave | Up to 98% of the state above the 90th percentile of Tmax. Regions: High Plains, Low Rolling Plains, North Central, East Texas, Trans Pecos, Edwards Plateau, South Central, Upper Coast, Southern and Lower Valley. |
| 2026-09-20 – 2026-09-24 | Heat wave | Up to 79% of the state above the 90th percentile of Tmax. Regions: Low Rolling Plains, North Central, East Texas, Edwards Plateau, South Central, Upper Coast, Southern and Lower Valley. |
Wave: at least 3 consecutive days with at least half of the state above the 90th percentile of maximum temperature (heat) or below the 10th percentile of minimum temperature (cold). At most the 10 most intense are listed.
Source: NOAA NCEI
6 Drought
U.S. Drought Monitor, 29 September 2026
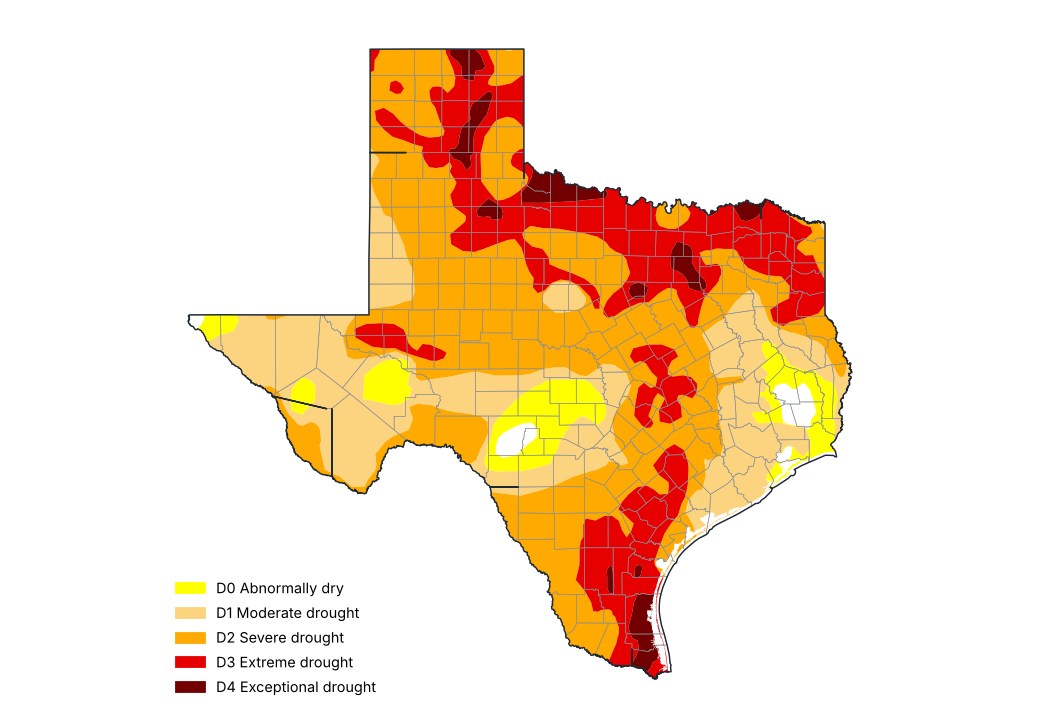
Source: National Drought Mitigation Center, USDA, NOAA
Share of the state by drought category, weekly U.S. Drought Monitor maps (%)
| Map of | None (%) | D0–D4 (%) | D1–D4 (%) | D2–D4 (%) | D3–D4 (%) | D4 (%) |
|---|---|---|---|---|---|---|
| 2026-09-01 | 8.2 | 91.8 | 69.1 | 27.4 | 11.0 | 2.6 |
| 2026-09-08 | 6.7 | 93.3 | 74.0 | 35.9 | 13.7 | 3.4 |
| 2026-09-15 | 3.5 | 96.5 | 81.0 | 42.6 | 18.0 | 3.6 |
| 2026-09-22 | 3.1 | 96.9 | 84.2 | 54.2 | 19.8 | 4.2 |
| 2026-09-29 | 1.3 | 98.7 | 91.9 | 67.8 | 26.4 | 3.6 |
Cumulative shares: D1–D4 is the share in moderate drought or worse.
Source: National Drought Mitigation Center, USDA, NOAA
Counties with the most severe drought, U.S. Drought Monitor of 29 September 2026 (% of the county)
| County | D0–D4 (%) | D1–D4 (%) | D2–D4 (%) | D3–D4 (%) | D4 (%) |
|---|---|---|---|---|---|
| Wilbarger | 100.0 | 100.0 | 100.0 | 100.0 | 82.6 |
| Kenedy | 100.0 | 100.0 | 100.0 | 100.0 | 75.6 |
| Hardeman | 100.0 | 100.0 | 100.0 | 92.9 | 70.8 |
| Willacy | 100.0 | 100.0 | 100.0 | 100.0 | 70.0 |
| Dallas | 100.0 | 100.0 | 100.0 | 100.0 | 68.1 |
| Foard | 100.0 | 100.0 | 100.0 | 97.1 | 67.2 |
| Wichita | 100.0 | 100.0 | 100.0 | 100.0 | 61.4 |
| Cameron | 100.0 | 100.0 | 100.0 | 100.0 | 59.2 |
| Hood | 100.0 | 100.0 | 100.0 | 97.5 | 58.5 |
| Gray | 100.0 | 100.0 | 100.0 | 97.2 | 55.2 |
Cumulative shares: D1–D4 is the share in moderate drought or worse.
Source: National Drought Mitigation Center, USDA, NOAA
Standardized Precipitation Index (SPI) ending September 2026
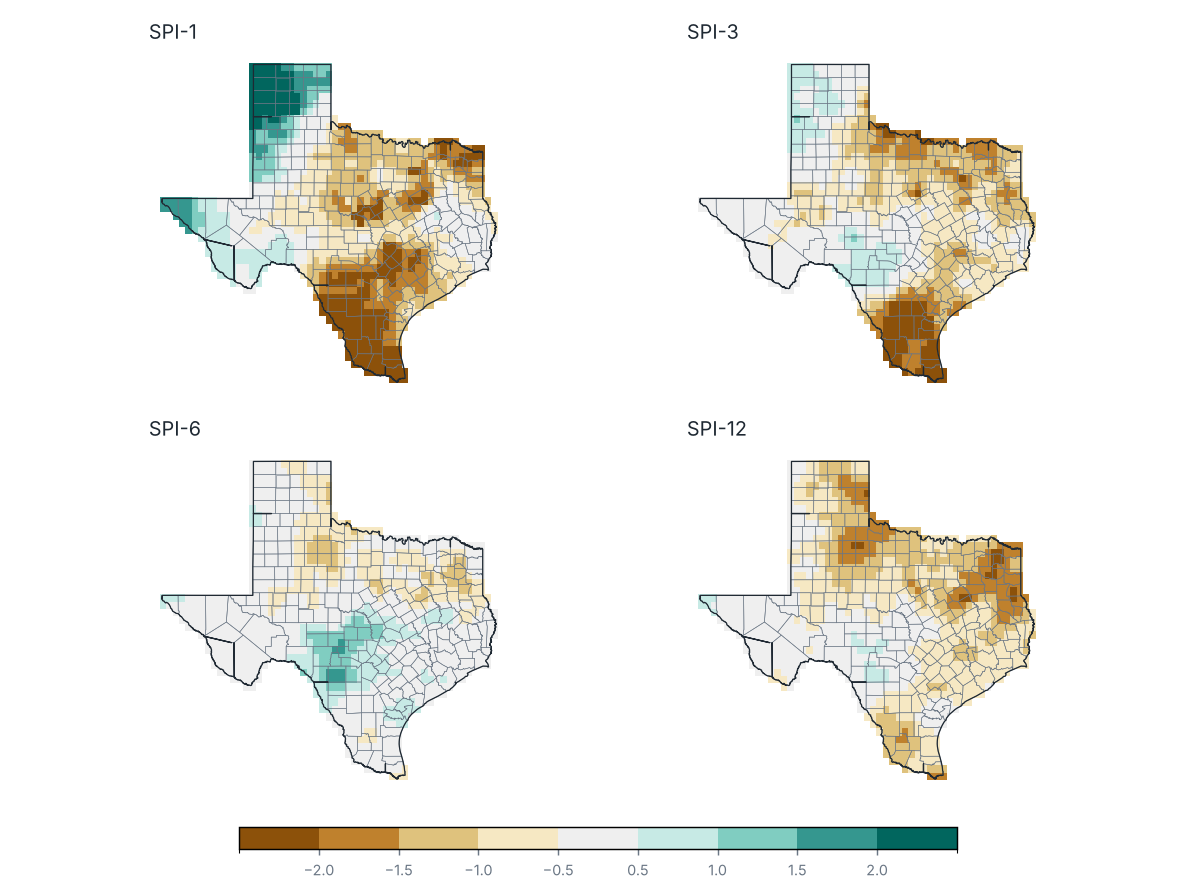
Source: NOAA NCEI
Share of the state by SPI category
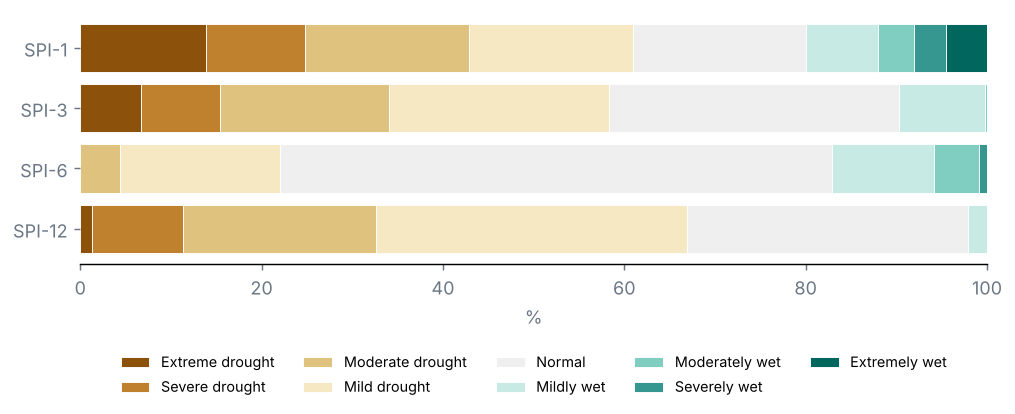
Source: NOAA NCEI
Counties with the lowest SPI-3
| County | SPI-1 | SPI-3 | SPI-6 | SPI-12 | Category |
|---|---|---|---|---|---|
| Willacy | −3.0 | −3.0 | −0.2 | −0.9 | Extreme drought |
| Cameron | −2.8 | −2.8 | −0.4 | −1.3 | Extreme drought |
| Duval | −3.0 | −2.6 | −0.3 | −1.2 | Extreme drought |
| Kenedy | −2.4 | −2.6 | −0.2 | −0.8 | Extreme drought |
| Zapata | −2.4 | −2.5 | −0.2 | −1.2 | Extreme drought |
| Jim Wells | −2.4 | −2.4 | 0.2 | −0.7 | Extreme drought |
| McMullen | −2.1 | −2.3 | 0.3 | −0.7 | Extreme drought |
| Live Oak | −1.9 | −2.2 | 0.2 | −0.7 | Extreme drought |
| Starr | −2.6 | −2.2 | −0.3 | −1.2 | Extreme drought |
| Jim Hogg | −2.9 | −2.2 | −0.5 | −1.5 | Extreme drought |
Source: NOAA NCEI
U.S. Drought Monitor, map of 29 September 2026: 92% of the state in drought (D1–D4), 68% in severe drought or worse (D2–D4) and 26% in extreme or exceptional drought (D3–D4); 99% was abnormally dry or in drought (D0–D4).
On the map of 25 August 2026, 57% of the state was in drought: a change of +34 points over the period.
Counties with the largest share in severe drought or worse (D2–D4): Cameron (100%), Camp (100%) and Clay (100%).
SPI-3 (Jul–Sep 2026): statewide mean −0.66; 34% of the state in drought (SPI ≤ −1.0) and 15% in severe or extreme drought.
Most affected counties: Willacy (−2.95), Cameron (−2.83) and Duval (−2.65).
SPI-1 (September 2026): 43% of the state in drought.
SPI-6 (Apr–Sep 2026): 4% of the state in drought.
SPI-12 (Oct 2025–Sep 2026): 33% of the state in drought.
7 Severe weather and notable events
Tracks of nearby tropical cyclones
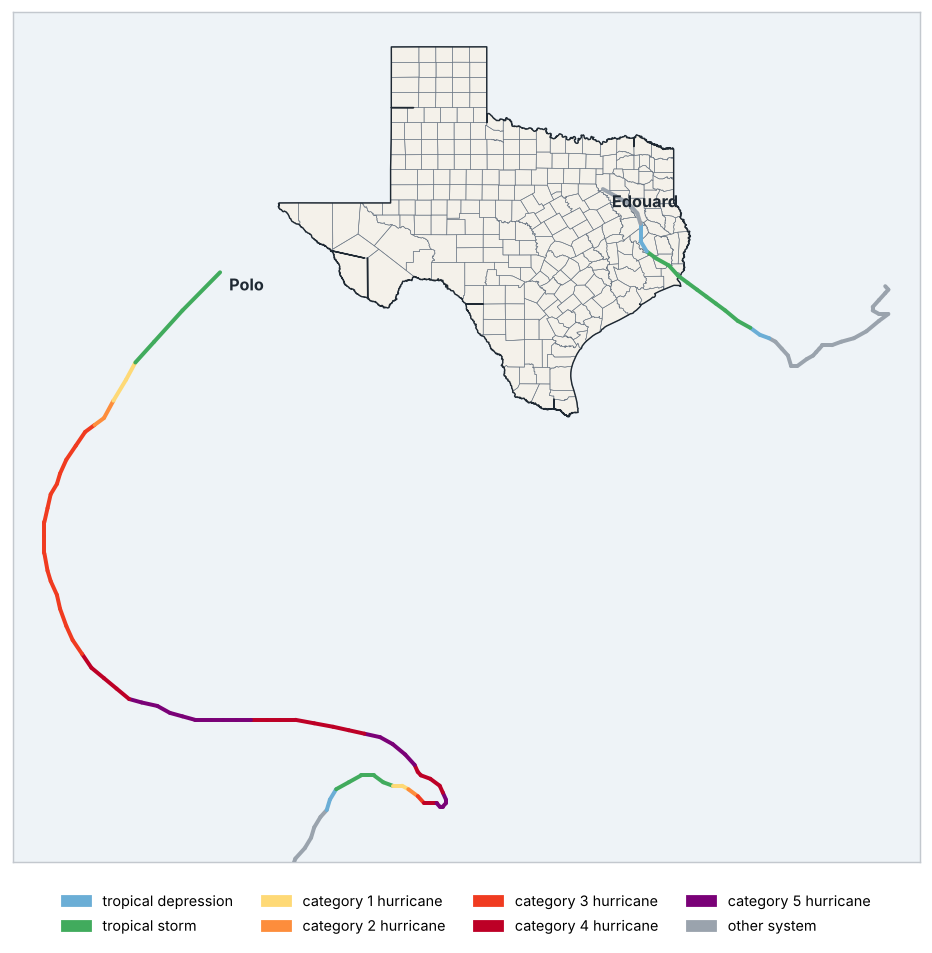
Source: NOAA NCEI
Tropical cyclones within 300 km of the state
| Name | Basin | Peak intensity | Maximum wind (km/h) | Start | End | Closest approach (km) | Landfall | Landfall intensity |
|---|---|---|---|---|---|---|---|---|
| Edouard | North Atlantic | Tropical storm | 93 | 2026-08-28 | 2026-09-03 | 0 | Jefferson | Tropical storm |
| Polo | Eastern North Pacific | Category 5 hurricane | 287 | 2026-09-17 | 2026-09-30 | 272 | — | — |
Source: NOAA NCEI
Tropical cyclones within 300 km of the state: 2 (Edouard and Polo).
Landfalls: Edouard in Jefferson (tropical storm).
9 Outlook
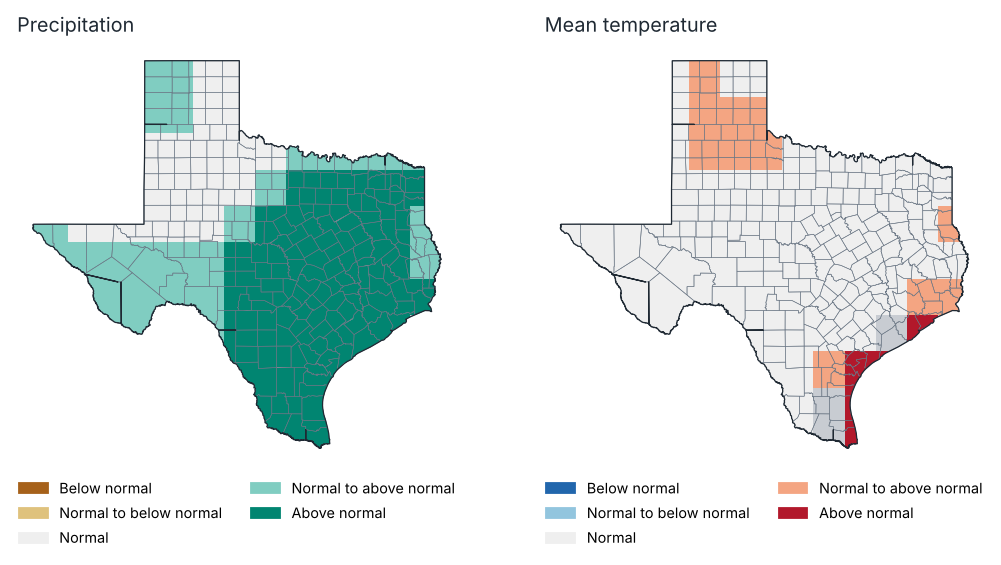
Outlook for October 2026: most likely tercile
Source: NOAA CPC
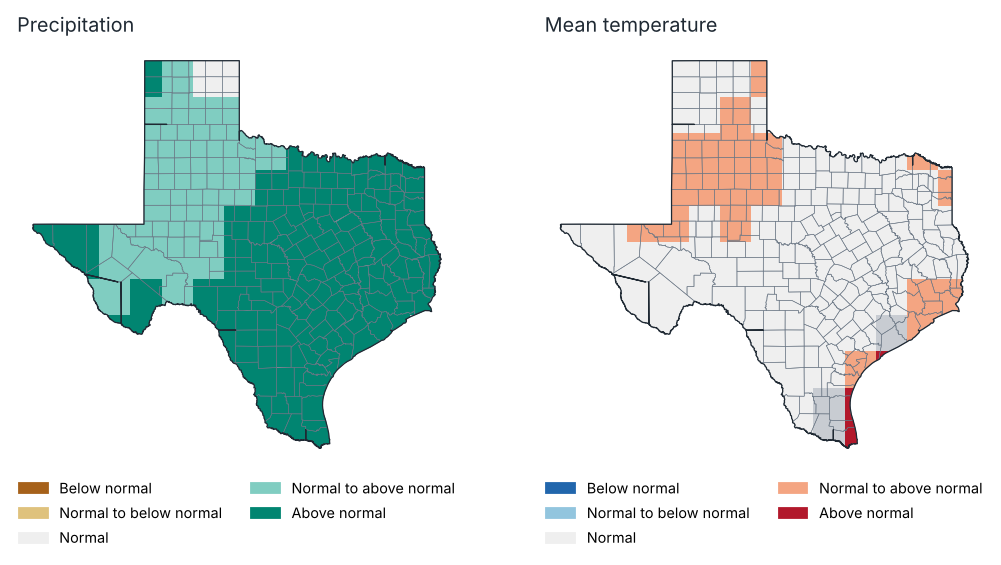
Outlook for Oct–Dec 2026: most likely tercile
Source: NOAA CPC
Probability of each tercile by region, Oct–Dec 2026 (%)
| Region | Precipitation: below | Precipitation: normal | Precipitation: above | Temp.: below | Temp.: normal | Temp.: above |
|---|---|---|---|---|---|---|
| High Plains | 25.0 | 31.0 | 44.0 | 27.0 | 32.0 | 40.0 |
| Low Rolling Plains | 22.0 | 32.0 | 46.0 | 28.0 | 31.0 | 41.0 |
| North Central | 11.0 | 27.0 | 61.0 | 31.0 | 32.0 | 37.0 |
| East Texas | 12.0 | 26.0 | 61.0 | 29.0 | 33.0 | 38.0 |
| Trans Pecos | 18.0 | 33.0 | 49.0 | 29.0 | 35.0 | 37.0 |
| Edwards Plateau | 13.0 | 31.0 | 56.0 | 30.0 | 33.0 | 37.0 |
| South Central | 7.0 | 29.0 | 64.0 | 29.0 | 32.0 | 39.0 |
| Upper Coast | 9.0 | 30.0 | 61.0 | 27.0 | 33.0 | 40.0 |
| Southern | 10.0 | 29.0 | 61.0 | 30.0 | 34.0 | 36.0 |
| Lower Valley | 12.0 | 26.0 | 62.0 | 16.0 | 32.0 | 52.0 |
Source: NOAA CPC
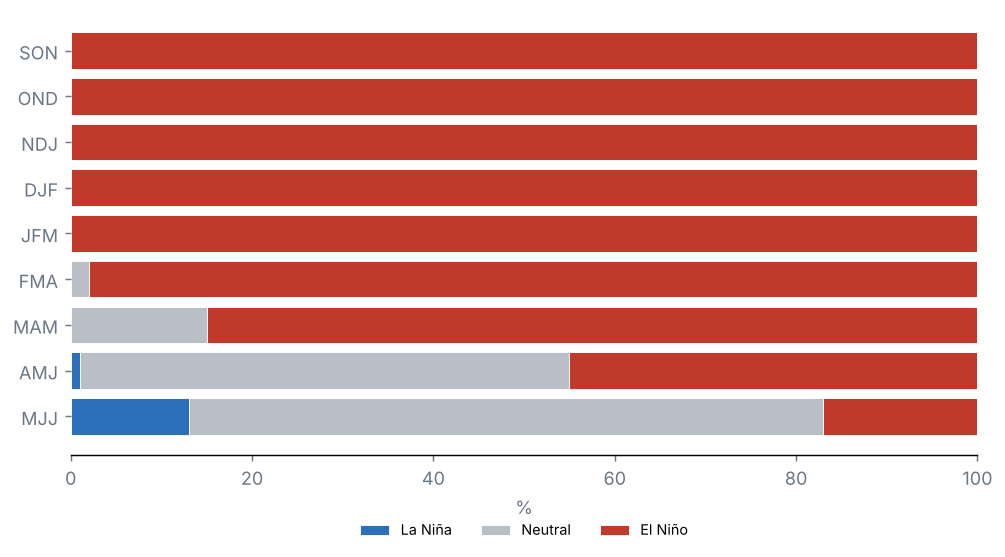
ENSO outlook: probability of each phase (%)
Source: NOAA CPC
Probabilistic outlook from the North American Multi-Model Ensemble (NMME), initialised in October 2026, relative to 1991–2020 terciles. It is not an official forecast: consult the National Weather Service and NOAA's Climate Prediction Center.
Precipitation, October 2026: above normal is favoured over 78% of the state and below normal over 0%.
Mean temperature, October 2026: above normal is favoured over 17% of the state and below normal over 0%.
Precipitation, Oct–Dec 2026: above normal is favoured over 98% of the state and below normal over 0%.
Mean temperature, Oct–Dec 2026: above normal is favoured over 23% of the state and below normal over 0%.
Probability of El Niño in the official ENSO outlook: SON 100%, OND 100%, NDJ 100% and DJF 100%.
10 Annexes
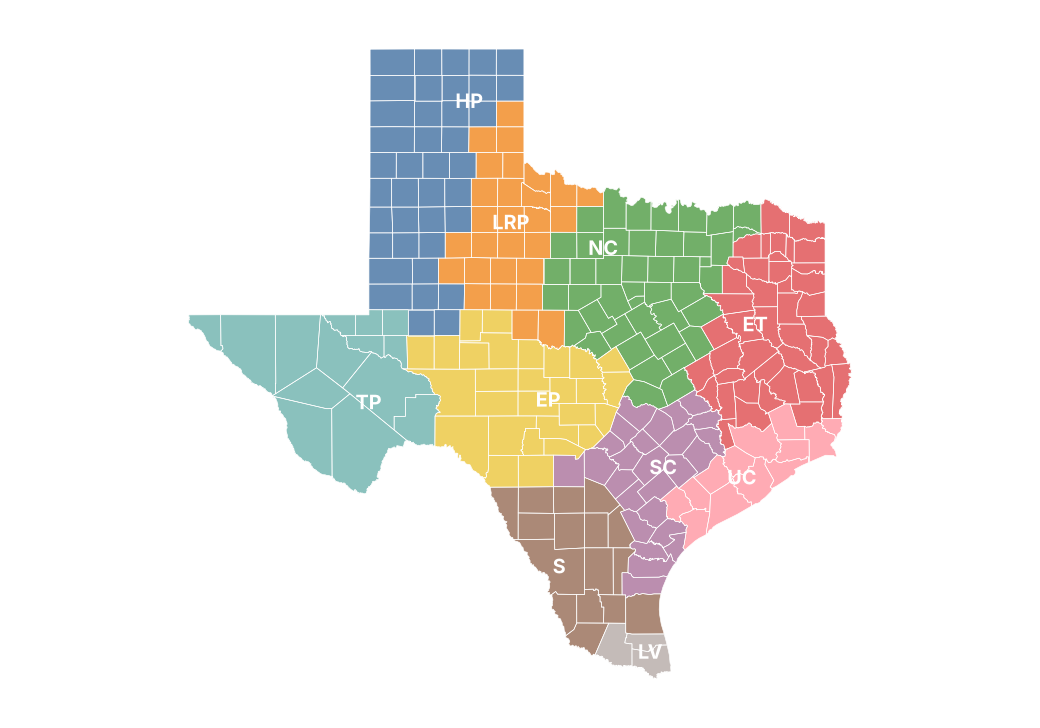
Report climate regions
Monthly precipitation by region (mm)
| Region | Jan | Feb | Mar | Apr | May | Jun | Jul | Aug | Sep |
|---|---|---|---|---|---|---|---|---|---|
| High Plains | 12.9 | 5.5 | 1.6 | 10.5 | 49.0 | 64.9 | 32.5 | 24.1 | 116.5 |
| Low Rolling Plains | 18.6 | 16.7 | 9.8 | 59.8 | 56.7 | 72.3 | 56.3 | 5.1 | 27.1 |
| North Central | 33.9 | 30.6 | 49.8 | 130.8 | 103.3 | 105.3 | 69.1 | 1.9 | 17.7 |
| East Texas | 67.8 | 38.0 | 61.3 | 118.3 | 126.6 | 141.7 | 89.0 | 15.1 | 54.6 |
| Trans Pecos | 22.0 | 3.8 | 1.1 | 20.2 | 31.5 | 39.8 | 49.5 | 14.3 | 59.1 |
| Edwards Plateau | 22.4 | 12.7 | 32.5 | 105.6 | 112.8 | 54.9 | 138.9 | 12.0 | 24.3 |
| South Central | 24.0 | 15.1 | 26.5 | 115.4 | 201.1 | 139.0 | 73.0 | 13.2 | 15.4 |
| Upper Coast | 57.6 | 36.3 | 50.6 | 85.1 | 219.5 | 191.0 | 131.5 | 18.3 | 64.9 |
| Southern | 5.9 | 2.4 | 12.6 | 67.4 | 150.6 | 104.6 | 38.6 | 7.7 | 7.9 |
| Lower Valley | 5.4 | 0.1 | 3.3 | 80.4 | 110.9 | 109.7 | 12.2 | 19.8 | 8.4 |
Source: NOAA NCEI
Monthly maximum temperature by region (°C)
| Region | Jan | Feb | Mar | Apr | May | Jun | Jul | Aug | Sep |
|---|---|---|---|---|---|---|---|---|---|
| High Plains | 12.7 | 19.9 | 26.1 | 26.7 | 28.5 | 33.9 | 35.7 | 37.5 | 33.7 |
| Low Rolling Plains | 14.2 | 21.4 | 27.4 | 27.9 | 29.6 | 34.9 | 36.5 | 39.3 | 36.5 |
| North Central | 14.8 | 22.0 | 26.3 | 25.8 | 28.3 | 33.0 | 35.6 | 38.7 | 36.7 |
| East Texas | 15.5 | 21.8 | 26.2 | 26.6 | 28.2 | 32.3 | 34.3 | 37.3 | 35.1 |
| Trans Pecos | 15.8 | 22.9 | 28.9 | 27.8 | 31.5 | 35.9 | 34.9 | 37.0 | 34.5 |
| Edwards Plateau | 16.8 | 23.2 | 27.8 | 26.3 | 29.0 | 33.6 | 34.2 | 37.6 | 36.3 |
| South Central | 19.5 | 25.0 | 28.3 | 27.9 | 29.8 | 32.8 | 34.9 | 37.5 | 36.5 |
| Upper Coast | 18.9 | 23.4 | 26.1 | 27.1 | 29.0 | 32.0 | 33.7 | 35.5 | 34.3 |
| Southern | 21.6 | 27.2 | 30.7 | 29.0 | 31.6 | 34.3 | 36.6 | 38.8 | 37.8 |
| Lower Valley | 23.1 | 27.8 | 30.6 | 29.4 | 32.1 | 34.2 | 36.4 | 37.9 | 37.2 |
Source: NOAA NCEI
Monthly mean temperature by region (°C)
| Region | Jan | Feb | Mar | Apr | May | Jun | Jul | Aug | Sep |
|---|---|---|---|---|---|---|---|---|---|
| High Plains | 4.3 | 10.6 | 16.0 | 17.9 | 20.5 | 26.5 | 28.1 | 29.2 | 26.6 |
| Low Rolling Plains | 6.2 | 12.7 | 18.2 | 20.5 | 22.3 | 28.3 | 29.6 | 31.6 | 29.4 |
| North Central | 7.5 | 14.0 | 19.1 | 20.6 | 22.4 | 27.9 | 29.7 | 31.6 | 30.0 |
| East Texas | 8.8 | 14.6 | 19.3 | 21.3 | 22.7 | 27.6 | 28.8 | 30.5 | 28.7 |
| Trans Pecos | 8.0 | 14.2 | 19.4 | 19.9 | 23.2 | 28.3 | 27.8 | 29.1 | 27.5 |
| Edwards Plateau | 8.8 | 14.6 | 19.9 | 20.9 | 22.6 | 28.0 | 28.1 | 30.0 | 29.2 |
| South Central | 12.4 | 17.7 | 21.6 | 23.2 | 24.3 | 28.4 | 29.5 | 30.8 | 30.3 |
| Upper Coast | 12.7 | 17.3 | 20.7 | 23.1 | 24.3 | 28.3 | 29.1 | 30.1 | 29.3 |
| Southern | 13.9 | 18.9 | 23.0 | 24.1 | 25.6 | 29.2 | 30.5 | 31.7 | 31.3 |
| Lower Valley | 16.8 | 20.6 | 24.2 | 25.1 | 26.9 | 29.8 | 31.0 | 31.9 | 31.6 |
Source: NOAA NCEI
Monthly minimum temperature by region (°C)
| Region | Jan | Feb | Mar | Apr | May | Jun | Jul | Aug | Sep |
|---|---|---|---|---|---|---|---|---|---|
| High Plains | −4.0 | 1.3 | 5.9 | 9.2 | 12.5 | 19.1 | 20.6 | 21.0 | 19.5 |
| Low Rolling Plains | −1.7 | 4.1 | 9.0 | 13.1 | 15.0 | 21.7 | 22.6 | 23.8 | 22.3 |
| North Central | 0.2 | 6.1 | 12.0 | 15.3 | 16.5 | 22.8 | 23.7 | 24.4 | 23.2 |
| East Texas | 2.2 | 7.4 | 12.4 | 16.0 | 17.1 | 23.0 | 23.3 | 23.6 | 22.3 |
| Trans Pecos | 0.2 | 5.5 | 9.9 | 12.0 | 14.9 | 20.7 | 20.7 | 21.2 | 20.5 |
| Edwards Plateau | 0.8 | 5.9 | 12.1 | 15.5 | 16.2 | 22.4 | 22.0 | 22.4 | 22.2 |
| South Central | 5.3 | 10.4 | 14.9 | 18.5 | 18.8 | 24.1 | 24.1 | 24.0 | 24.0 |
| Upper Coast | 6.6 | 11.2 | 15.3 | 19.1 | 19.6 | 24.6 | 24.6 | 24.7 | 24.3 |
| Southern | 6.1 | 10.7 | 15.3 | 19.2 | 19.6 | 24.1 | 24.5 | 24.5 | 24.8 |
| Lower Valley | 10.5 | 13.5 | 17.8 | 20.8 | 21.8 | 25.4 | 25.6 | 25.9 | 25.9 |
Source: NOAA NCEI
Stations used
| Id | Name | County | Latitude | Longitude | Altitude (m) | Days with data (Tmax) (%) |
|---|---|---|---|---|---|---|
| USC00410011 | Dalhart 2SE | Hartley | 36.1 | −102.5 | 1211.9 | 0.0 |
| USC00410012 | Abernathy | Hale | 33.8 | −101.9 | 1023.8 | 97.0 |
| USC00410013 | Abilene 6ESE | Taylor | 32.4 | −99.6 | 549.2 | 83.0 |
| USC00410040 | Acton Rch | Crockett | 30.3 | −101.3 | 612.6 | 0.0 |
| USC00410058 | Addison Airport | Dallas | 33.0 | −96.8 | 196.0 | 0.0 |
| USC00410071 | Adrian 6N | Oldham | 35.3 | −102.6 | 1229.0 | 0.0 |
| USC00410120 | Albany | Shackelford | 32.7 | −99.3 | 441.4 | 100.0 |
| USC00410213 | Amarillo 7ENE | Potter | 35.2 | −101.7 | 1094.2 | 0.0 |
| USC00410225 | Amistad Dam | Val Verde | 29.5 | −101.0 | 352.7 | 23.0 |
| USC00410268 | Anson | Jones | 32.8 | −99.9 | 523.3 | 73.0 |
| USC00410297 | Aquilla 1 SSE | Hill | 31.8 | −97.2 | 156.4 | 0.0 |
| USC00410345 | Armstrong 4SE | Kenedy | 26.8 | −97.7 | 7.6 | 100.0 |
| USC00410394 | Aspermont | Stonewall | 33.2 | −100.2 | 534.6 | 100.0 |
| USC00410408 | Atlanta | Cass | 33.1 | −94.2 | 96.0 | 100.0 |
| USC00410433 | Austin Great Hills | Travis | 30.4 | −97.8 | 268.2 | 100.0 |
| USC00410436 | Austwell | Refugio | 28.4 | −96.8 | 7.0 | 100.0 |
| USC00410443 | Avery 5 NNW | Red River | 33.6 | −94.8 | 118.9 | 0.0 |
| USC00410493 | Ballinger 2 NW | Runnels | 31.7 | −100.0 | 518.2 | 97.0 |
| USC00410569 | Bay City Wtr Wks | Matagorda | 29.0 | −96.0 | 15.8 | 0.0 |
| USC00410613 | Beaumont Rsch Ctr | Jefferson | 30.1 | −94.3 | 10.4 | 100.0 |
| USC00410639 | Beeville 5 NE | Bee | 28.5 | −97.7 | 77.7 | 97.0 |
| USC00410655 | Bellville 6NNE | Austin | 30.0 | −96.2 | 85.3 | 30.0 |
| USC00410690 | Benavides #2 | Duval | 27.6 | −98.4 | 115.8 | 83.0 |
| USC00410691 | Benbrook Dam | Tarrant | 32.6 | −97.4 | 240.8 | 0.0 |
| USC00410738 | Bertram 3 ENE | Burnet | 30.8 | −98.0 | 344.1 | 0.0 |
| USC00410781 | Big Spring 5NE | Howard | 32.4 | −101.4 | 791.3 | 0.0 |
| USC00410902 | Boerne | Kendall | 29.8 | −98.7 | 440.4 | 97.0 |
| USC00410923 | Bonham 3NNE | Fannin | 33.6 | −96.2 | 182.3 | 83.0 |
| USC00410984 | Bowie | Montague | 33.6 | −97.8 | 329.2 | 0.0 |
| USC00411000 | Boys Rch | Oldham | 35.5 | −102.3 | 972.6 | 97.0 |
| USC00411033 | Bravo | Oldham | 35.6 | −103.0 | 1268.0 | 30.0 |
| USC00411042 | Breckenridge | Stephens | 32.8 | −98.9 | 356.6 | 0.0 |
| USC00411048 | Brenham | Washington | 30.2 | −96.4 | 95.4 | 87.0 |
| USC00411128 | Brownfield | Terry | 33.2 | −102.3 | 1005.8 | 100.0 |
| USC00411138 | Brownwood 2NE | Brown | 31.7 | −99.0 | 472.7 | 93.0 |
| USC00411215 | Bulverde | Comal | 29.7 | −98.5 | 329.2 | 0.0 |
| USC00411239 | Burkett | Coleman | 32.0 | −99.2 | 467.6 | 0.0 |
| USC00411246 | Burleson | Johnson | 32.5 | −97.3 | 232.3 | 20.0 |
| USC00411250 | Burnet | Burnet | 30.8 | −98.2 | 391.7 | 100.0 |
| USC00411267 | Bushland 1 WSW | Potter | 35.2 | −102.1 | 1164.0 | 67.0 |
| USC00411337 | Calliham | McMullen | 28.5 | −98.4 | 66.4 | 100.0 |
| USC00411395 | Camp Verde | Kerr | 29.9 | −99.1 | 494.7 | 0.0 |
| USC00411429 | Canyon Dam | Comal | 29.9 | −98.2 | 304.8 | 100.0 |
| USC00411433 | Canyon Dam #3 | Comal | 29.9 | −98.4 | 373.4 | 0.0 |
| USC00411441 | Caprock Canyon Sp | Briscoe | 34.4 | −101.1 | 807.1 | 0.0 |
| USC00411486 | Carrizo Springs 3S | Dimmit | 28.5 | −99.9 | 186.8 | 93.0 |
| USC00411500 | Carthage | Panola | 32.2 | −94.3 | 93.0 | 93.0 |
| USC00411524 | Castolon | Brewster | 29.1 | −103.5 | 661.1 | 93.0 |
| USC00411578 | Center | Shelby | 31.8 | −94.3 | 115.8 | 0.0 |
| USC00411596 | Centerville | Leon | 31.3 | −96.0 | 97.5 | 73.0 |
| USC00411671 | Cheapside | Gonzales | 29.3 | −97.4 | 111.3 | 97.0 |
| USC00411694 | Childress 2 | Childress | 34.4 | −100.2 | 585.5 | 97.0 |
| USC00411700 | Childress 7NW | Childress | 34.5 | −100.3 | 541.9 | 0.0 |
| USC00411715 | Chisos Basin | Brewster | 29.3 | −103.3 | 1615.4 | 100.0 |
| USC00411720 | Choke Canyon Dam | Live Oak | 28.5 | −98.3 | 70.1 | 100.0 |
| USC00411736 | Christoval 2SSW | Tom Green | 31.2 | −100.5 | 641.9 | 0.0 |
| USC00411800 | Cleburne | Johnson | 32.3 | −97.4 | 238.7 | 37.0 |
| USC00411875 | Coleman | Coleman | 31.8 | −99.4 | 514.2 | 93.0 |
| USC00411880 | Coleto Creek Rsvr | Goliad | 28.7 | −97.2 | 36.0 | 90.0 |
| USC00411911 | Columbus | Colorado | 29.7 | −96.6 | 68.6 | 30.0 |
| USC00411920 | Comfort 2 | Kendall | 30.0 | −98.9 | 436.8 | 0.0 |
| USC00411921 | Commerce 4SW | Hunt | 33.2 | −95.9 | 167.6 | 0.0 |
| USC00411956 | Conroe | Montgomery | 30.3 | −95.5 | 74.7 | 80.0 |
| USC00411970 | Cooper | Delta | 33.4 | −95.7 | 148.1 | 0.0 |
| USC00411974 | Cope Rch | Reagan | 31.5 | −101.3 | 755.9 | 100.0 |
| USC00412011 | Corpus Christi Nws | Nueces | 27.8 | −97.5 | 13.4 | 100.0 |
| USC00412019 | Corsicana | Navarro | 32.1 | −96.5 | 138.1 | 100.0 |
| USC00412082 | Crane | Crane | 31.4 | −102.4 | 778.5 | 100.0 |
| USC00412086 | Cranfills Gap | Bosque | 31.8 | −97.8 | 298.7 | 0.0 |
| USC00412088 | Crawford | McLennan | 31.5 | −97.5 | 214.9 | 0.0 |
| USC00412114 | Crockett | Houston | 31.3 | −95.5 | 105.8 | 77.0 |
| USC00412121 | Crosbyton | Crosby | 33.7 | −101.3 | 930.2 | 100.0 |
| USC00412125 | Cross | McMullen | 28.6 | −98.6 | 86.9 | 97.0 |
| USC00412142 | Crowell | Foard | 34.0 | −99.7 | 454.2 | 0.0 |
| USC00412173 | Cuero | DeWitt | 29.1 | −97.3 | 65.2 | 0.0 |
| USC00412180 | Cumby | Hopkins | 33.2 | −95.8 | 189.0 | 0.0 |
| USC00412266 | Danevang 1 W | Wharton | 29.1 | −96.3 | 20.4 | 97.0 |
| USC00412408 | Denver City | Yoakum | 33.0 | −102.8 | 1091.2 | 97.0 |
| USC00412446 | Diana 2 W | Upshur | 32.7 | −94.8 | 86.6 | 100.0 |
| USC00412462 | Dime Box | Lee | 30.4 | −96.8 | 112.2 | 0.0 |
| USC00412464 | Dimmitt | Castro | 34.5 | −102.3 | 1179.6 | 100.0 |
| USC00412585 | Dripping Springs 6 E | Hays | 30.2 | −98.0 | 330.4 | 87.0 |
| USC00412621 | Dumont | King | 33.8 | −100.5 | 627.3 | 0.0 |
| USC00412741 | Eden | Concho | 31.2 | −99.9 | 624.2 | 100.0 |
| USC00412758 | Edinburg | Hidalgo | 26.3 | −98.2 | 29.3 | 100.0 |
| USC00412786 | El Campo | Wharton | 29.2 | −96.3 | 33.5 | 97.0 |
| USC00412809 | Eldorado | Schleicher | 30.9 | −100.6 | 743.7 | 97.0 |
| USC00412906 | Encinal | Webb | 28.0 | −99.4 | 166.1 | 0.0 |
| USC00413060 | Falcon Dam | Starr | 26.6 | −99.1 | 97.5 | 63.0 |
| USC00413065 | Falls City 7 WSW | Wilson | 29.0 | −98.1 | 104.5 | 0.0 |
| USC00413112 | Fedor 3SE | Lee | 30.3 | −97.0 | 130.8 | 0.0 |
| USC00413133 | Ferris | Ellis | 32.5 | −96.7 | 143.3 | 0.0 |
| USC00413156 | Fischers Store | Comal | 30.0 | −98.3 | 359.7 | 0.0 |
| USC00413195 | Flomot 2E | Motley | 34.2 | −101.0 | 720.9 | 0.0 |
| USC00413214 | Floydada | Floyd | 34.0 | −101.3 | 970.2 | 100.0 |
| USC00413215 | Floydada 9SE | Floyd | 33.9 | −101.2 | 954.0 | 0.0 |
| USC00413225 | Follett | Lipscomb | 36.4 | −100.1 | 844.3 | 100.0 |
| USC00413257 | Ft Mckavett | Menard | 30.8 | −100.1 | 661.1 | 93.0 |
| USC00413262 | Ft Davis | Jeff Davis | 30.6 | −103.9 | 1482.5 | 0.0 |
| USC00413265 | Ft Griffin | Shackelford | 32.9 | −99.2 | 388.6 | 100.0 |
| USC00413285 | Ft Worth Wsfo | Tarrant | 32.8 | −97.3 | 196.3 | 97.0 |
| USC00413291 | Ft Stockton 38SE | Pecos | 30.6 | −102.4 | 905.6 | 0.0 |
| USC00413329 | Fredericksburg | Gillespie | 30.2 | −98.9 | 513.6 | 0.0 |
| USC00413340 | Freeport 2 NW | Brazoria | 29.0 | −95.4 | 2.4 | 90.0 |
| USC00413341 | Freer | Duval | 27.9 | −98.6 | 171.3 | 93.0 |
| USC00413368 | Friona | Parmer | 34.6 | −102.7 | 1226.8 | 100.0 |
| USC00413411 | Gail | Borden | 32.8 | −101.5 | 771.1 | 47.0 |
| USC00413420 | Gainesville 5 ENE | Cooke | 33.6 | −97.1 | 265.2 | 97.0 |
| USC00413507 | Georgetown Lake | Williamson | 30.7 | −97.7 | 266.4 | 63.0 |
| USC00413568 | Glazier | Hemphill | 36.0 | −100.3 | 796.4 | 0.0 |
| USC00413579 | Glen Cove 2 NE | Coleman | 31.9 | −99.6 | 628.8 | 0.0 |
| USC00413614 | Goldthwaite 1 WSW | Mills | 31.4 | −98.6 | 459.3 | 100.0 |
| USC00413675 | Granbury 5N | Hood | 32.5 | −97.8 | 237.4 | 80.0 |
| USC00413787 | Gruver | Hansford | 36.3 | −101.4 | 966.2 | 97.0 |
| USC00413828 | Guthrie | King | 33.6 | −100.3 | 536.4 | 100.0 |
| USC00413873 | Hallettsville 2 N | Lavaca | 29.5 | −96.9 | 83.8 | 90.0 |
| USC00413877 | Hallsville 4 S | Harrison | 32.4 | −94.6 | 98.1 | 100.0 |
| USC00413943 | Harlingen | Cameron | 26.2 | −97.7 | 11.6 | 100.0 |
| USC00413954 | Harper 3ENE | Gillespie | 30.3 | −99.2 | 643.1 | 100.0 |
| USC00413972 | Hart | Castro | 34.4 | −102.1 | 1116.5 | 97.0 |
| USC00414081 | Henderson | Rusk | 32.2 | −94.8 | 140.5 | 67.0 |
| USC00414083 | Allison 5 ENE | Hemphill | 35.6 | −100.0 | 783.0 | 0.0 |
| USC00414098 | Hereford | Deaf Smith | 34.8 | −102.4 | 1164.3 | 0.0 |
| USC00414140 | Higgins | Lipscomb | 36.1 | −100.0 | 781.5 | 0.0 |
| USC00414182 | Hillsboro | Hill | 32.0 | −97.1 | 167.6 | 83.0 |
| USC00414257 | Honey Grove | Fannin | 33.6 | −95.9 | 201.8 | 0.0 |
| USC00414278 | Hords Creek Dam | Coleman | 31.8 | −99.6 | 594.1 | 100.0 |
| USC00414325 | Houston-Westbury | Harris | 29.7 | −95.4 | 14.0 | 0.0 |
| USC00414333 | Houston Nwso | Galveston | 29.5 | −95.1 | 5.8 | 100.0 |
| USC00414375 | Hunt 10 W | Kerr | 30.1 | −99.5 | 612.6 | 27.0 |
| USC00414382 | Huntsville | Walker | 30.7 | −95.5 | 150.6 | 100.0 |
| USC00414458 | Ingram 2NW | Kerr | 30.1 | −99.2 | 545.3 | 0.0 |
| USC00414505 | Itasca 5SSW | Hill | 32.1 | −97.1 | 198.7 | 0.0 |
| USC00414517 | Jacksboro | Jack | 33.2 | −98.2 | 329.5 | 70.0 |
| USC00414525 | Jacksonville | Cherokee | 32.0 | −95.3 | 170.7 | 80.0 |
| USC00414563 | Jasper | Jasper | 30.9 | −94.0 | 62.5 | 0.0 |
| USC00414570 | Jayton | Kent | 33.3 | −100.6 | 612.6 | 33.0 |
| USC00414577 | Jefferson | Marion | 32.8 | −94.4 | 64.3 | 90.0 |
| USC00414583 | Jericho | Gray | 35.2 | −100.9 | 972.3 | 0.0 |
| USC00414633 | Jonesville | Harrison | 32.5 | −94.1 | 79.2 | 0.0 |
| USC00414670 | Junction 4SSW | Kimble | 30.4 | −99.8 | 532.5 | 77.0 |
| USC00414679 | Justin | Denton | 33.1 | −97.3 | 195.1 | 0.0 |
| USC00414723 | Keene 2NNW | Johnson | 32.4 | −97.3 | 271.3 | 0.0 |
| USC00414770 | Kent 8SE | Jeff Davis | 31.0 | −104.1 | 1402.7 | 100.0 |
| USC00414782 | Kerrville 3 NNE | Kerr | 30.1 | −99.1 | 547.7 | 33.0 |
| USC00414792 | Killeen | Bell | 31.1 | −97.7 | 248.4 | 100.0 |
| USC00414810 | Kingsville | Kleberg | 27.5 | −97.8 | 17.4 | 100.0 |
| USC00414950 | Lajitas | Brewster | 29.3 | −103.8 | 732.4 | 100.0 |
| USC00414960 | Tuscola 2NW | Taylor | 32.2 | −99.8 | 611.4 | 0.0 |
| USC00414967 | Lake Alan Henry | Garza | 33.1 | −101.0 | 695.6 | 97.0 |
| USC00414976 | Lake Fk Rsvr | Wood | 32.8 | −95.5 | 127.1 | 100.0 |
| USC00414980 | Lake Tawakoni | Rains | 32.9 | −95.9 | 136.6 | 100.0 |
| USC00414982 | Lake Kemp | Baylor | 33.8 | −99.1 | 355.7 | 100.0 |
| USC00415158 | Lenorah | Martin | 32.3 | −101.9 | 867.2 | 0.0 |
| USC00415183 | Levelland | Hockley | 33.5 | −102.4 | 1071.1 | 100.0 |
| USC00415192 | Lewisville Dam | Denton | 33.1 | −97.0 | 169.5 | 0.0 |
| USC00415265 | Littlefield | Lamb | 33.9 | −102.3 | 1054.0 | 100.0 |
| USC00415303 | Loma Alta | McMullen | 28.2 | −98.5 | 132.6 | 0.0 |
| USC00415341 | Longview | Gregg | 32.5 | −94.7 | 100.6 | 100.0 |
| USC00415369 | Los Angeles 4 WSW | La Salle | 28.4 | −99.1 | 128.3 | 0.0 |
| USC00415409 | Lubbock Wfo | Lubbock | 33.5 | −101.9 | 986.0 | 97.0 |
| USC00415410 | Lubbock 9N | Lubbock | 33.7 | −101.8 | 989.1 | 0.0 |
| USC00415427 | Lufkin #2 | Angelina | 31.3 | −94.7 | 93.0 | 0.0 |
| USC00415429 | Luling | Caldwell | 29.7 | −97.7 | 121.9 | 0.0 |
| USC00415435 | Lumberton | Hardin | 30.3 | −94.2 | 13.1 | 97.0 |
| USC00415477 | Madisonville | Madison | 30.9 | −95.9 | 76.8 | 70.0 |
| USC00415590 | Marfa AP | Presidio | 30.4 | −104.0 | 1473.1 | 0.0 |
| USC00415618 | Marshall | Harrison | 32.5 | −94.3 | 92.0 | 100.0 |
| USC00415650 | Mason | Mason | 30.7 | −99.2 | 466.6 | 0.0 |
| USC00415658 | Matador | Motley | 34.0 | −100.8 | 716.6 | 100.0 |
| USC00415661 | Mathis 4 SSW | Jim Wells | 28.0 | −97.9 | 42.1 | 100.0 |
| USC00415695 | Maypearl | Ellis | 32.3 | −97.0 | 167.3 | 0.0 |
| USC00415701 | Mcallen | Hidalgo | 26.2 | −98.3 | 33.5 | 97.0 |
| USC00415707 | Mccamey | Upton | 31.1 | −102.2 | 750.1 | 0.0 |
| USC00415721 | Mccook | Hidalgo | 26.6 | −98.1 | 67.1 | 97.0 |
| USC00415742 | Medina 1NE | Bandera | 29.8 | −99.2 | 521.8 | 0.0 |
| USC00415766 | Mckinney Muni AP | Collin | 33.2 | −96.6 | 173.4 | 100.0 |
| USC00415821 | Memphis | Hall | 34.7 | −100.5 | 629.4 | 97.0 |
| USC00415893 | Wfo Midland | Midland | 31.9 | −102.2 | 875.4 | 100.0 |
| USC00415897 | Midlothian | Ellis | 32.5 | −97.0 | 230.1 | 0.0 |
| USC00415954 | Mineola | Wood | 32.6 | −95.5 | 111.9 | 100.0 |
| USC00415989 | Mobeetie 7 N | Hemphill | 35.6 | −100.4 | 868.7 | 0.0 |
| USC00416074 | Morton | Cochran | 33.7 | −102.8 | 1147.9 | 100.0 |
| USC00416104 | Mt Locke | Jeff Davis | 30.7 | −104.0 | 2069.6 | 47.0 |
| USC00416108 | Mt Pleasant | Titus | 33.2 | −95.0 | 111.3 | 97.0 |
| USC00416119 | Mt Vernon | Franklin | 33.2 | −95.2 | 136.2 | 37.0 |
| USC00416135 | Muleshoe #1 | Bailey | 34.2 | −102.7 | 1167.4 | 83.0 |
| USC00416137 | Muleshoe Nwr | Bailey | 34.0 | −102.8 | 1143.6 | 97.0 |
| USC00416147 | Munday 1W | Knox | 33.5 | −99.6 | 452.9 | 0.0 |
| USC00416177 | Nacogdoches | Nacogdoches | 31.6 | −94.6 | 132.6 | 0.0 |
| USC00416210 | Navarro Mills Dam | Navarro | 32.0 | −96.7 | 138.4 | 87.0 |
| USC00416270 | New Boston | Bowie | 33.5 | −94.4 | 105.2 | 0.0 |
| USC00416273 | New Braunfels Wfo | Guadalupe | 29.7 | −98.0 | 191.1 | 77.0 |
| USC00416335 | New Summerfield 2W | Cherokee | 32.0 | −95.1 | 113.4 | 0.0 |
| USC00416433 | Northfield | Motley | 34.3 | −100.6 | 612.6 | 0.0 |
| USC00416436 | Randall 10SE | Randall | 35.1 | −101.8 | 1075.9 | 0.0 |
| USC00416644 | Olton | Lamb | 34.2 | −102.1 | 1100.6 | 97.0 |
| USC00416680 | Orange 9 N | Orange | 30.2 | −93.7 | 7.0 | 97.0 |
| USC00416740 | Paducah 7E | Cottle | 34.0 | −100.2 | 527.3 | 97.0 |
| USC00416742 | Paducah 15S | King | 33.8 | −100.3 | 566.3 | 83.0 |
| USC00416745 | Paducah 10S | Cottle | 33.9 | −100.4 | 594.4 | 0.0 |
| USC00416776 | Pampa #2 | Gray | 35.6 | −101.0 | 960.1 | 97.0 |
| USC00416777 | Pampa 3E | Gray | 35.6 | −100.9 | 973.8 | 0.0 |
| USC00416792 | Panther Junction | Brewster | 29.3 | −103.2 | 1140.0 | 100.0 |
| USC00416959 | Persimmon Gap | Brewster | 29.7 | −103.2 | 873.3 | 100.0 |
| USC00417060 | Pitchfork Rch | Dickens | 33.6 | −100.5 | 592.8 | 0.0 |
| USC00417074 | Plains | Yoakum | 33.2 | −102.8 | 1120.1 | 93.0 |
| USC00417079 | Plainview | Hale | 34.2 | −101.7 | 1027.2 | 93.0 |
| USC00417081 | Plainview Water Production | Hale | 34.2 | −101.7 | 1051.6 | 100.0 |
| USC00417111 | Pleasanton | Atascosa | 29.0 | −98.5 | 109.1 | 70.0 |
| USC00417140 | Pt Comfort | Calhoun | 28.7 | −96.6 | 6.1 | 93.0 |
| USC00417172 | Port Arthur City | Jefferson | 29.9 | −94.0 | 1.5 | 0.0 |
| USC00417179 | Port Isabel | Cameron | 26.1 | −97.3 | 3.7 | 93.0 |
| USC00417184 | Port Mansfield | Willacy | 26.6 | −97.4 | 1.8 | 67.0 |
| USC00417206 | Post | Garza | 33.2 | −101.4 | 792.8 | 97.0 |
| USC00417215 | Poteet | Atascosa | 29.0 | −98.6 | 129.5 | 0.0 |
| USC00417243 | Prairie Mtn | Llano | 30.6 | −98.9 | 441.4 | 0.0 |
| USC00417300 | Proctor Rsvr | Comanche | 32.0 | −98.5 | 372.2 | 0.0 |
| USC00417327 | Putnam | Callahan | 32.4 | −99.2 | 494.1 | 100.0 |
| USC00417388 | Rainbow | Somervell | 32.3 | −97.7 | 197.5 | 30.0 |
| USC00417458 | Raymondville | Willacy | 26.5 | −97.8 | 9.4 | 87.0 |
| USC00417622 | Rio Grande City | Starr | 26.4 | −98.8 | 52.4 | 87.0 |
| USC00417624 | Rio Grande Village | Brewster | 29.2 | −103.0 | 566.3 | 100.0 |
| USC00417663 | Roaring Springs | Motley | 33.9 | −100.9 | 762.3 | 0.0 |
| USC00417704 | Rockport | Aransas | 28.0 | −97.1 | 3.0 | 97.0 |
| USC00417736 | Ropesville 6NNW | Hockley | 33.5 | −102.2 | 1038.1 | 0.0 |
| USC00417743 | Roscoe | Nolan | 32.4 | −100.5 | 725.4 | 97.0 |
| USC00417835 | Run Away Bay | Wise | 33.2 | −97.9 | 267.9 | 0.0 |
| USC00417841 | Rusk | Cherokee | 31.8 | −95.1 | 211.8 | 0.0 |
| USC00417873 | Sabinal | Uvalde | 29.3 | −99.5 | 290.2 | 0.0 |
| USC00417936 | Sam Rayburn Dam | Jasper | 31.1 | −94.1 | 57.6 | 47.0 |
| USC00417944 | San Angelo Wfo | Tom Green | 31.4 | −100.5 | 576.1 | 97.0 |
| USC00417951 | San Augustine | San Augustine | 31.5 | −94.1 | 89.9 | 97.0 |
| USC00417981 | San Manuel | Hidalgo | 26.6 | −98.1 | 22.9 | 97.0 |
| USC00417983 | San Marcos | Hays | 29.9 | −97.9 | 202.7 | 0.0 |
| USC00417994 | San Saba 7NW | San Saba | 31.3 | −98.8 | 405.4 | 37.0 |
| USC00418040 | Sanford Dam | Hutchinson | 35.7 | −101.5 | 894.9 | 97.0 |
| USC00418046 | Santa Anna 12SSE | Coleman | 31.6 | −99.2 | 432.2 | 0.0 |
| USC00418139 | Scotland | Archer | 33.7 | −98.5 | 293.8 | 0.0 |
| USC00418187 | Seguin 1 SSW | Guadalupe | 29.6 | −98.0 | 153.9 | 0.0 |
| USC00418221 | Seymour 3NW | Baylor | 33.6 | −99.3 | 399.6 | 0.0 |
| USC00418232 | Shallowater | Lubbock | 33.7 | −102.0 | 1006.8 | 0.0 |
| USC00418274 | Sherman | Grayson | 33.7 | −96.6 | 231.6 | 83.0 |
| USC00418323 | Silverton | Briscoe | 34.5 | −101.3 | 998.2 | 90.0 |
| USC00418373 | Slaton | Lubbock | 33.4 | −101.7 | 942.7 | 0.0 |
| USC00418433 | Snyder | Scurry | 32.7 | −100.9 | 706.8 | 100.0 |
| USC00418446 | Somerville Dam | Burleson | 30.3 | −96.5 | 80.2 | 90.0 |
| USC00418449 | Sonora | Sutton | 30.6 | −100.7 | 643.7 | 0.0 |
| USC00418477 | Southland | Garza | 33.4 | −101.6 | 920.5 | 0.0 |
| USC00418487 | S Padre Is | Cameron | 26.1 | −97.2 | 1.5 | 0.0 |
| USC00418519 | Speaks 2 | Lavaca | 29.3 | −96.7 | 43.6 | 0.0 |
| USC00418566 | Spur | Dickens | 33.5 | −100.9 | 700.1 | 100.0 |
| USC00418583 | Stamford 1 | Jones | 32.9 | −99.8 | 491.3 | 97.0 |
| USC00418728 | Sugar Land | Fort Bend | 29.6 | −95.7 | 23.5 | 100.0 |
| USC00418743 | Sulphur Springs | Hopkins | 33.1 | −95.6 | 150.9 | 93.0 |
| USC00418818 | Tahoka | Lynn | 33.2 | −101.8 | 948.5 | 97.0 |
| USC00418862 | Taylor 1NW | Williamson | 30.6 | −97.4 | 174.0 | 100.0 |
| USC00418877 | Teague Rch | Gillespie | 30.4 | −98.8 | 524.3 | 0.0 |
| USC00418942 | Texarkana | Bowie | 33.4 | −94.1 | 118.9 | 100.0 |
| USC00418964 | Texline | Dallam | 36.4 | −103.0 | 1433.8 | 0.0 |
| USC00419101 | Town Bluff Dam | Tyler | 30.8 | −94.2 | 66.8 | 100.0 |
| USC00419163 | Truscott 3 W | Knox | 33.8 | −99.9 | 478.8 | 100.0 |
| USC00419175 | Tulia | Swisher | 34.6 | −101.7 | 1051.6 | 100.0 |
| USC00419191 | Turkey | Hall | 34.4 | −100.9 | 716.9 | 100.0 |
| USC00419207 | Tyler | Smith | 32.3 | −95.3 | 154.8 | 100.0 |
| USC00419275 | Valentine 10 WSW | Presidio | 30.6 | −104.6 | 1339.3 | 0.0 |
| USC00419330 | Vega 2NW | Oldham | 35.3 | −102.5 | 1218.6 | 0.0 |
| USC00419346 | Vernon | Wilbarger | 34.2 | −99.3 | 368.8 | 0.0 |
| USC00419367 | Victoria Rgnl AP | Victoria | 28.8 | −96.9 | 31.7 | 100.0 |
| USC00419380 | Vigo Park | Swisher | 34.7 | −101.5 | 1032.1 | 100.0 |
| USC00419499 | Water Valley | Tom Green | 31.7 | −100.7 | 644.7 | 20.0 |
| USC00419532 | Weatherford | Parker | 32.7 | −97.8 | 293.2 | 57.0 |
| USC00419559 | Welder Wildlife Foundation | San Patricio | 28.1 | −97.4 | 15.2 | 77.0 |
| USC00419588 | Weslaco | Hidalgo | 26.2 | −98.0 | 22.9 | 100.0 |
| USC00419605 | W Columbia 1 ESE | Brazoria | 29.1 | −95.6 | 9.4 | 0.0 |
| USC00419649 | Wfo Brownsville | Cameron | 25.9 | −97.4 | 4.6 | 100.0 |
| USC00419711 | White Rvr Rsvr | Crosby | 33.5 | −101.1 | 734.3 | 100.0 |
| USC00419717 | Whitsett | Live Oak | 28.6 | −98.3 | 63.4 | 0.0 |
| USC00419893 | Woodson | Throckmorton | 33.0 | −99.1 | 378.6 | 0.0 |
| USC00419916 | Wright Patman Dm & Lk | Cass | 33.3 | −94.2 | 86.0 | 60.0 |
| USW00000130 | Pleasanton Muni AP | Atascosa | 28.9 | −98.5 | 131.1 | 100.0 |
| USW00000166 | Lago Vista Rusty Allen AP | Travis | 30.5 | −98.0 | 375.2 | 93.0 |
| USW00000176 | Stephens County AP | Stephens | 32.7 | −98.9 | 391.1 | 0.0 |
| USW00000177 | Castroville Muni Airport | Kendall | 29.9 | −98.8 | 235.0 | 0.0 |
| USW00000209 | Bowie Muni AP | Montague | 33.6 | −97.8 | 336.2 | 100.0 |
| USW00000225 | Horseshoe Bay Resort AP | Llano | 30.5 | −98.4 | 333.1 | 100.0 |
| USW00000229 | Lampasas AP | Lampasas | 31.1 | −98.2 | 370.0 | 0.0 |
| USW00000230 | Austin Executive AP | Travis | 30.4 | −97.6 | 188.1 | 0.0 |
| USW00000263 | Boerne Stage Field AP | Bexar | 29.7 | −98.7 | 422.1 | 0.0 |
| USW00000270 | Faith Rch AP | Dimmit | 28.2 | −100.0 | 236.2 | 0.0 |
| USW00000349 | Andrews County AP | Andrews | 32.3 | −102.5 | 967.1 | 0.0 |
| USW00000351 | Cameron Muni AP | Milam | 30.9 | −97.0 | 123.1 | 0.0 |
| USW00000357 | Hamilton Muni AP | Hamilton | 31.7 | −98.1 | 396.2 | 0.0 |
| USW00000362 | Gatesville Muni AP | Coryell | 31.4 | −97.8 | 276.1 | 100.0 |
| USW00000448 | Ralph M Hall Rockwall Muni AP | Rockwall | 32.9 | −96.4 | 175.3 | 0.0 |
| USW00000461 | Mexia Limestone County AP | Limestone | 31.6 | −96.5 | 166.1 | 0.0 |
| USW00000471 | Presidio Lely Intl AP | Presidio | 29.6 | −104.4 | 896.1 | 0.0 |
| USW00000477 | Roger M Dreyer Mem AP | Gonzales | 29.5 | −97.5 | 108.2 | 0.0 |
| USW00003024 | Borger Hutchinson Co AP | Hutchinson | 35.7 | −101.4 | 926.9 | 100.0 |
| USW00003031 | Odessa Schlemeyer Fld | Ector | 31.9 | −102.4 | 909.2 | 100.0 |
| USW00003032 | Dryden Terrell Co AP | Terrell | 30.0 | −102.2 | 701.0 | 100.0 |
| USW00003044 | Big Spring Wrinkle AP | Howard | 32.2 | −101.5 | 784.3 | 100.0 |
| USW00003047 | Monahans 6 ENE | Ward | 31.6 | −102.8 | 830.3 | 100.0 |
| USW00003049 | Alpine Casparis AP | Brewster | 30.4 | −103.7 | 1375.6 | 100.0 |
| USW00003050 | Snyder Winston Fld AP | Scurry | 32.7 | −101.0 | 740.7 | 100.0 |
| USW00003054 | Muleshoe 19 S | Bailey | 34.0 | −102.8 | 1140.6 | 100.0 |
| USW00003056 | Gaines Co AP | Gaines | 32.7 | −102.7 | 1010.4 | 100.0 |
| USW00003058 | Pecos Muni AP | Reeves | 31.4 | −103.5 | 796.4 | 100.0 |
| USW00003071 | Midland Airpark | Midland | 32.0 | −102.1 | 854.4 | 100.0 |
| USW00003072 | Bronte 11 NNE | Coke | 32.0 | −100.2 | 608.7 | 100.0 |
| USW00003901 | Longview E Tx Rgnl AP | Gregg | 32.4 | −94.7 | 107.3 | 100.0 |
| USW00003902 | Robert Gray Aaf | Bell | 31.1 | −97.8 | 309.4 | 100.0 |
| USW00003904 | College Stn Easterwood Fld | Brazos | 30.6 | −96.4 | 96.0 | 100.0 |
| USW00003927 | Dal-Ftw Wscmo AP | Dallas | 32.9 | −97.0 | 165.8 | 100.0 |
| USW00003933 | Ft Hood | Bell | 31.1 | −97.7 | 281.6 | 100.0 |
| USW00003951 | Longview Wsmo | Rusk | 32.4 | −94.7 | 124.1 | 87.0 |
| USW00003969 | Stephenville Clark Fld | Erath | 32.2 | −98.2 | 402.6 | 100.0 |
| USW00003971 | Dallas Redbird AP | Dallas | 32.7 | −96.9 | 200.6 | 100.0 |
| USW00003985 | Fort Worth Spinks AP | Tarrant | 32.6 | −97.3 | 213.4 | 0.0 |
| USW00003991 | Denton Municpal AP | Denton | 33.2 | −97.2 | 194.8 | 100.0 |
| USW00003999 | Burnet Muni AP | Burnet | 30.7 | −98.2 | 386.2 | 100.0 |
| USW00012904 | Harlingen Rio Grande Vly Intl | Cameron | 26.2 | −97.7 | 9.4 | 100.0 |
| USW00012906 | Houston Ellington Afb | Harris | 29.6 | −95.2 | 11.9 | 100.0 |
| USW00012907 | Laredo Intl AP | Webb | 27.5 | −99.5 | 150.6 | 100.0 |
| USW00012909 | San Antonio Kelly Afb | Bexar | 29.4 | −98.6 | 207.9 | 100.0 |
| USW00012911 | Randolph Afb | Bexar | 29.5 | −98.3 | 221.9 | 100.0 |
| USW00012912 | Victoria Rgnl AP | Victoria | 28.9 | −96.9 | 33.8 | 100.0 |
| USW00012917 | Port Arthur SE Tx Rgnl AP | Jefferson | 30.0 | −94.0 | 4.0 | 97.0 |
| USW00012918 | Houston William P Hobby AP | Harris | 29.6 | −95.3 | 13.1 | 100.0 |
| USW00012919 | Brownsville | Cameron | 25.9 | −97.4 | 26.8 | 100.0 |
| USW00012921 | San Antonio Intl AP | Bexar | 29.5 | −98.5 | 243.5 | 100.0 |
| USW00012923 | Galveston Scholes Fld | Galveston | 29.3 | −94.9 | 1.5 | 100.0 |
| USW00012924 | Corpus Christi | Nueces | 27.8 | −97.5 | 43.3 | 100.0 |
| USW00012926 | Corpus Christi Nas | Nueces | 27.7 | −97.3 | 4.6 | 100.0 |
| USW00012928 | Kingsville Naas | Kleberg | 27.5 | −97.8 | 13.4 | 100.0 |
| USW00012932 | Alice Intl AP | Jim Wells | 27.7 | −98.0 | 51.8 | 100.0 |
| USW00012935 | Palacios Muni AP | Matagorda | 28.7 | −96.3 | 3.0 | 100.0 |
| USW00012946 | Corpus Christi Cabaniss Fld | Nueces | 27.7 | −97.4 | 9.1 | 27.0 |
| USW00012947 | Cotulla La Salle Co AP | La Salle | 28.5 | −99.2 | 143.9 | 100.0 |
| USW00012953 | Wharton Rgnl AP | Wharton | 29.3 | −96.0 | 30.5 | 100.0 |
| USW00012957 | Port Isabel Cameron Co AP | Cameron | 26.2 | −97.3 | 5.2 | 100.0 |
| USW00012959 | Mcallen Miller Intl AP | Hidalgo | 26.2 | −98.2 | 30.2 | 100.0 |
| USW00012960 | Houston Intercontinental AP | Harris | 30.0 | −95.4 | 27.4 | 100.0 |
| USW00012961 | Kerrville Muni AP | Kerr | 30.0 | −99.1 | 492.9 | 73.0 |
| USW00012962 | Hondo Muni AP | Medina | 29.4 | −99.2 | 281.0 | 100.0 |
| USW00012970 | San Antonio Stinson Muni AP | Bexar | 29.3 | −98.5 | 173.1 | 100.0 |
| USW00012971 | Austin San Antonio | Guadalupe | 29.7 | −98.0 | 233.8 | 100.0 |
| USW00012972 | Rockport Aransas Co AP | Aransas | 28.1 | −97.0 | 7.3 | 100.0 |
| USW00012974 | Orange Grove | Jim Wells | 27.9 | −98.0 | 78.3 | 0.0 |
| USW00012975 | Houston Clover Fld | Brazoria | 29.5 | −95.2 | 11.9 | 100.0 |
| USW00012976 | Angleton Lk Jackson Brazoria C | Brazoria | 29.1 | −95.5 | 7.6 | 100.0 |
| USW00012977 | Houston Sugarland Mem | Fort Bend | 29.6 | −95.7 | 23.5 | 100.0 |
| USW00012978 | Fayette Rgnl AP | Fayette | 29.9 | −97.0 | 98.8 | 100.0 |
| USW00012979 | San Marcos Muni AP | Caldwell | 29.9 | −97.9 | 182.0 | 0.0 |
| USW00012981 | Bay City Muni AP | Matagorda | 29.0 | −95.9 | 13.7 | 70.0 |
| USW00012985 | Garner Fld AP | Uvalde | 29.2 | −99.7 | 287.1 | 100.0 |
| USW00012987 | Edinburg 17 NNE | Hidalgo | 26.5 | −98.1 | 19.5 | 100.0 |
| USW00013904 | Austin Bergstrom Intl AP | Travis | 30.2 | −97.7 | 146.6 | 100.0 |
| USW00013910 | Abilene Dyess Afb | Taylor | 32.4 | −99.8 | 545.0 | 100.0 |
| USW00013911 | Ft Worth Nas | Tarrant | 32.8 | −97.5 | 185.3 | 100.0 |
| USW00013926 | Greenville Muni AP Majors Fld | Hunt | 33.1 | −96.1 | 163.1 | 73.0 |
| USW00013928 | Waco J Connally Afb | McLennan | 31.6 | −97.1 | 153.0 | 100.0 |
| USW00013958 | Austin-Camp Mabry | Travis | 30.3 | −97.8 | 204.2 | 100.0 |
| USW00013959 | Waco Rgnl AP | McLennan | 31.6 | −97.2 | 151.8 | 100.0 |
| USW00013960 | Dallas Faa AP | Dallas | 32.8 | −96.8 | 147.5 | 100.0 |
| USW00013961 | Ft Worth Meacham Fld | Tarrant | 32.8 | −97.4 | 213.7 | 100.0 |
| USW00013962 | Abilene Rgnl AP | Taylor | 32.4 | −99.7 | 544.7 | 100.0 |
| USW00013966 | Wichita Falls Muni AP | Wichita | 34.0 | −98.5 | 308.8 | 100.0 |
| USW00013972 | Tyler Pounds Fld | Smith | 32.4 | −95.4 | 159.4 | 97.0 |
| USW00013973 | Junction Kimble Co AP | Kimble | 30.5 | −99.8 | 521.5 | 100.0 |
| USW00022001 | Del Rio Laughlin Afb | Val Verde | 29.4 | −100.8 | 329.8 | 100.0 |
| USW00022010 | Del Rio Intl AP | Val Verde | 29.4 | −100.9 | 305.7 | 93.0 |
| USW00022016 | Panther Junction 2 N | Brewster | 29.3 | −103.2 | 1065.0 | 100.0 |
| USW00023007 | Childress Muni AP | Childress | 34.4 | −100.3 | 594.1 | 100.0 |
| USW00023019 | Biggs Afb | El Paso | 31.8 | −106.4 | 1196.0 | 100.0 |
| USW00023023 | Midland Odessa | Midland | 31.9 | −102.2 | 902.8 | 100.0 |
| USW00023034 | San Angelo | Tom Green | 31.4 | −100.5 | 610.8 | 100.0 |
| USW00023040 | Wink Faa AP | Winkler | 31.8 | −103.2 | 858.3 | 100.0 |
| USW00023042 | Lubbock | Lubbock | 33.7 | −101.8 | 1029.6 | 100.0 |
| USW00023044 | El Paso Intl AP | El Paso | 31.8 | −106.4 | 1202.1 | 100.0 |
| USW00023047 | Amarillo | Potter | 35.2 | −101.7 | 1128.7 | 100.0 |
| USW00023072 | Clarendon | Donley | 34.9 | −100.9 | 823.0 | 0.0 |
| USW00023091 | Ft Stockton Pecos Co AP | Pecos | 30.9 | −102.9 | 917.8 | 100.0 |
| USW00023906 | Port Aransas 32 NNE | Aransas | 28.3 | −96.8 | 4.6 | 100.0 |
| USW00023907 | Austin 33 NW | Burnet | 30.6 | −98.1 | 414.8 | 100.0 |
| USW00053902 | Conroe Montgomery Co AP | Montgomery | 30.4 | −95.4 | 69.5 | 100.0 |
| USW00053903 | Huntsville Muni AP | Walker | 30.7 | −95.6 | 105.5 | 100.0 |
| USW00053907 | Arlington Muni AP | Tarrant | 32.7 | −97.1 | 179.8 | 100.0 |
| USW00053909 | Ft Worth Alliance AP | Denton | 33.0 | −97.3 | 215.5 | 100.0 |
| USW00053910 | Houston Hooks Mem AP | Harris | 30.1 | −95.6 | 46.6 | 100.0 |
| USW00053911 | Terrell Muni AP | Kaufman | 32.7 | −96.3 | 143.0 | 100.0 |
| USW00053912 | Corsicana Campbell Fld | Navarro | 32.0 | −96.4 | 135.0 | 100.0 |
| USW00053914 | Mckinney Muni AP | Collin | 33.2 | −96.6 | 173.4 | 100.0 |
| USW00053928 | Brenham Muni AP | Washington | 30.2 | −96.4 | 93.9 | 100.0 |
| USW00053942 | Georgetown Muni AP | Williamson | 30.7 | −97.7 | 239.9 | 0.0 |
| USW00053948 | Nacogdoches Mangham AP | Nacogdoches | 31.6 | −94.7 | 108.2 | 0.0 |
| USW00053952 | Waco Mcgregor Exec AP | McLennan | 31.5 | −97.3 | 180.4 | 100.0 |
| USW00053964 | Decatur Muni AP | Wise | 33.3 | −97.6 | 319.1 | 100.0 |
| USW00053965 | Graham Muni AP | Young | 33.1 | −98.6 | 342.3 | 100.0 |
| USW00053966 | Mid Way Rgnl AP | Ellis | 32.5 | −96.9 | 228.3 | 100.0 |
| USW00053967 | Grayson Co AP | Grayson | 33.7 | −96.7 | 228.3 | 100.0 |
| USW00053968 | Palestine 6 WNW | Anderson | 31.8 | −95.7 | 116.7 | 100.0 |
| USW00053970 | Mesquite Metro AP | Dallas | 32.7 | −96.5 | 136.2 | 0.0 |
| USW00053972 | Hillsboro Muni AP | Hill | 32.1 | −97.1 | 208.8 | 100.0 |
| USW00053973 | Hearne Muni AP | Robertson | 30.9 | −96.6 | 86.9 | 87.0 |
| USW00053976 | Bridgeport Muni AP | Wise | 33.2 | −97.8 | 259.4 | 100.0 |
| USW00053977 | Granbury Muni AP | Hood | 32.4 | −97.8 | 237.1 | 100.0 |
| USW00053979 | Giddings Lee Co AP | Lee | 30.2 | −97.0 | 147.8 | 100.0 |
| USW00053981 | Cleburne Muni AP | Johnson | 32.4 | −97.4 | 260.3 | 100.0 |
| USW00053983 | Llano Muni AP | Llano | 30.8 | −98.7 | 335.9 | 100.0 |
| USW00053984 | Grand Prairie Muni AP | Tarrant | 32.7 | −97.0 | 179.5 | 0.0 |
| USW00053997 | Comanche Co City AP | Comanche | 31.9 | −98.6 | 423.1 | 93.0 |
| USW00063904 | Taylor Muni AP | Williamson | 30.6 | −97.4 | 182.9 | 0.0 |
| USW00093042 | Dalhart Faa AP | Hartley | 36.0 | −102.5 | 1215.5 | 100.0 |
| USW00093929 | Gainesville Muni AP | Cooke | 33.7 | −97.2 | 255.7 | 100.0 |
| USW00093937 | Sulphur Springs Muni AP | Hopkins | 33.2 | −95.6 | 149.0 | 0.0 |
| USW00093947 | Fredericksburg Gillespie Co AP | Gillespie | 30.2 | −98.9 | 516.6 | 100.0 |
| USW00093955 | Paris | Lamar | 33.6 | −95.5 | 166.7 | 77.0 |
| USW00093983 | Palestine Muni AP | Anderson | 31.8 | −95.7 | 128.9 | 100.0 |
| USW00093984 | Temple Draughton Mil | Bell | 31.1 | −97.4 | 207.9 | 97.0 |
| USW00093985 | Mineral Wells AP | Parker | 32.8 | −98.1 | 287.1 | 100.0 |
| USW00093987 | Lufkin Angelina Co AP | Angelina | 31.2 | −94.8 | 87.2 | 100.0 |
Source: NOAA NCEI
11 Glossary, methodology and sources
Anomaly: difference between the observed value and its 1991–2020 normal. Percent of normal: observed total divided by the normal, times 100. Station record: most extreme daily value for the same month in all earlier years of record (at least 20 years).
Temperature: NOAA nClimGrid-Daily. Precipitation: NOAA nClimGrid-Daily. nClimGrid-Daily is the grid behind NOAA's official statewide values; it is averaged here from 1/24° to 1/8° (about 12 km). Mean temperature is (Tmax + Tmin)/2. Statewide, regional and county averages are weighted by the area of each grid cell inside each polygon. Temperature maps, frost days and annex tables are given by region; regions are NOAA NCEI climate divisions, with each county in the division of its centroid. Recent weeks use NCEI's preliminary file of the month; such reports are marked preliminary and updated when the final file is published. Normals refer to 1991-2020; ranks compare values rounded to one decimal. Stations: GHCN-Daily (NOAA NCEI) cooperative and first-order stations; values flagged by its quality control are discarded, as are daily values more than 5 robust standard deviations from the station median and variables whose monthly anomaly differs by more than 3 °C from the gridded analysis. Period means require at least 80% of days with data and station normals at least 20 complete years. This report is generated automatically and does not replace official information from the National Weather Service or the state climatologist.
| Source | Product | License | Citation |
|---|---|---|---|
| NOAA CPC | Official ENSO probabilities | Public domain (NOAA) | — |
| NOAA CPC | ONI, Niño-region SST indices (OISST v2.1), NAO and AO | Public domain (NOAA) | NOAA Climate Prediction Center climate indices. |
| NOAA NCEI / PSL | Extended Reconstructed SST v5 (ERSST v5), 2° | Public domain (NOAA) | Huang et al. (2017), J. Climate, doi:10.1175/JCLI-D-16-0836.1 |
| GDACS | Global Disaster Alert and Coordination System event list | See provider terms | — |
| NOAA NCEI | GHCN-Daily | Public domain (NOAA) | Menne et al. (2012), J. Atmos. Oceanic Technol., doi:10.1175/JTECH-D-11-00103.1 |
| NOAA NCEI | IBTrACS v04r01 tropical-cyclone best tracks | Public domain (NOAA) | Knapp et al. (2010), Bull. Amer. Meteor. Soc., doi:10.1175/2009BAMS2755.1 |
| NOAA NCEI | Pacific Decadal Oscillation index (ERSST v5) | Public domain (NOAA) | — |
| NOAA NCEI | nClimGrid-Daily, contiguous United States (1/24°, averaged here to 1/8°) | Public domain (NOAA) | Durre, I., et al. (2022). NOAA's nClimGrid-Daily Version 1. NOAA National Centers for Environmental Information. doi:10.25921/c4gt-r169 |
| NOAA CPC | North American Multi-Model Ensemble (NMME) tercile probabilities, 1° | Public domain (NOAA) | Kirtman et al. (2014), Bull. Amer. Meteor. Soc., doi:10.1175/BAMS-D-12-00050.1 |
| NOAA PSL | Real-time OLR MJO Index (ROMI) | Public domain (NOAA) | Kiladis et al. (2014), Mon. Wea. Rev., doi:10.1175/MWR-D-13-00301.1 |
| National Drought Mitigation Center, USDA, NOAA | U.S. Drought Monitor, weekly maps and area statistics | Free to use with credit (NDMC) | The U.S. Drought Monitor is jointly produced by the National Drought Mitigation Center at the University of Nebraska-Lincoln, the United States Department of Agriculture and the National Oceanic and Atmospheric Administration. Map courtesy of NDMC. |
| US Census Bureau TIGERweb | US Census Bureau, TIGERweb counties (generalised) | Public domain (US Government work) | — |
Generated by ClimaBulletin (climabulletin.org), open source. Questions and comments: [email protected].