Carolina del Sur · Anual
Año 2025
Descargas
1 Mensajes clave y sinopsis climática
Fuente: NOAA CPC / PSL, UCSB Climate Hazards Center
Fuente: NOAA CPC / PSL, UCSB Climate Hazards Center
2 Condiciones globales y forzantes climáticos
Anomalía de la temperatura superficial del mar, Año 2025 (°C, 1991–2020)
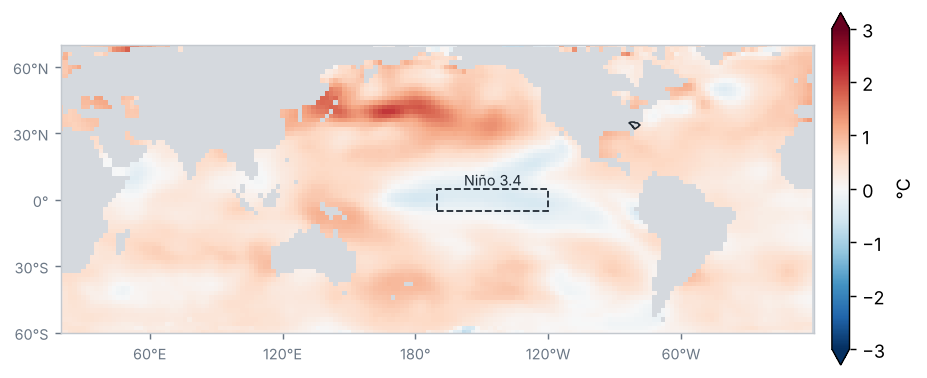
Fuente: NOAA NCEI / PSL
Anomalía de temperatura del mar en las regiones Niño (°C)
| Región | Anomalía (°C) | Cambio respecto al periodo anterior (°C) |
|---|---|---|
| Niño 1+2 | 0.2 | 0.3 |
| Niño 3 | −0.2 | −0.5 |
| Niño 3.4 | −0.3 | −0.7 |
| Niño 4 | −0.2 | −0.8 |
Promedio de los meses del periodo (OISST v2.1)
Fuente: NOAA CPC
Condiciones de La Niña de intensidad débil: el Índice Oceánico de El Niño (ONI) de OND 2025 fue de −0.6 °C.
Fuente: NOAA CPC
Anomalía mensual de Niño 3.4, últimos 24 meses (°C)
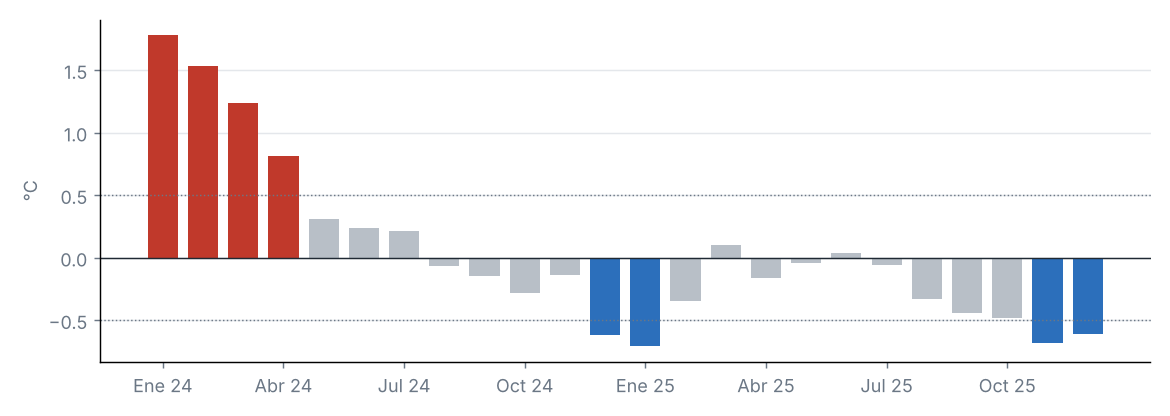
Fuente: NOAA CPC
Índices de teleconexión
| Índice | Valor | Fase |
|---|---|---|
| NAO | 0.0 | Neutral |
| AO | 0.2 | Neutral |
| PDO | −2.0 | Negativa |
Oscilación del Atlántico Norte (NAO); Oscilación Ártica (AO); Oscilación Decadal del Pacífico (PDO).
Fuente: NOAA CPC, NOAA NCEI
La anomalía de Niño 3.4 fue de −0.31 °C (−0.71 °C respecto al periodo anterior).
Otros índices: NAO +0.02 (fase neutral); AO +0.20 (fase neutral); PDO −1.99 (fase negativa).
3 Precipitación
Fuente: UCSB Climate Hazards Center
Precipitación acumulada
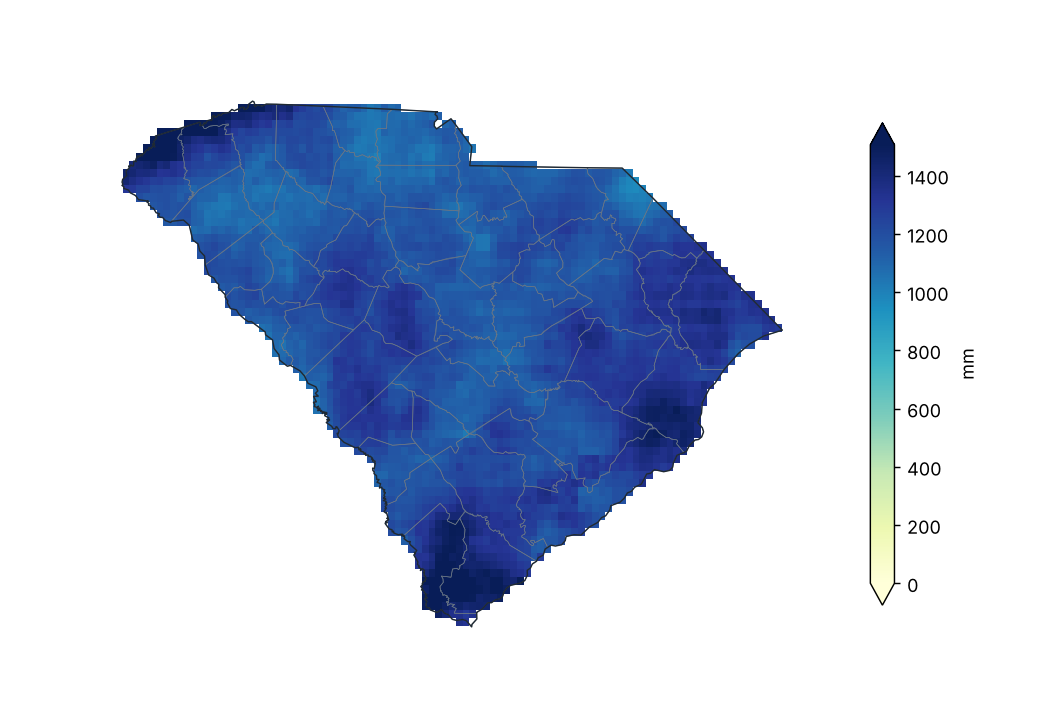
Fuente: UCSB Climate Hazards Center
Porcentaje de la precipitación normal (1991–2020)
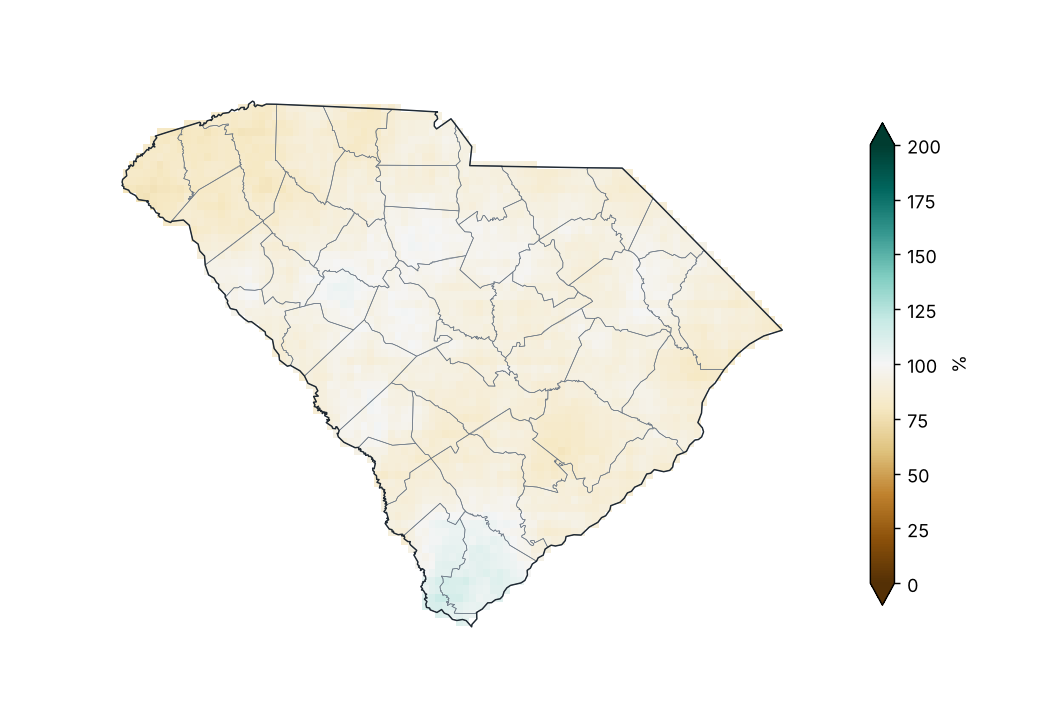
Fuente: UCSB Climate Hazards Center
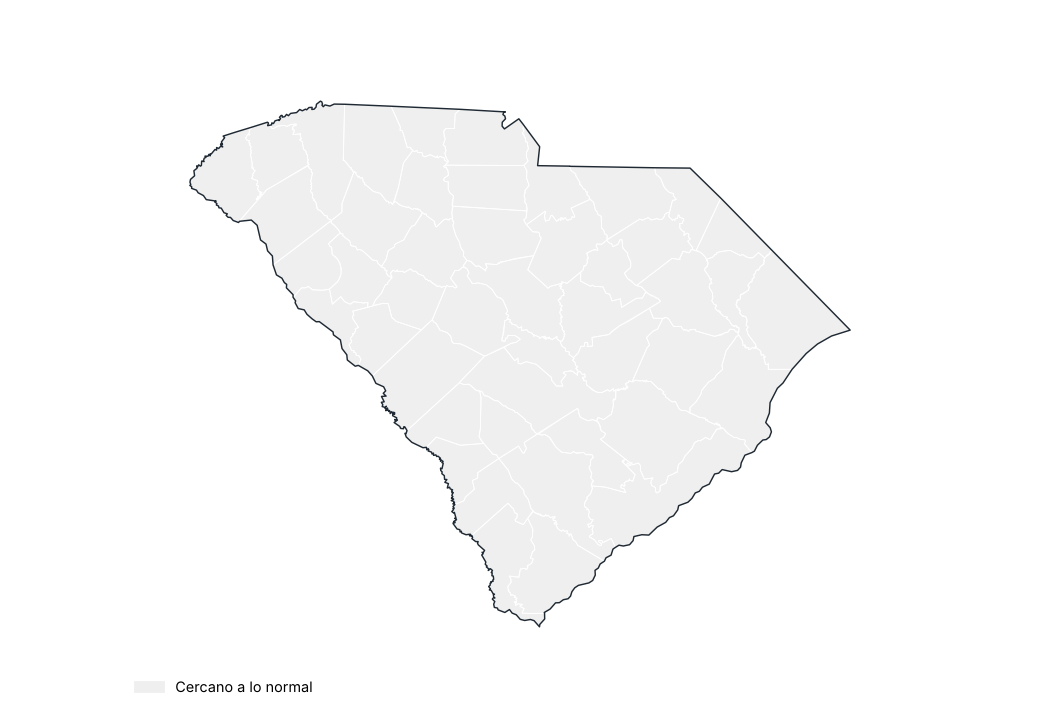
Porcentaje de lo normal por condado
Fuente: UCSB Climate Hazards Center
Precipitación por región
| Región | Acumulado (mm) | Normal (mm) | Diferencia (%) | Categoría |
|---|---|---|---|---|
| Noroeste | 1194.3 | 1409.5 | −15.3 | Cercano a lo normal |
| Centro-norte | 1135.5 | 1209.2 | −6.1 | Cercano a lo normal |
| Noreste | 1261.1 | 1382.9 | −8.8 | Cercano a lo normal |
| Centro-oeste | 1211.7 | 1281.7 | −5.5 | Cercano a lo normal |
| Centro | 1186.0 | 1285.0 | −7.7 | Cercano a lo normal |
| Sur | 1274.3 | 1368.0 | −6.9 | Cercano a lo normal |
Fuente: UCSB Climate Hazards Center
Estaciones con mayor exceso de precipitación
| Región | Condado | Estación | Altitud (m) | Anomalía (%) |
|---|---|---|---|---|
| Centro-norte | York | Rock Hill York Co AP | 198.0 | 12.6 |
| Centro-oeste | Abbeville | Antreville | 212.0 | 11.8 |
| Centro | Sumter | Sumter | 53.0 | 7.1 |
| Centro-oeste | Newberry | Little Mtn | 217.0 | 6.8 |
| Noreste | Georgetown | Brookgreen Gardens | 6.0 | 6.8 |
| Centro-oeste | Greenwood | Greenwood Co AP | 188.0 | 6.5 |
| Centro | Lexington | Batesburg | 201.0 | 4.8 |
| Noroeste | Laurens | Laurens | 180.0 | 3.9 |
| Centro | Lexington | Pelion 0.8 NW | 138.0 | 3.0 |
| Noreste | Williamsburg | Cades 4 W | 24.0 | 2.4 |
Fuente: NOAA NCEI
Estaciones con mayor déficit de precipitación
| Región | Condado | Estación | Altitud (m) | Anomalía (%) |
|---|---|---|---|---|
| Noroeste | Greenville | Caesars Head | 975.0 | −30.2 |
| Sur | Hampton | Yemassee 1 N | 13.0 | −27.6 |
| Noroeste | Oconee | Jocassee 8 WNW | 774.0 | −24.9 |
| Noreste | Chesterfield | Chesterfield 3 E | 62.0 | −24.6 |
| Noroeste | Union | Union 8 S | 137.0 | −23.7 |
| Centro-oeste | Abbeville | Calhoun Falls | 162.0 | −21.9 |
| Centro-norte | Chester | Chester 1 SE | 171.0 | −19.8 |
| Noroeste | Anderson | Anderson Faa AP | 234.0 | −19.6 |
| Noroeste | Spartanburg | Spartanburg 3 SSE | 186.0 | −19.5 |
| Sur | Berkeley | Moncks Corner 4 N | 15.0 | −19.4 |
Fuente: NOAA NCEI
Mayores lluvias en 24 horas en estaciones
| Estación | Condado | Lluvia máxima en 24 h (mm) | Fecha |
|---|---|---|---|
| Sullivans Is | Charleston | 165.9 | 22/08/2025 |
| Mullins | Marion | 154.7 | 27/09/2025 |
| Andrews | Georgetown | 152.4 | 12/10/2025 |
| Jamestown | Berkeley | 143.8 | 12/10/2025 |
| Summerville 4W | Dorchester | 143.5 | 22/08/2025 |
| Sharon 6 SSW | York | 127.3 | 05/08/2025 |
| York 5 SSE | York | 117.6 | 06/08/2025 |
| Cades 4 W | Williamsburg | 115.6 | 12/10/2025 |
| Barnwell 5 ENE | Barnwell | 114.3 | 12/05/2025 |
| Brookgreen Gardens | Georgetown | 112.3 | 12/10/2025 |
Fuente: NOAA NCEI
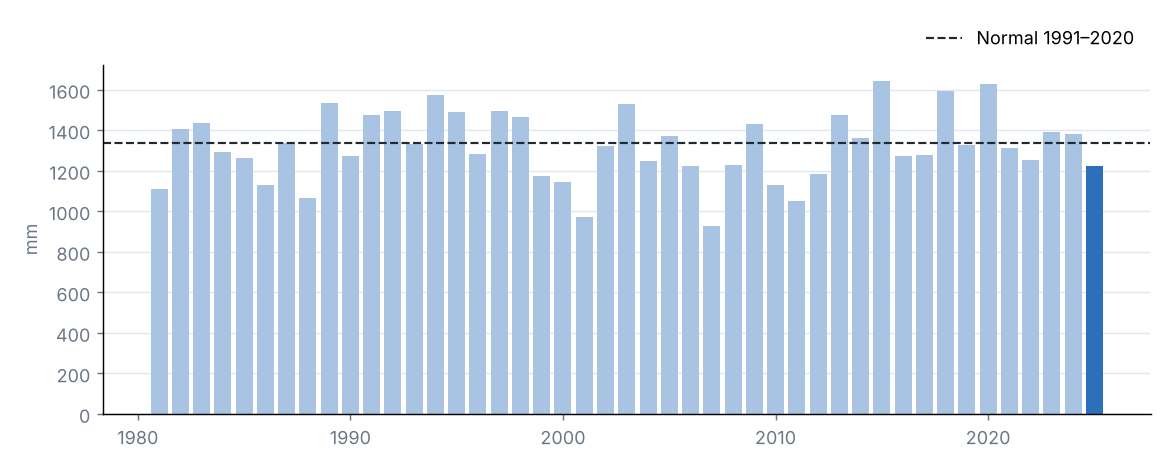
Precipitación estatal en cada año
Fuente: UCSB Climate Hazards Center
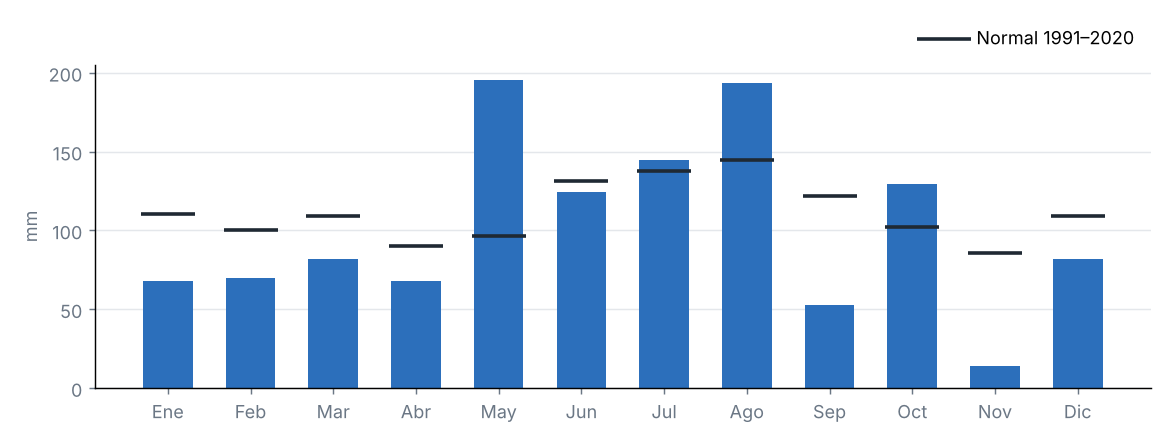
Precipitación mensual y normal 1991–2020
Fuente: UCSB Climate Hazards Center
La precipitación acumulada en el estado fue de 1223.0 mm, el 91 % de su promedio 1991–2020 (1338.1 mm), categoría «cercano a lo normal». Fue el 11.º año más seco de la serie 1981–2025.
La región con mayor porcentaje respecto a su normal fue Centro-oeste (95 %) y la de menor porcentaje, Noroeste (85 %).
Fuente: UCSB Climate Hazards Center
4 Temperatura
Fuente: NOAA CPC / PSL
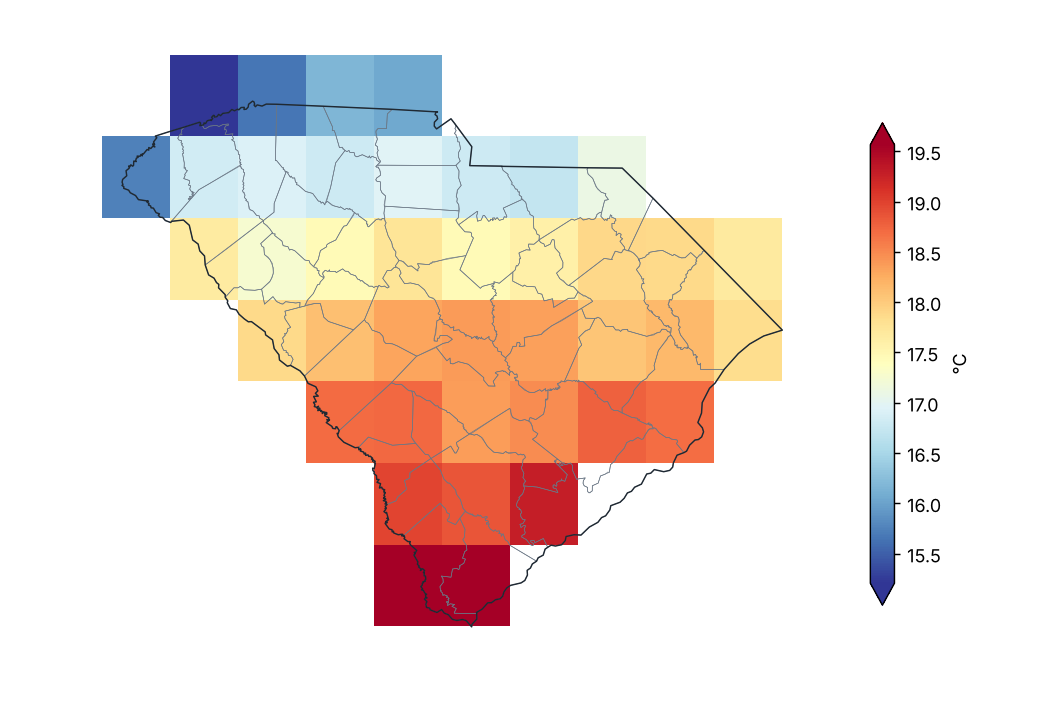
Temperatura media
Fuente: NOAA CPC / PSL
Anomalía de temperatura media (1991–2020)
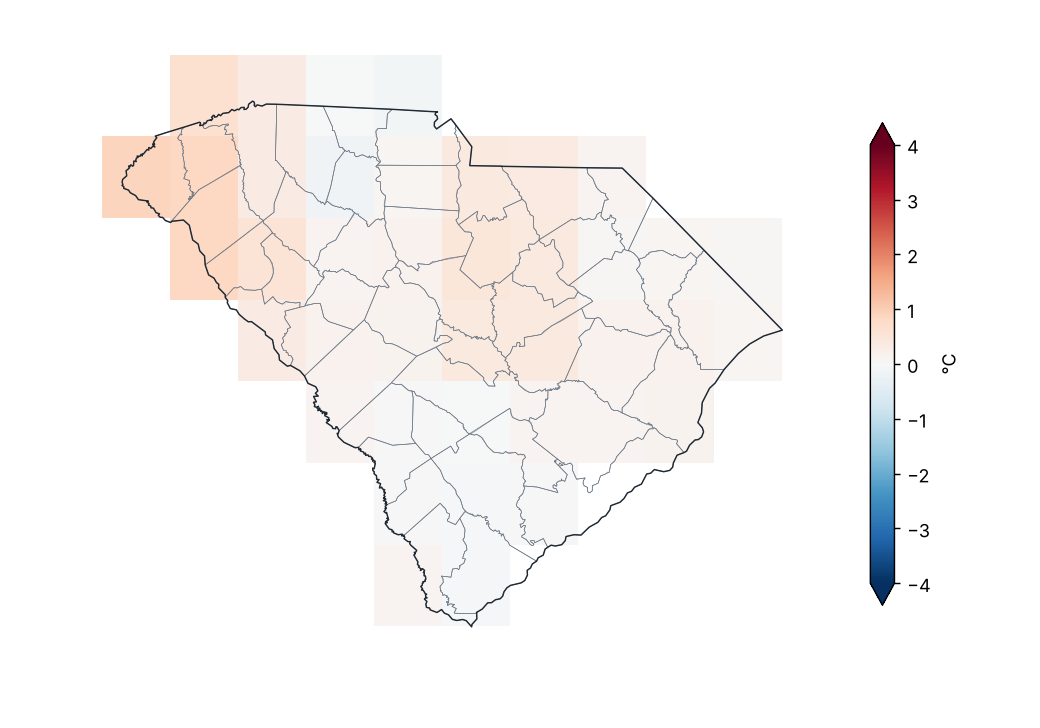
Fuente: NOAA CPC / PSL
Anomalía de temperatura media por región
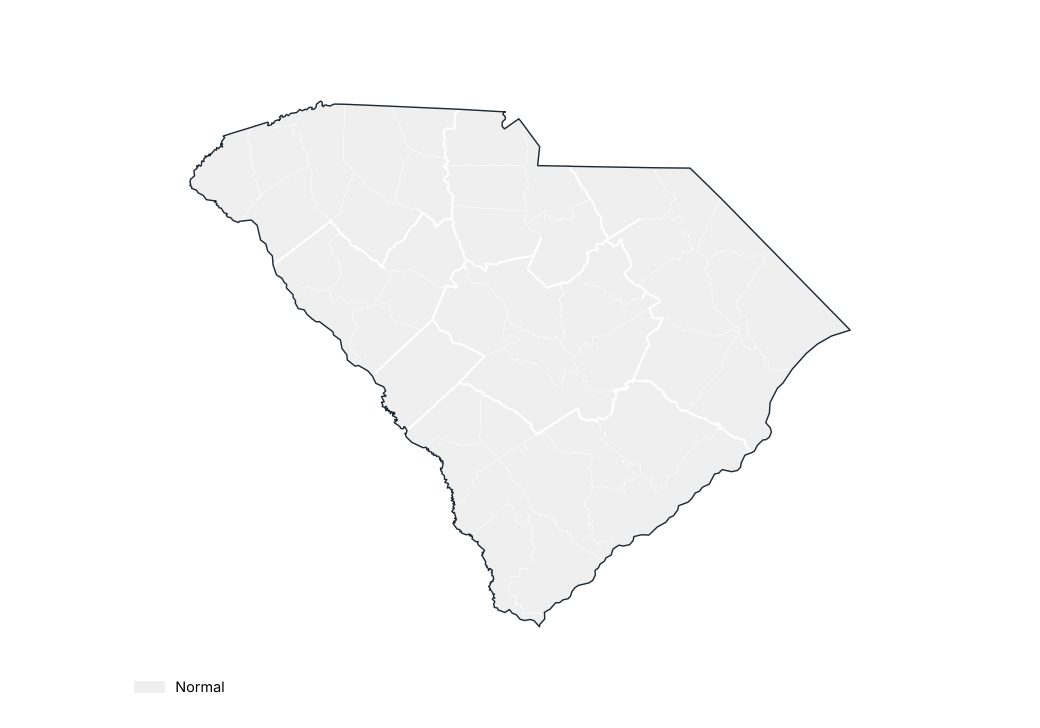
Fuente: NOAA CPC / PSL
Estaciones con mayor anomalía positiva
| Región | Condado | Estación | Altitud (m) | Anomalía (°C) |
|---|---|---|---|---|
| Centro | Sumter | Sumter | 53.0 | 1.1 |
| Noroeste | Anderson | Anderson Faa AP | 234.0 | 0.7 |
| Centro-oeste | Abbeville | Calhoun Falls | 162.0 | 0.6 |
| Noroeste | Laurens | Laurens | 180.0 | 0.5 |
| Sur | Hampton | Yemassee 1 N | 13.0 | 0.5 |
| Centro-oeste | Saluda | Saluda | 146.0 | 0.4 |
| Noroeste | Pickens | Pickens | 328.0 | 0.4 |
| Centro-oeste | Newberry | Little Mtn | 217.0 | 0.4 |
| Noroeste | Greenville | Greenville Dwtn AP | 310.0 | 0.2 |
| Noroeste | Spartanburg | Greer | 326.0 | 0.2 |
Fuente: NOAA NCEI
Estaciones con mayor anomalía negativa
| Región | Condado | Estación | Altitud (m) | Anomalía (°C) |
|---|---|---|---|---|
| Sur | Charleston | Sullivans Is | 2.0 | −1.1 |
| Centro | Orangeburg | Orangeburg 2 | 56.0 | −0.9 |
| Centro | Lexington | Pelion 0.8 NW | 138.0 | −0.7 |
| Noroeste | Oconee | Clemson Oconee Co AP | 271.0 | −0.6 |
| Centro | Clarendon | Manning | 26.0 | −0.6 |
| Noreste | Georgetown | Andrews | 11.0 | −0.6 |
| Centro | Richland | Sandhill Rsch - Elgin | 134.0 | −0.6 |
| Noreste | Williamsburg | Cades 4 W | 24.0 | −0.4 |
| Noreste | Georgetown | Brookgreen Gardens | 6.0 | −0.4 |
| Noroeste | Pickens | Clemson Univ | 244.0 | −0.4 |
Fuente: NOAA NCEI
Anomalía mensual de la temperatura media estatal
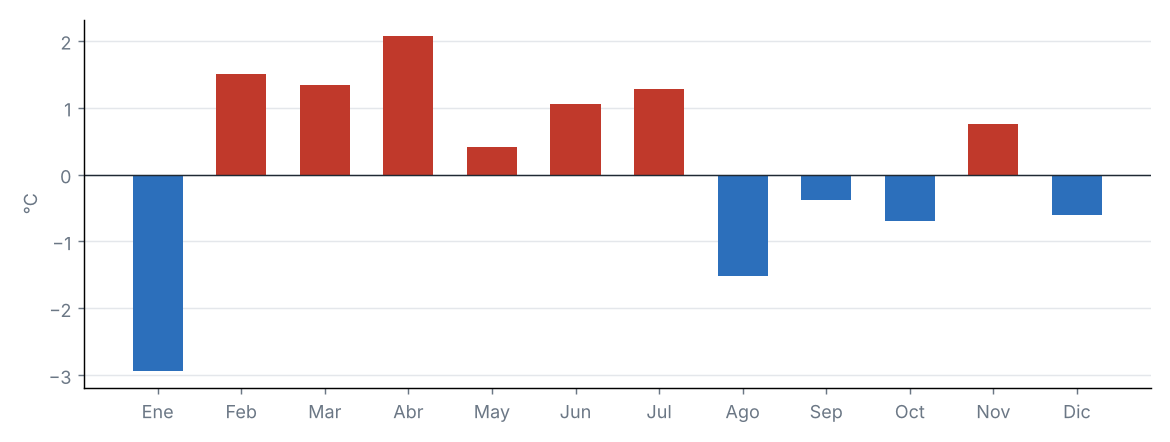
Fuente: NOAA CPC / PSL
Anomalía de la temperatura media estatal en cada año
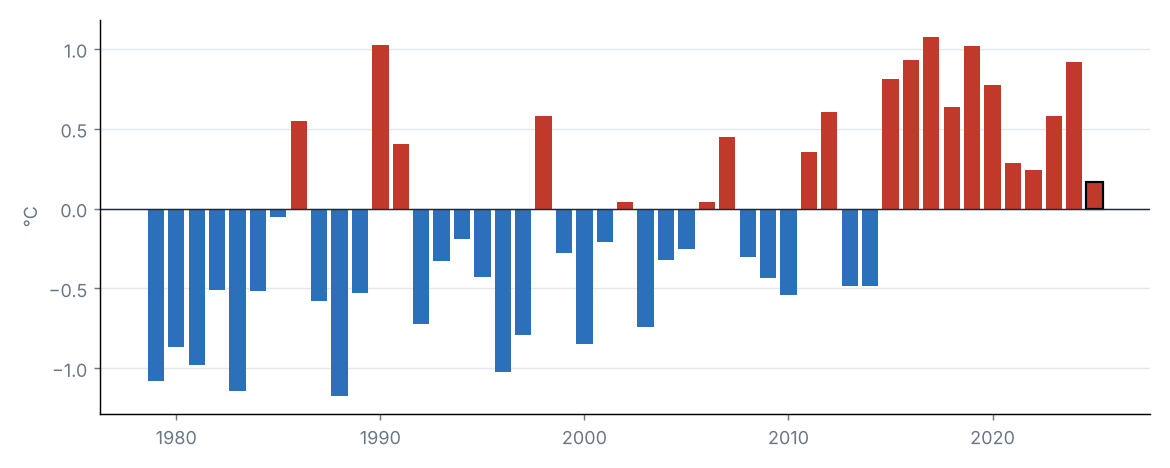
Fuente: NOAA CPC / PSL
La temperatura media estatal fue de 17.9 °C, 0.2 °C por encima del promedio 1991–2020 (17.7 °C), categoría «normal». Fue el 17.º año más cálido de la serie 1979–2025 (empatado con 2022).
Por regiones, la mayor anomalía se registró en Noroeste (+0.4 °C) y la menor en Sur (−0.0 °C).
Fuente: NOAA CPC / PSL
Fuente: NOAA CPC / PSL
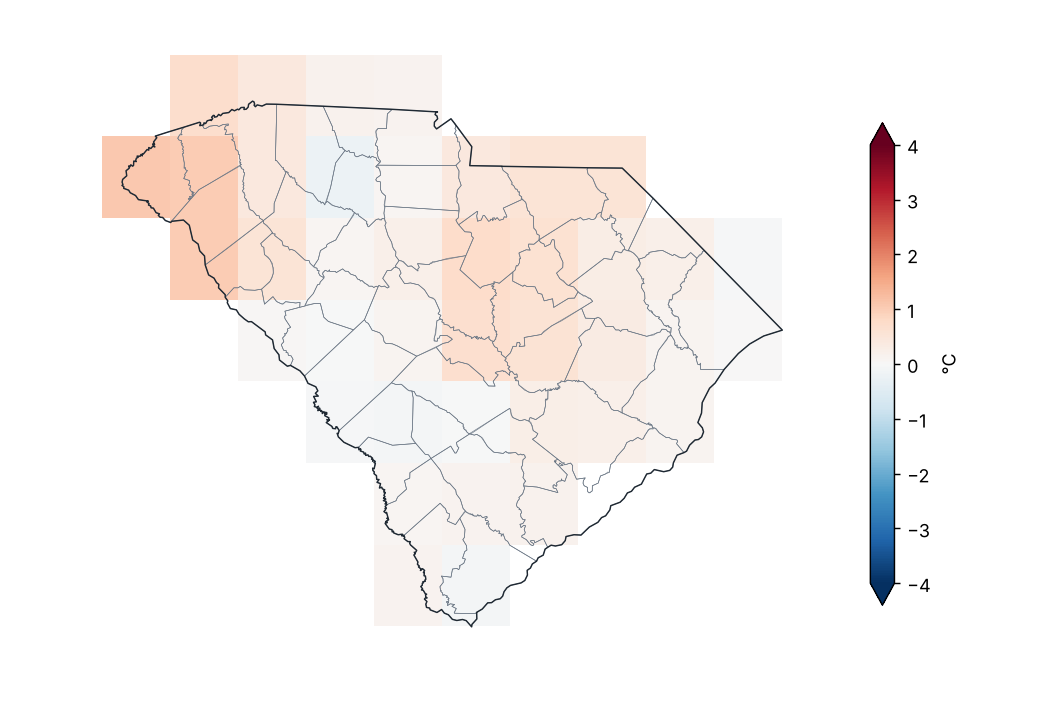
Anomalía de temperatura máxima (1991–2020)
Fuente: NOAA CPC / PSL
Valores extremos de la temperatura máxima media mensual por región
| Región | Valor mínimo (°C) | Estación | Valor máximo (°C) | Estación |
|---|---|---|---|---|
| Noroeste | 17.4 | Caesars Head | 23.5 | Anderson Faa AP |
| Centro-norte | 21.9 | York 5 SSE | 23.9 | Lugoff 2NE |
| Noreste | 22.2 | Mullins | 25.2 | Cades 4 W |
| Centro-oeste | 22.9 | Little Mtn | 24.1 | Newberry |
| Centro | 23.0 | Cedar Creek 2E | 26.4 | Columbia Univ Of Sc |
| Sur | 20.7 | Sullivans Is | 26.0 | Barnwell 5 ENE |
Promedio mensual por estación (GHCN-Daily, ≥ 80 % de días con datos).
Fuente: NOAA NCEI
La temperatura máxima estatal fue de 24.0 °C, 0.3 °C por encima del promedio 1991–2020 (23.7 °C), categoría «normal». Fue el 16.º año más cálido de la serie 1979–2025 (empatado con 1991, 2006, 2022).
Por regiones, la mayor anomalía se registró en Noroeste (+0.5 °C) y la menor en Centro-oeste (+0.2 °C).
Fuente: NOAA CPC / PSL
Fuente: NOAA CPC / PSL
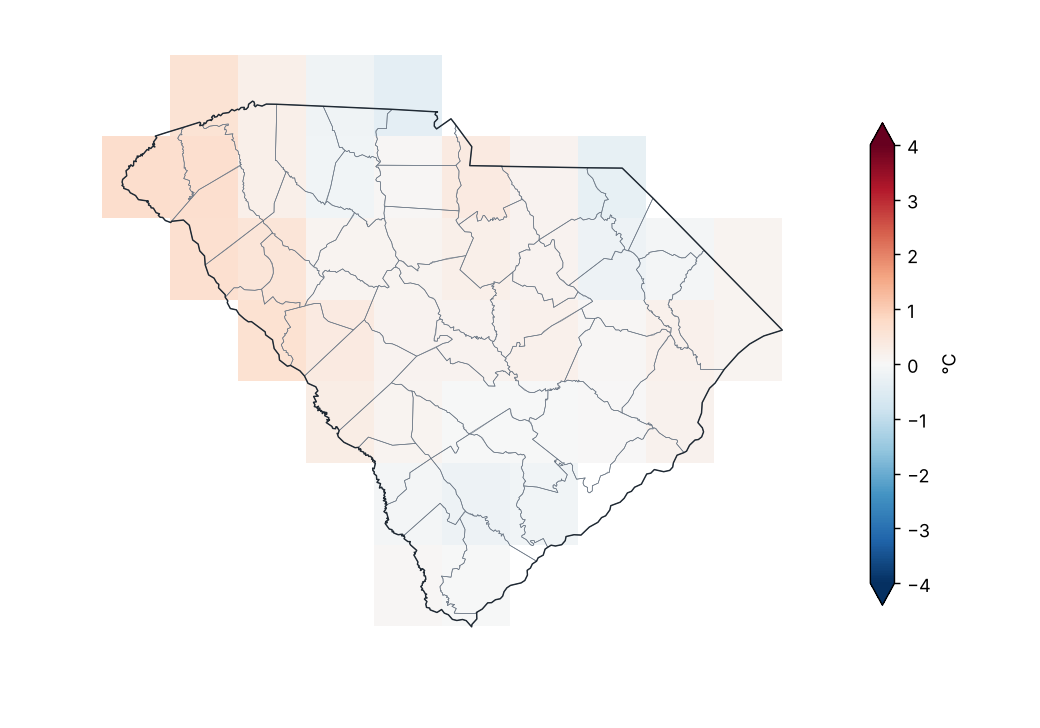
Anomalía de temperatura mínima (1991–2020)
Fuente: NOAA CPC / PSL
Valores extremos de la temperatura mínima media mensual por región
| Región | Valor mínimo (°C) | Estación | Valor máximo (°C) | Estación |
|---|---|---|---|---|
| Noroeste | 5.6 | Jocassee 8 WNW | 11.9 | Greenville Dwtn AP |
| Centro-norte | 9.2 | Chester 1 SE | 11.5 | Parr |
| Noreste | 9.5 | Cades 4 W | 14.3 | Myrtle Beach Afb |
| Centro-oeste | 10.2 | Mccormick | 11.8 | Little Mtn |
| Centro | 8.9 | Cedar Creek 2E | 13.3 | Sumter Shaw Afb |
| Sur | 10.9 | Barnwell 5 ENE | 16.5 | Dwtn Charleston |
Promedio mensual por estación (GHCN-Daily, ≥ 80 % de días con datos).
Fuente: NOAA NCEI
La temperatura mínima estatal fue de 11.7 °C, 0.1 °C por encima del promedio 1991–2020 (11.7 °C), categoría «normal». Fue el 18.º año más cálido de la serie 1979–2025.
Por regiones, la mayor anomalía se registró en Centro-oeste (+0.4 °C) y la menor en Sur (−0.2 °C).
Fuente: NOAA CPC / PSL
5 Extremos climáticos y récords
Fuente: NOAA NCEI
Temperatura máxima más alta por condado
| Condado | Estación | Temperatura (°C) | Fecha |
|---|---|---|---|
| Abbeville | Calhoun Falls | 38.3 | 28/07/2025 |
| Aiken | Aiken 2 E | 37.8 | 26/06/2025 |
| Anderson | Sandy Springs 2 NE | 37.8 | 28/07/2025 |
| Bamberg | Bamberg | 36.7 | 26/06/2025 |
| Barnwell | Barnwell 5 ENE | 38.9 | 26/06/2025 |
| Beaufort | Beaufort Mcas | 36.7 | 27/07/2025 |
| Berkeley | Moncks Corner 4 N | 37.8 | 22/07/2025 |
| Charleston | Mcclellanville 7 NE | 37.2 | 27/07/2025 |
| Chester | Chester 1 SE | 38.3 | 28/07/2025 |
| Chesterfield | Chesterfield 3 E | 39.4 | 27/07/2025 |
| Clarendon | Manning | 36.7 | 28/07/2025 |
| Colleton | Walterboro 1 SW | 38.3 | 29/07/2025 |
| Darlington | Hartsville | 40.0 | 28/07/2025 |
| Dorchester | Summerville 4W | 38.3 | 27/07/2025 |
| Edgefield | Johnston 4 SW | 36.7 | 26/06/2025 |
| Fairfield | Parr | 38.3 | 28/07/2025 |
| Florence | Florence Rgnl AP | 39.4 | 27/07/2025 |
| Georgetown | Andrews | 37.2 | 28/07/2025 |
| Greenville | Greenville Dwtn AP | 37.8 | 27/07/2025 |
| Greenwood | Greenwood 8NE | 37.8 | 22/07/2025 |
| Hampton | Yemassee 1 N | 38.3 | 28/07/2025 |
| Horry | Myrtle Beach Afb | 36.1 | 27/07/2025 |
| Kershaw | Lugoff 2NE | 38.9 | 28/07/2025 |
| Laurens | Clinton | 37.8 | 28/07/2025 |
| Lee | Bishopville 1.4 ENE | 38.3 | 28/07/2025 |
| Lexington | Columbia | 38.3 | 28/07/2025 |
| McCormick | Mccormick | 38.9 | 28/07/2025 |
| Marion | Marion | 38.3 | 27/07/2025 |
| Newberry | Newberry | 38.9 | 29/07/2025 |
| Oconee | Clemson Oconee Co AP | 37.2 | 27/07/2025 |
| Orangeburg | Holly Hill 1 SW | 37.2 | 29/07/2025 |
| Pickens | Clemson Univ | 37.2 | 28/07/2025 |
| Richland | Columbia Univ Of Sc | 41.7 | 27/07/2025 |
| Saluda | Saluda | 38.9 | 28/07/2025 |
| Spartanburg | Greer | 37.8 | 26/07/2025 |
| Sumter | Sumter Shaw Afb | 39.0 | 27/07/2025 |
| Union | Santuck | 40.0 | 27/07/2025 |
| Williamsburg | Cades 4 W | 38.9 | 28/07/2025 |
| York | Winthrop Univ | 38.3 | 28/07/2025 |
Fuente: NOAA NCEI
Temperatura mínima más baja por condado
| Condado | Estación | Temperatura (°C) | Fecha |
|---|---|---|---|
| Abbeville | Calhoun Falls | −8.9 | 24/01/2025 |
| Aiken | Aiken 2 E | −7.8 | 23/01/2025 |
| Anderson | Sandy Springs 2 NE | −11.7 | 25/01/2025 |
| Bamberg | Bamberg | −8.3 | 23/01/2025 |
| Barnwell | Barnwell 5 ENE | −8.9 | 23/01/2025 |
| Beaufort | Beaufort Mcas | −6.0 | 24/01/2025 |
| Berkeley | Moncks Corner 4 N | −7.2 | 15/12/2025 |
| Charleston | Mcclellanville 7 NE | −6.3 | 15/12/2025 |
| Chester | Chester 1 SE | −11.1 | 15/12/2025 |
| Chesterfield | Cheraw | −10.6 | 23/01/2025 |
| Clarendon | Manning | −10.0 | 23/01/2025 |
| Colleton | Walterboro 1 SW | −6.7 | 16/12/2025 |
| Darlington | Hartsville | −9.4 | 23/01/2025 |
| Dorchester | Summerville 4W | −6.1 | 15/12/2025 |
| Edgefield | Johnston 4 SW | −8.3 | 23/01/2025 |
| Fairfield | Winnsboro | −8.9 | 23/01/2025 |
| Florence | Florence Rgnl AP | −9.3 | 23/01/2025 |
| Georgetown | Andrews | −7.2 | 15/12/2025 |
| Greenville | Caesars Head | −15.6 | 22/01/2025 |
| Greenwood | Greenwood Co AP | −9.3 | 23/01/2025 |
| Hampton | Yemassee 1 N | −8.3 | 23/01/2025 |
| Horry | Myrtle Beach | −8.3 | 23/01/2025 |
| Kershaw | Lugoff 2NE | −9.4 | 23/01/2025 |
| Laurens | Laurens | −9.4 | 16/12/2025 |
| Lee | Bishopville 1.4 ENE | −9.4 | 23/01/2025 |
| Lexington | Batesburg | −11.1 | 23/01/2025 |
| McCormick | Mccormick | −9.4 | 23/01/2025 |
| Marion | Mullins | −11.1 | 23/01/2025 |
| Newberry | Little Mtn | −9.4 | 15/12/2025 |
| Oconee | Jocassee 8 WNW | −15.6 | 22/01/2025 |
| Orangeburg | Holly Hill 1 SW | −10.0 | 23/01/2025 |
| Pickens | Table Rock | −12.2 | 22/01/2025 |
| Richland | Cedar Creek 2E | −10.6 | 23/01/2025 |
| Saluda | Saluda | −8.9 | 23/01/2025 |
| Spartanburg | Chesnee 7 WSW | −11.1 | 25/01/2025 |
| Sumter | Sumter | −8.3 | 23/01/2025 |
| Union | Union 8 S | −12.2 | 23/01/2025 |
| Williamsburg | Cades 4 W | −8.3 | 22/02/2025 |
| York | York 5 SSE | −11.7 | 15/12/2025 |
Fuente: NOAA NCEI
Índices de extremos climáticos (promedio estatal)
| Índice | Descripción | Valor | Normal | Diferencia | Unidad |
|---|---|---|---|---|---|
| TX90p | Días cálidos (máxima > percentil 90) | 11.1 | 10.0 | 1.1 | % |
| TN90p | Noches cálidas (mínima > percentil 90) | 11.9 | 10.0 | 1.9 | % |
| TX10p | Días frescos (máxima < percentil 10) | 11.6 | 10.0 | 1.6 | % |
| TN10p | Noches frías (mínima < percentil 10) | 9.4 | 10.0 | −0.6 | % |
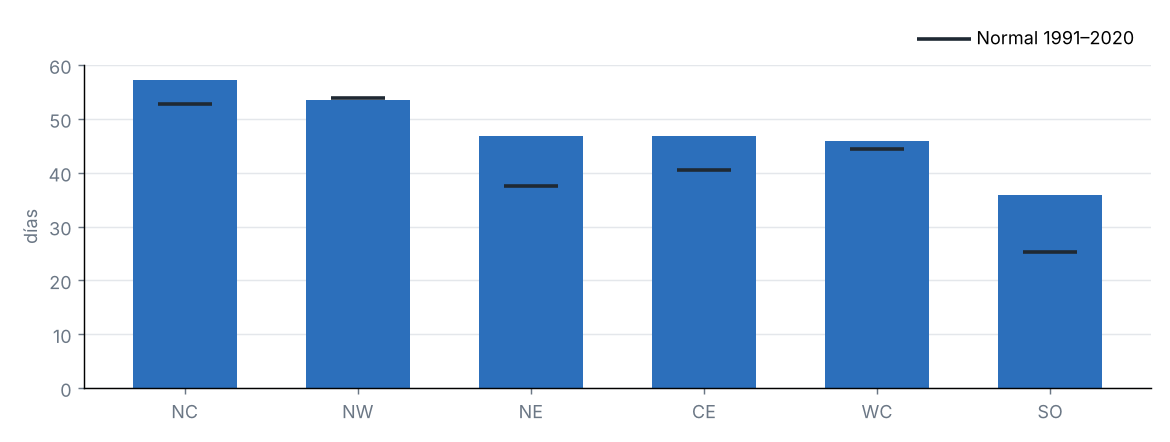
| FD | Días con helada (mínima < 0 °C) | 46.4 | 40.1 | 6.4 | d |
| SU | Días de verano (máxima > 25 °C) | 194.8 | 181.1 | 13.7 | d |
| TR | Noches tropicales (mínima > 20 °C) | 84.8 | 83.2 | 1.6 | d |
| WSDI | Días en rachas cálidas (≥ 6 días) | 0.4 | — | — | d |
| CSDI | Días en rachas frías (≥ 6 días) | 6.3 | — | — | d |
| Rx1day | Lluvia máxima en 1 día | 67.7 | 70.2 | −2.5 | mm |
| Rx5day | Lluvia máxima en 5 días | 120.4 | 116.7 | 3.7 | mm |
| CDD | Días secos consecutivos (< 1 mm) | 19.9 | 19.9 | 0.0 | d |
| CWD | Días húmedos consecutivos (≥ 1 mm) | 8.3 | 8.4 | −0.1 | d |
Índices de percentil respecto a los percentiles diarios de 1991–2020 (ventana de 5 días); conteos y máximos promediados sobre las celdas del estado.
Fuente: NOAA CPC / PSL
Días con helada por región
Fuente: NOAA CPC / PSL
Ondas de calor y frío
| Fechas | Tipo | Detalles |
|---|---|---|
| 22/01/2025 – 25/01/2025 | Onda fría | Hasta el 100 % del estado bajo el percentil 10 de la mínima. Regiones: Noroeste, Centro-norte, Noreste, Centro-oeste, Centro y Sur. |
| 20/02/2025 – 22/02/2025 | Onda fría | Hasta el 100 % del estado bajo el percentil 10 de la mínima. Regiones: Noroeste, Centro-norte, Noreste, Centro-oeste, Centro y Sur. |
| 03/04/2025 – 06/04/2025 | Onda de calor | Hasta el 86 % del estado sobre el percentil 90 de la máxima. Regiones: Noroeste, Centro-norte, Noreste, Centro-oeste, Centro y Sur. |
| 26/07/2025 – 28/07/2025 | Onda de calor | Hasta el 94 % del estado sobre el percentil 90 de la máxima. Regiones: Noroeste, Centro-norte, Noreste, Centro-oeste, Centro y Sur. |
| 03/08/2025 – 06/08/2025 | Onda fría | Hasta el 95 % del estado bajo el percentil 10 de la mínima. Regiones: Noroeste, Centro-norte, Noreste, Centro-oeste, Centro y Sur. |
| 26/08/2025 – 04/09/2025 | Onda fría | Hasta el 100 % del estado bajo el percentil 10 de la mínima. Regiones: Noroeste, Centro-norte, Noreste, Centro-oeste, Centro y Sur. |
| 14/12/2025 – 16/12/2025 | Onda fría | Hasta el 100 % del estado bajo el percentil 10 de la mínima. Regiones: Noroeste, Centro-norte, Noreste, Centro-oeste, Centro y Sur. |
Onda: al menos 3 días consecutivos con al menos la mitad del estado por encima del percentil 90 de la máxima (calor) o por debajo del percentil 10 de la mínima (frío). Se listan como máximo las 10 más intensas.
Fuente: NOAA CPC / PSL
6 Sequía
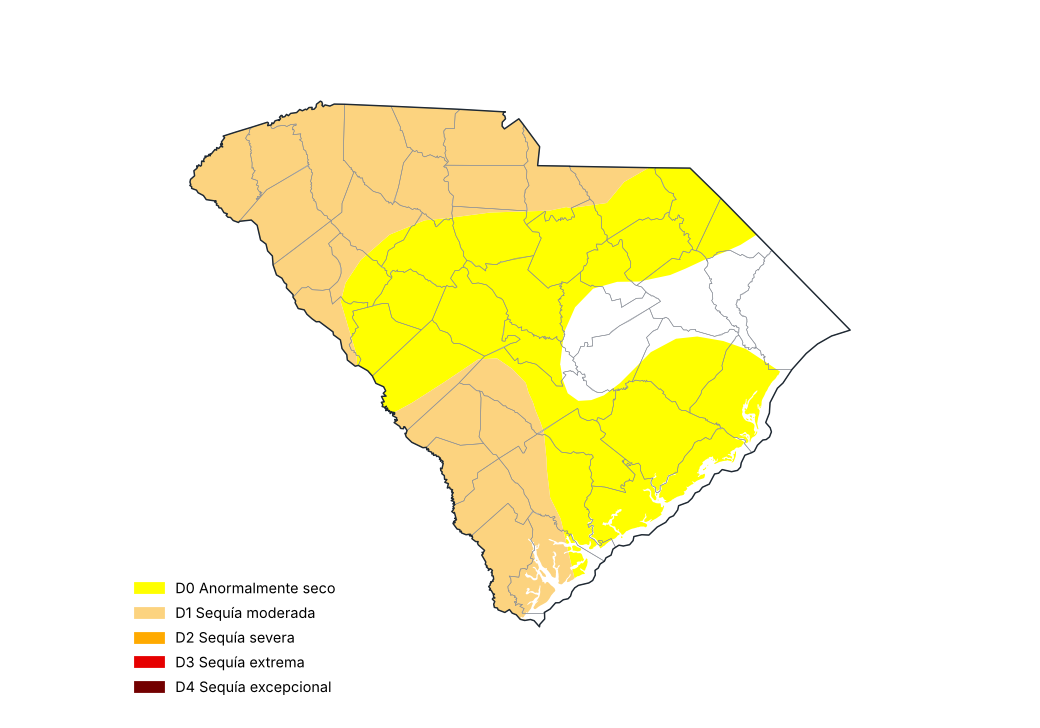
Monitor de Sequía de EE. UU., 30 de diciembre de 2025
Fuente: National Drought Mitigation Center, USDA, NOAA
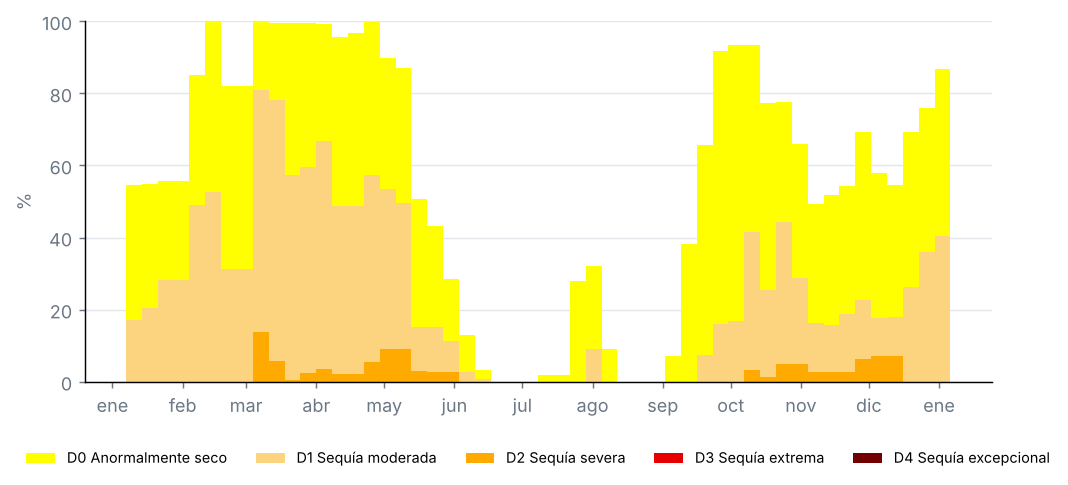
Proporción del estado por categoría de sequía, mapas semanales del Monitor de Sequía de EE. UU. (%)
Fuente: National Drought Mitigation Center, USDA, NOAA
Condados con la sequía más severa, Monitor de Sequía de EE. UU. del 30 de diciembre de 2025 (% del condado)
| Condado | D0–D4 (%) | D1–D4 (%) | D2–D4 (%) | D3–D4 (%) | D4 (%) |
|---|---|---|---|---|---|
| Abbeville | 100.0 | 100.0 | 0.0 | 0.0 | 0.0 |
| Allendale | 100.0 | 100.0 | 0.0 | 0.0 | 0.0 |
| Anderson | 100.0 | 100.0 | 0.0 | 0.0 | 0.0 |
| Bamberg | 100.0 | 100.0 | 0.0 | 0.0 | 0.0 |
| Barnwell | 100.0 | 100.0 | 0.0 | 0.0 | 0.0 |
| Cherokee | 100.0 | 100.0 | 0.0 | 0.0 | 0.0 |
| Chester | 100.0 | 100.0 | 0.0 | 0.0 | 0.0 |
| Greenville | 100.0 | 100.0 | 0.0 | 0.0 | 0.0 |
| Hampton | 100.0 | 100.0 | 0.0 | 0.0 | 0.0 |
| Jasper | 100.0 | 100.0 | 0.0 | 0.0 | 0.0 |
Proporciones acumuladas: D1–D4 es la proporción con sequía moderada o peor.
Fuente: National Drought Mitigation Center, USDA, NOAA
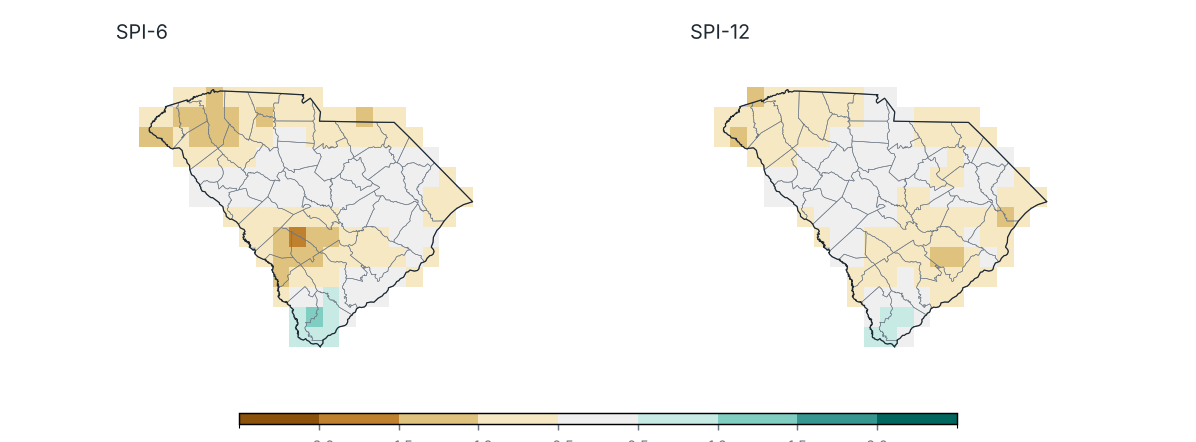
Índice Estandarizado de Precipitación (SPI) al cierre de diciembre 2025
Fuente: UCSB Climate Hazards Center
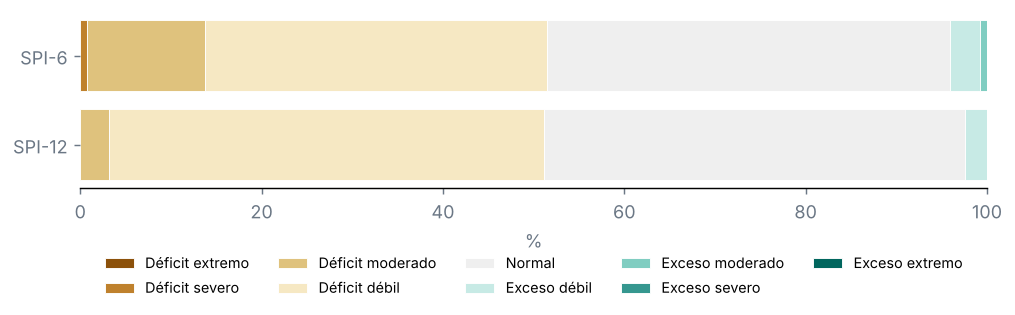
Porcentaje del territorio por categoría de SPI
Fuente: UCSB Climate Hazards Center
Condados con el SPI-12 más bajo
| Condado | SPI-6 | SPI-12 | Categoría |
|---|---|---|---|
| Berkeley | −0.7 | −0.9 | Déficit débil |
| Oconee | −1.0 | −0.9 | Déficit débil |
| Pickens | −1.1 | −0.9 | Déficit débil |
| Greenville | −1.1 | −0.9 | Déficit débil |
| Dorchester | −0.7 | −0.8 | Déficit débil |
| Cherokee | −0.9 | −0.8 | Déficit débil |
| Bamberg | −1.4 | −0.8 | Déficit débil |
| Horry | −0.6 | −0.7 | Déficit débil |
| Anderson | −0.9 | −0.7 | Déficit débil |
| Georgetown | −0.4 | −0.7 | Déficit débil |
Fuente: UCSB Climate Hazards Center
Monitor de Sequía de EE. UU., mapa del 30 de diciembre de 2025: el 40 % del estado con sequía (D1–D4), el 0 % con sequía severa o peor (D2–D4) y el 0 % con sequía extrema o excepcional (D3–D4); el 87 % estaba anormalmente seco o con sequía (D0–D4).
En el mapa del 31 de diciembre de 2024, el 17 % del estado estaba con sequía: un cambio de +23 puntos en el periodo.
SPI-12 (Ene–Dic 2025): promedio estatal de −0.49; el 3 % del estado con sequía (SPI ≤ −1.0) y el 0 % con sequía severa o extrema.
Ningún condado promedió un SPI-12 menor que −1.0.
SPI-6 (Jul–Dic 2025): el 14 % del estado con sequía.
7 Eventos notables y tiempo severo
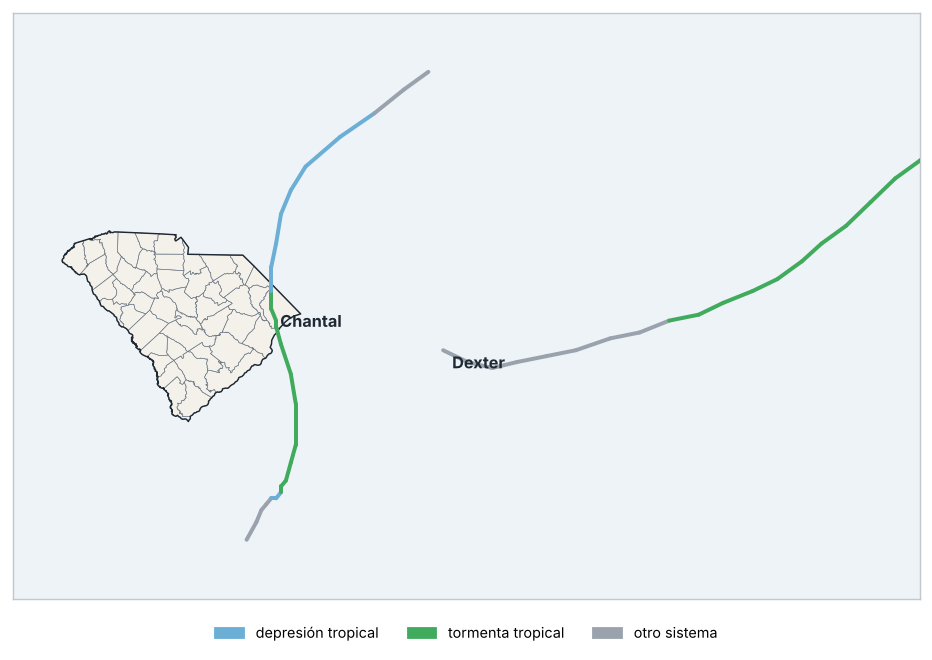
Trayectorias de ciclones tropicales cercanos
Fuente: NOAA NCEI
Ciclones tropicales a menos de 300 km del estado
| Nombre | Cuenca | Intensidad máxima | Viento máximo (km/h) | Inicio | Fin | Distancia mínima (km) | Impacto en tierra | Intensidad al impacto |
|---|---|---|---|---|---|---|---|---|
| Chantal | Atlántico norte | Tormenta tropical | 93 | 04/07/2025 | 07/07/2025 | 0 | Horry | Tormenta tropical |
| Dexter | Atlántico norte | Tormenta tropical | 130 | 02/08/2025 | 13/08/2025 | 277 | — | — |
Fuente: NOAA NCEI
Eventos notables
| Fechas | Tipo | Zona | Detalles |
|---|---|---|---|
| 22/08/2025 | Lluvia intensa | Sullivans Is | 165.9 mm en 24 horas. |
| 27/09/2025 | Lluvia intensa | Mullins | 154.7 mm en 24 horas. |
| 12/10/2025 | Lluvia intensa | Andrews | 152.4 mm en 24 horas. |
Alertas de GDACS y lluvias de 150 mm o más en 24 horas en estaciones (tras el control de calidad).
Fuente: GDACS, NOAA NCEI
Ciclones tropicales a menos de 300 km del estado: 2 (Chantal y Dexter).
Impactos en tierra: Chantal en Horry (tormenta tropical).
9 Perspectivas
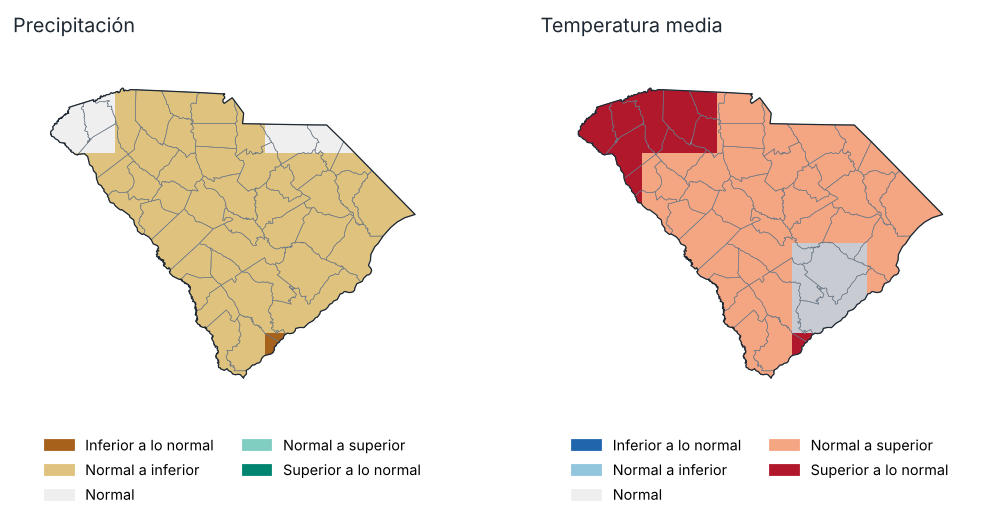
Perspectiva para Ene–Mar 2026: tercil más probable
Fuente: NOAA CPC
Probabilidad de cada tercil por región, Ene–Mar 2026 (%)
| Región | Precipitación: inferior | Precipitación: normal | Precipitación: superior | Temp.: inferior | Temp.: normal | Temp.: superior |
|---|---|---|---|---|---|---|
| Noroeste | 41.0 | 29.0 | 30.0 | 22.0 | 26.0 | 52.0 |
| Centro-norte | 41.0 | 33.0 | 26.0 | 22.0 | 31.0 | 46.0 |
| Noreste | 42.0 | 35.0 | 23.0 | 21.0 | 34.0 | 45.0 |
| Centro-oeste | 42.0 | 34.0 | 24.0 | 24.0 | 29.0 | 47.0 |
| Centro | 43.0 | 34.0 | 23.0 | 24.0 | 32.0 | 45.0 |
| Sur | 45.0 | 35.0 | 20.0 | 24.0 | 30.0 | 46.0 |
Fuente: NOAA CPC
Perspectiva probabilística del conjunto multimodelo norteamericano (NMME), inicializada en enero 2026, respecto a los terciles de 1991–2020. No es un pronóstico oficial: consulte al National Weather Service y al Climate Prediction Center de la NOAA.
Precipitación, Ene–Mar 2026: se favorece un valor superior a lo normal en el 0 % del estado e inferior a lo normal en el 91 %.
Temperatura media, Ene–Mar 2026: se favorece un valor superior a lo normal en el 100 % del estado e inferior a lo normal en el 0 %.
10 Anexos
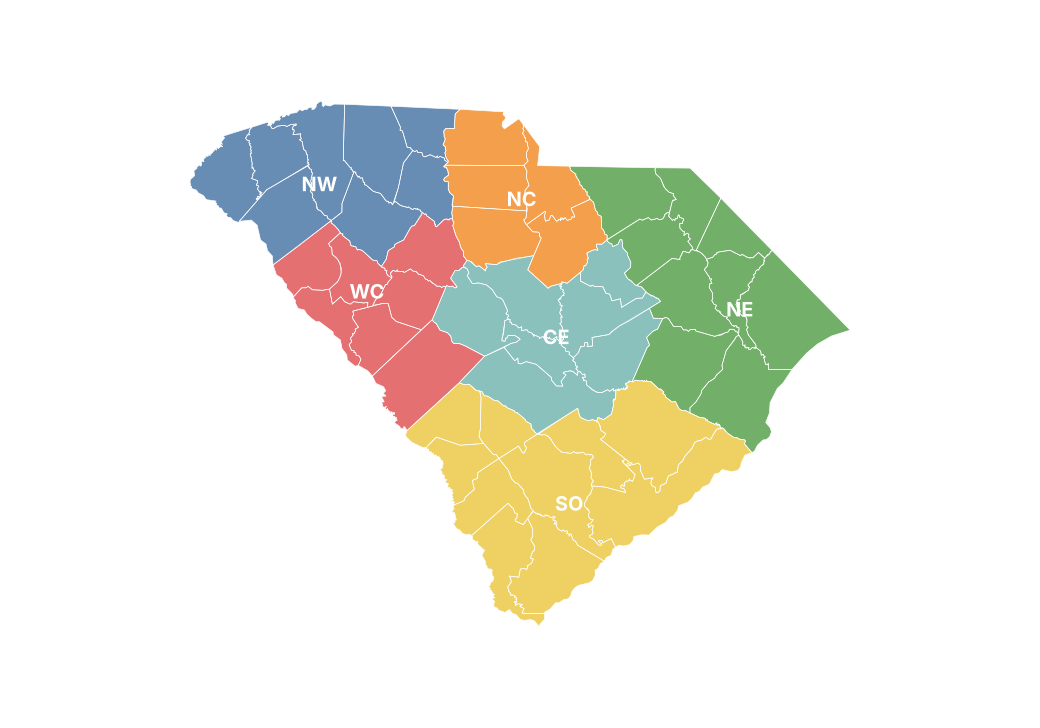
Regiones climáticas del reporte
Precipitación mensual por condado (mm)
| Condado | Ene | Feb | Mar | Abr | May | Jun | Jul | Ago | Sep | Oct | Nov | Dic |
|---|---|---|---|---|---|---|---|---|---|---|---|---|
| Abbeville | 64.8 | 121.2 | 68.3 | 99.4 | 197.0 | 112.1 | 87.7 | 200.1 | 50.7 | 76.5 | 21.2 | 71.7 |
| Aiken | 89.8 | 68.8 | 87.4 | 67.8 | 267.4 | 105.6 | 181.1 | 166.5 | 39.7 | 68.7 | 11.0 | 98.6 |
| Allendale | 67.3 | 61.1 | 95.3 | 62.8 | 233.8 | 140.4 | 189.6 | 115.5 | 36.8 | 78.8 | 7.0 | 81.7 |
| Anderson | 63.2 | 110.3 | 68.5 | 108.6 | 190.1 | 92.4 | 89.3 | 161.9 | 52.5 | 88.7 | 21.5 | 63.3 |
| Bamberg | 74.2 | 57.7 | 92.4 | 68.9 | 239.4 | 130.8 | 187.9 | 104.1 | 43.2 | 93.7 | 4.9 | 83.7 |
| Barnwell | 84.2 | 64.6 | 105.1 | 75.9 | 276.9 | 120.5 | 201.2 | 130.4 | 34.0 | 71.6 | 6.7 | 90.6 |
| Beaufort | 63.1 | 39.7 | 83.0 | 26.3 | 224.7 | 149.4 | 199.2 | 426.2 | 48.3 | 87.2 | 9.7 | 76.1 |
| Berkeley | 73.6 | 43.3 | 73.2 | 45.3 | 182.4 | 119.1 | 169.5 | 194.0 | 50.6 | 180.0 | 9.2 | 76.3 |
| Calhoun | 77.6 | 53.2 | 91.0 | 54.7 | 185.3 | 136.6 | 155.9 | 145.7 | 32.0 | 124.3 | 6.3 | 86.6 |
| Charleston | 73.6 | 34.1 | 65.2 | 31.2 | 197.4 | 98.5 | 150.3 | 317.4 | 42.9 | 172.8 | 16.5 | 71.8 |
| Cherokee | 49.9 | 107.3 | 66.5 | 83.3 | 187.9 | 111.4 | 96.3 | 139.7 | 64.5 | 86.9 | 22.0 | 66.6 |
| Chester | 51.4 | 85.2 | 70.6 | 67.9 | 199.9 | 115.5 | 104.7 | 194.2 | 36.1 | 101.7 | 14.5 | 74.7 |
| Chesterfield | 71.6 | 79.5 | 86.7 | 54.1 | 200.1 | 100.4 | 127.0 | 161.7 | 49.2 | 153.4 | 16.3 | 77.2 |
| Clarendon | 82.1 | 53.2 | 99.2 | 51.9 | 162.3 | 138.4 | 150.7 | 137.4 | 49.2 | 192.1 | 8.0 | 88.1 |
| Colleton | 61.2 | 46.1 | 70.2 | 47.7 | 186.0 | 162.3 | 198.7 | 234.2 | 47.0 | 112.0 | 7.8 | 71.2 |
| Darlington | 74.4 | 67.7 | 99.0 | 48.7 | 165.1 | 109.5 | 131.2 | 159.1 | 52.7 | 167.5 | 19.1 | 91.9 |
| Dillon | 67.5 | 53.3 | 109.7 | 56.8 | 160.3 | 114.4 | 160.3 | 143.0 | 75.2 | 149.8 | 24.8 | 102.4 |
| Dorchester | 64.4 | 47.7 | 75.3 | 53.3 | 180.3 | 139.2 | 202.6 | 191.6 | 45.2 | 142.4 | 8.7 | 76.1 |
| Edgefield | 77.5 | 78.7 | 82.9 | 88.1 | 200.3 | 101.4 | 121.4 | 202.3 | 56.5 | 65.3 | 16.1 | 84.8 |
| Fairfield | 56.0 | 83.7 | 99.5 | 79.2 | 184.8 | 108.1 | 82.0 | 201.6 | 49.1 | 134.9 | 15.0 | 74.8 |
| Florence | 75.0 | 57.2 | 106.5 | 46.1 | 145.0 | 130.2 | 160.5 | 149.2 | 68.1 | 191.6 | 5.8 | 90.9 |
| Georgetown | 73.4 | 36.4 | 64.2 | 51.3 | 190.3 | 146.6 | 182.9 | 210.2 | 64.1 | 251.4 | 9.7 | 88.2 |
| Greenville | 62.8 | 126.4 | 77.0 | 127.2 | 189.7 | 114.7 | 103.5 | 170.8 | 62.2 | 98.6 | 23.4 | 65.9 |
| Greenwood | 61.9 | 98.4 | 63.3 | 96.5 | 199.7 | 97.4 | 62.7 | 250.5 | 43.7 | 72.5 | 22.8 | 83.5 |
| Hampton | 61.1 | 53.2 | 75.2 | 55.3 | 195.4 | 171.9 | 224.0 | 161.0 | 49.8 | 83.4 | 8.1 | 79.9 |
| Horry | 69.1 | 43.0 | 80.1 | 56.4 | 175.2 | 138.4 | 202.1 | 204.6 | 73.7 | 167.7 | 7.4 | 98.3 |
| Jasper | 59.3 | 50.8 | 73.6 | 37.0 | 229.0 | 166.7 | 227.7 | 346.0 | 46.3 | 100.7 | 7.7 | 86.8 |
| Kershaw | 54.8 | 57.1 | 90.1 | 57.7 | 184.3 | 120.5 | 92.8 | 154.9 | 71.9 | 169.8 | 16.6 | 88.8 |
| Lancaster | 60.4 | 81.6 | 86.7 | 60.6 | 207.3 | 106.3 | 105.4 | 165.5 | 55.2 | 112.9 | 17.3 | 78.7 |
| Laurens | 57.7 | 105.2 | 61.3 | 94.0 | 215.4 | 102.5 | 68.8 | 193.1 | 44.5 | 73.6 | 23.2 | 80.7 |
| Lee | 64.8 | 56.5 | 84.6 | 50.7 | 176.8 | 135.5 | 117.2 | 164.4 | 46.4 | 174.7 | 16.9 | 88.4 |
| Lexington | 67.1 | 69.5 | 87.0 | 76.4 | 214.8 | 137.4 | 167.6 | 205.1 | 38.8 | 107.8 | 11.4 | 92.7 |
| McCormick | 71.4 | 91.3 | 69.9 | 101.2 | 179.3 | 99.8 | 84.2 | 259.6 | 44.3 | 60.6 | 15.1 | 82.5 |
| Marion | 68.8 | 57.8 | 107.5 | 60.7 | 173.4 | 136.1 | 171.9 | 157.5 | 85.9 | 180.5 | 7.0 | 105.1 |
| Marlboro | 70.8 | 64.7 | 92.9 | 47.4 | 159.6 | 85.5 | 154.9 | 133.3 | 52.2 | 132.6 | 19.4 | 87.5 |
| Newberry | 61.5 | 96.9 | 82.5 | 93.7 | 202.9 | 111.0 | 92.0 | 249.7 | 45.0 | 96.5 | 19.6 | 80.9 |
| Oconee | 77.0 | 141.7 | 83.9 | 138.4 | 199.9 | 116.5 | 108.5 | 176.0 | 96.4 | 119.5 | 34.2 | 62.6 |
| Orangeburg | 75.6 | 55.5 | 99.8 | 63.7 | 218.3 | 119.8 | 167.5 | 119.4 | 34.5 | 115.2 | 5.1 | 88.7 |
| Pickens | 71.9 | 127.5 | 79.8 | 139.8 | 191.2 | 117.0 | 123.8 | 175.2 | 79.3 | 118.5 | 28.6 | 67.5 |
| Richland | 59.1 | 57.4 | 86.0 | 65.9 | 172.4 | 137.6 | 113.4 | 176.4 | 47.8 | 140.3 | 11.0 | 88.2 |
| Saluda | 70.2 | 90.4 | 84.5 | 103.6 | 209.9 | 118.2 | 135.9 | 244.5 | 48.3 | 77.7 | 12.6 | 81.9 |
| Spartanburg | 57.4 | 117.8 | 73.4 | 113.5 | 205.0 | 105.3 | 107.3 | 176.5 | 62.9 | 93.4 | 23.4 | 65.8 |
| Sumter | 71.0 | 54.0 | 87.5 | 52.8 | 154.7 | 153.6 | 127.9 | 149.6 | 40.0 | 171.0 | 8.5 | 88.4 |
| Union | 55.0 | 92.9 | 67.5 | 79.7 | 210.8 | 114.0 | 88.0 | 177.6 | 45.8 | 86.5 | 19.4 | 80.6 |
| Williamsburg | 81.3 | 51.4 | 83.4 | 49.6 | 156.7 | 148.1 | 176.4 | 149.4 | 69.5 | 234.5 | 6.0 | 86.5 |
| York | 50.1 | 90.0 | 59.2 | 73.2 | 198.7 | 128.6 | 90.7 | 187.7 | 41.0 | 87.0 | 16.4 | 68.1 |
Fuente: UCSB Climate Hazards Center
Temperatura máxima mensual por región (°C)
| Región | Ene | Feb | Mar | Abr | May | Jun | Jul | Ago | Sep | Oct | Nov | Dic |
|---|---|---|---|---|---|---|---|---|---|---|---|---|
| Noroeste | 9.5 | 15.9 | 20.8 | 24.5 | 25.4 | 31.4 | 34.1 | 28.3 | 28.1 | 22.1 | 19.0 | 13.2 |
| Centro-norte | 10.0 | 16.5 | 21.5 | 25.5 | 26.6 | 31.9 | 34.3 | 29.0 | 29.0 | 22.6 | 19.9 | 13.7 |
| Noreste | 11.1 | 17.0 | 21.4 | 25.7 | 28.0 | 31.8 | 33.4 | 29.5 | 29.0 | 22.7 | 20.5 | 14.2 |
| Centro-oeste | 10.9 | 17.7 | 22.0 | 26.4 | 27.4 | 32.4 | 34.8 | 29.7 | 29.8 | 23.1 | 20.6 | 14.6 |
| Centro | 11.6 | 18.3 | 22.4 | 26.8 | 28.1 | 32.6 | 34.3 | 30.1 | 30.3 | 23.4 | 21.5 | 15.2 |
| Sur | 12.6 | 19.5 | 22.5 | 26.8 | 29.1 | 32.4 | 33.8 | 30.6 | 30.1 | 23.8 | 22.1 | 16.2 |
Fuente: NOAA CPC / PSL
Temperatura media mensual por región (°C)
| Región | Ene | Feb | Mar | Abr | May | Jun | Jul | Ago | Sep | Oct | Nov | Dic |
|---|---|---|---|---|---|---|---|---|---|---|---|---|
| Noroeste | 3.4 | 9.4 | 13.2 | 18.1 | 19.9 | 25.4 | 28.0 | 23.7 | 22.1 | 16.2 | 12.0 | 7.1 |
| Centro-norte | 3.5 | 9.7 | 13.7 | 18.9 | 21.0 | 26.1 | 28.5 | 24.4 | 22.7 | 16.7 | 12.4 | 7.1 |
| Noreste | 4.6 | 10.6 | 14.6 | 19.4 | 22.7 | 26.8 | 28.5 | 25.2 | 23.4 | 17.3 | 13.2 | 7.9 |
| Centro-oeste | 4.5 | 11.0 | 14.3 | 19.6 | 21.7 | 26.5 | 28.8 | 25.0 | 23.3 | 17.3 | 13.1 | 8.3 |
| Centro | 4.8 | 11.4 | 14.6 | 19.9 | 22.5 | 26.9 | 28.8 | 25.5 | 23.9 | 17.8 | 13.5 | 8.5 |
| Sur | 6.0 | 12.6 | 15.2 | 20.3 | 23.6 | 27.1 | 28.7 | 26.2 | 24.3 | 18.4 | 14.5 | 9.9 |
Fuente: NOAA CPC / PSL
Temperatura mínima mensual por región (°C)
| Región | Ene | Feb | Mar | Abr | May | Jun | Jul | Ago | Sep | Oct | Nov | Dic |
|---|---|---|---|---|---|---|---|---|---|---|---|---|
| Noroeste | −2.7 | 2.8 | 5.6 | 11.8 | 14.4 | 19.4 | 22.0 | 19.2 | 16.1 | 10.3 | 5.1 | 1.0 |
| Centro-norte | −3.1 | 2.9 | 5.9 | 12.3 | 15.5 | 20.2 | 22.7 | 19.8 | 16.4 | 10.8 | 4.9 | 0.6 |
| Noreste | −1.9 | 4.3 | 7.7 | 13.2 | 17.3 | 21.7 | 23.7 | 20.9 | 17.8 | 11.8 | 5.9 | 1.5 |
| Centro-oeste | −1.8 | 4.3 | 6.7 | 12.8 | 16.1 | 20.5 | 22.9 | 20.4 | 16.9 | 11.5 | 5.5 | 2.0 |
| Centro | −1.9 | 4.4 | 6.7 | 12.9 | 16.8 | 21.2 | 23.3 | 21.0 | 17.4 | 12.1 | 5.5 | 1.8 |
| Sur | −0.5 | 5.7 | 8.0 | 13.8 | 18.0 | 21.8 | 23.7 | 21.7 | 18.4 | 13.0 | 7.0 | 3.6 |
Fuente: NOAA CPC / PSL
Estaciones utilizadas
| Clave | Nombre | Condado | Latitud | Longitud | Altitud (m) | Días con datos (Tmáx) (%) |
|---|---|---|---|---|---|---|
| USC00380072 | Aiken 2 E | Aiken | 33.6 | −81.7 | 156.1 | 64.0 |
| USC00380165 | Anderson | Anderson | 34.5 | −82.7 | 243.8 | 0.0 |
| USC00380184 | Andrews | Georgetown | 33.4 | −79.6 | 10.7 | 98.0 |
| USC00380204 | Antreville | Abbeville | 34.3 | −82.5 | 211.8 | 0.0 |
| USC00380448 | Bamberg | Bamberg | 33.3 | −81.1 | 45.7 | 99.0 |
| USC00380490 | Barnwell 5 ENE | Barnwell | 33.3 | −81.2 | 74.7 | 99.0 |
| USC00380506 | Batesburg | Lexington | 33.9 | −81.5 | 201.2 | 92.0 |
| USC00380613 | Belton 7 NNE | Anderson | 34.6 | −82.4 | 201.2 | 0.0 |
| USC00380736 | Bishopville 1.4 ENE | Lee | 34.2 | −80.2 | 53.3 | 99.0 |
| USC00381093 | Brookgreen Gardens | Georgetown | 33.5 | −79.1 | 6.1 | 100.0 |
| USC00381241 | Cades 4 W | Williamsburg | 33.8 | −79.9 | 24.4 | 94.0 |
| USC00381256 | Caesars Head | Greenville | 35.1 | −82.6 | 975.4 | 100.0 |
| USC00381277 | Calhoun Falls | Abbeville | 34.1 | −82.6 | 161.5 | 100.0 |
| USC00381462 | Catawba | York | 34.9 | −80.9 | 173.7 | 0.0 |
| USC00381479 | Cedar Creek 2E | Richland | 34.2 | −81.1 | 103.0 | 100.0 |
| USC00381588 | Cheraw | Chesterfield | 34.7 | −79.9 | 45.7 | 100.0 |
| USC00381625 | Chesnee 7 WSW | Spartanburg | 35.1 | −82.0 | 228.0 | 100.0 |
| USC00381633 | Chester 1 SE | Chester | 34.7 | −81.2 | 170.7 | 100.0 |
| USC00381645 | Chesterfield 3 E | Chesterfield | 34.7 | −80.0 | 62.5 | 92.0 |
| USC00381726 | Clarks Hill 1 W | McCormick | 33.7 | −82.2 | 121.9 | 0.0 |
| USC00381770 | Clemson Univ | Pickens | 34.7 | −82.8 | 243.8 | 100.0 |
| USC00381814 | Clinton | Laurens | 34.5 | −81.9 | 199.6 | 100.0 |
| USC00381944 | Columbia Univ Of Sc | Richland | 34.0 | −81.0 | 67.4 | 95.0 |
| USC00382260 | Darlington | Darlington | 34.3 | −79.9 | 45.7 | 80.0 |
| USC00382711 | Edgefield 0.3SW | Edgefield | 33.8 | −81.9 | 154.8 | 0.0 |
| USC00382730 | Edisto Beach Sp | Colleton | 32.5 | −80.3 | 1.5 | 0.0 |
| USC00383216 | Ft Mill 4 NW | York | 35.0 | −81.0 | 165.8 | 0.0 |
| USC00383433 | Gaston Shoals | Cherokee | 35.1 | −81.6 | 176.8 | 0.0 |
| USC00383470 | Georgetown Co AP | Georgetown | 33.3 | −79.3 | 9.1 | 50.0 |
| USC00383665 | Graniteville 3.9 ENE | Aiken | 33.6 | −81.7 | 120.4 | 0.0 |
| USC00383700 | Great Falls | Chester | 34.6 | −80.9 | 102.1 | 0.0 |
| USC00383742 | Greenville Dwtn AP | Greenville | 34.8 | −82.3 | 310.0 | 98.0 |
| USC00383758 | Greenwood 8NE | Greenwood | 34.3 | −82.0 | 161.5 | 100.0 |
| USC00383990 | Hartsville | Darlington | 34.4 | −80.0 | 56.4 | 98.0 |
| USC00384205 | Holly Hill 1 SW | Orangeburg | 33.3 | −80.4 | 29.0 | 99.0 |
| USC00384373 | Indian Land 5 SSE | Lancaster | 34.9 | −80.8 | 171.9 | 0.0 |
| USC00384449 | Jamestown | Berkeley | 33.3 | −79.7 | 12.2 | 96.0 |
| USC00384460 | Jefferson 0.1NW | Chesterfield | 34.7 | −80.4 | 132.6 | 0.0 |
| USC00384581 | Jocassee 8 WNW | Oconee | 35.0 | −83.1 | 774.2 | 100.0 |
| USC00384607 | Johnston 4 SW | Edgefield | 33.8 | −81.8 | 191.1 | 35.0 |
| USC00384896 | Lake Greenwood | Newberry | 34.2 | −81.9 | 128.6 | 0.0 |
| USC00384940 | Langley 0.2 SSW | Aiken | 33.5 | −81.8 | 71.6 | 0.0 |
| USC00385017 | Laurens | Laurens | 34.5 | −82.0 | 179.5 | 100.0 |
| USC00385200 | Little Mtn | Newberry | 34.2 | −81.4 | 216.7 | 94.0 |
| USC00385232 | Lockhart | Union | 34.8 | −81.5 | 121.9 | 0.0 |
| USC00385278 | Long Creek | Oconee | 34.8 | −83.3 | 495.3 | 100.0 |
| USC00385362 | Lugoff 2NE | Kershaw | 34.2 | −80.7 | 57.9 | 96.0 |
| USC00385493 | Manning | Clarendon | 33.7 | −80.2 | 25.9 | 100.0 |
| USC00385509 | Marion | Marion | 34.2 | −79.4 | 22.9 | 77.0 |
| USC00385660 | Mccormick | McCormick | 33.9 | −82.3 | 154.5 | 100.0 |
| USC00385946 | Moncks Corner 4 N | Berkeley | 33.2 | −80.0 | 14.9 | 99.0 |
| USC00386114 | Mullins | Marion | 34.2 | −79.2 | 33.5 | 97.0 |
| USC00386153 | Myrtle Beach | Horry | 33.8 | −78.8 | 11.9 | 10.0 |
| USC00386209 | Newberry | Newberry | 34.3 | −81.6 | 156.4 | 99.0 |
| USC00386293 | Ninety Nine Is | Cherokee | 35.0 | −81.5 | 152.4 | 0.0 |
| USC00386297 | N Augusta 2.3 SSE | Aiken | 33.5 | −81.9 | 38.4 | 0.0 |
| USC00386298 | N Saluda Rsvr | Greenville | 35.1 | −82.4 | 335.3 | 0.0 |
| USC00386527 | Orangeburg 2 | Orangeburg | 33.5 | −80.9 | 56.4 | 99.0 |
| USC00386688 | Parr | Fairfield | 34.3 | −81.3 | 84.1 | 100.0 |
| USC00386775 | Pelion 0.8 NW | Lexington | 33.8 | −81.3 | 137.5 | 89.0 |
| USC00386831 | Pickens | Pickens | 34.9 | −82.7 | 327.7 | 99.0 |
| USC00386906 | Pontiac 2.1 NNW | Richland | 34.2 | −80.9 | 100.0 | 0.0 |
| USC00387561 | St Matthews 1 SE | Calhoun | 33.7 | −80.8 | 82.3 | 0.0 |
| USC00387590 | Salley 5.9 NNE | Aiken | 33.6 | −81.3 | 122.5 | 0.0 |
| USC00387631 | Saluda | Saluda | 34.0 | −81.8 | 146.3 | 97.0 |
| USC00387666 | Sandhill Rsch - Elgin | Richland | 34.1 | −80.9 | 134.1 | 94.0 |
| USC00387687 | Sandy Springs 2 NE | Anderson | 34.6 | −82.7 | 233.2 | 99.0 |
| USC00387722 | Santuck | Union | 34.6 | −81.5 | 158.5 | 100.0 |
| USC00387829 | Sharon 6 SSW | York | 34.8 | −81.4 | 172.2 | 0.0 |
| USC00387884 | Silverstreet 3.1SSE | Newberry | 34.2 | −81.7 | 112.2 | 0.0 |
| USC00388188 | Spartanburg 3 SSE | Spartanburg | 34.9 | −81.9 | 185.9 | 100.0 |
| USC00388405 | Sullivans Is | Charleston | 32.8 | −79.9 | 1.5 | 88.0 |
| USC00388426 | Summerville 4W | Dorchester | 33.0 | −80.2 | 19.8 | 100.0 |
| USC00388440 | Sumter | Sumter | 33.9 | −80.3 | 53.0 | 99.0 |
| USC00388472 | Table Rock | Pickens | 35.0 | −82.7 | 335.3 | 100.0 |
| USC00388473 | Table Rock Rsvr | Pickens | 35.1 | −82.7 | 384.0 | 0.0 |
| USC00388474 | Swansea 3.5 NE | Calhoun | 33.8 | −81.0 | 92.7 | 0.0 |
| USC00388706 | Travelers Rest 2NE | Greenville | 35.0 | −82.4 | 320.0 | 0.0 |
| USC00388786 | Union 8 S | Union | 34.6 | −81.7 | 137.2 | 100.0 |
| USC00388879 | Wagener 1SW | Aiken | 33.6 | −81.4 | 115.8 | 0.0 |
| USC00388887 | Walhalla | Oconee | 34.8 | −83.1 | 298.7 | 100.0 |
| USC00388922 | Walterboro 1 SW | Colleton | 32.9 | −80.7 | 17.1 | 100.0 |
| USC00388951 | Ware Shoals 2 | Greenwood | 34.4 | −82.2 | 189.0 | 0.0 |
| USC00388979 | Wateree Dam | Kershaw | 34.3 | −80.7 | 70.1 | 0.0 |
| USC00389327 | Winnsboro | Fairfield | 34.4 | −81.1 | 161.5 | 100.0 |
| USC00389350 | Winthrop Univ | York | 34.9 | −81.0 | 198.1 | 99.0 |
| USC00389469 | Yemassee 1 N | Hampton | 32.7 | −80.9 | 13.4 | 99.0 |
| USC00389625 | York 5 SSE | York | 34.9 | −81.2 | 201.2 | 100.0 |
| USW00003728 | Mcclellanville 7 NE | Charleston | 33.2 | −79.4 | 2.7 | 100.0 |
| USW00003858 | Eastover Mcentire Ang | Richland | 34.0 | −80.8 | 89.9 | 96.0 |
| USW00003870 | Greer | Spartanburg | 34.9 | −82.2 | 325.8 | 100.0 |
| USW00013717 | Myrtle Beach Afb | Horry | 33.7 | −78.9 | 7.9 | 99.0 |
| USW00013744 | Florence Rgnl AP | Florence | 34.2 | −79.7 | 43.0 | 100.0 |
| USW00013758 | Charleston Nas | Charleston | 32.9 | −79.9 | 2.1 | 0.0 |
| USW00013782 | Dwtn Charleston | Charleston | 32.8 | −79.9 | 3.0 | 100.0 |
| USW00013849 | Sumter Shaw Afb | Sumter | 34.0 | −80.5 | 74.1 | 98.0 |
| USW00013880 | Charleston Intl AP | Charleston | 32.9 | −80.0 | 11.9 | 100.0 |
| USW00013883 | Columbia | Lexington | 33.9 | −81.1 | 105.2 | 100.0 |
| USW00013886 | Greenville Dwtn AP | Greenville | 34.8 | −82.3 | 310.0 | 99.0 |
| USW00053850 | Clemson Oconee Co AP | Oconee | 34.7 | −82.9 | 271.0 | 96.0 |
| USW00053854 | Orangeburg Muni AP | Orangeburg | 33.5 | −80.9 | 59.1 | 100.0 |
| USW00053867 | Columbia Owens Dwtn AP | Richland | 34.0 | −81.0 | 54.9 | 100.0 |
| USW00053871 | Rock Hill York Co AP | York | 35.0 | −81.1 | 197.5 | 95.0 |
| USW00053874 | Greenwood Co AP | Greenwood | 34.3 | −82.2 | 188.1 | 98.0 |
| USW00063826 | Blackville 3 W | Barnwell | 33.4 | −81.3 | 96.6 | 100.0 |
| USW00093718 | N Myrtle Beach | Horry | 33.8 | −78.7 | 8.8 | 100.0 |
| USW00093804 | Spartanburg Wb AP | Spartanburg | 34.9 | −82.0 | 248.1 | 99.0 |
| USW00093831 | Beaufort Mcas | Beaufort | 32.5 | −80.7 | 11.3 | 93.0 |
| USW00093846 | Anderson Faa AP | Anderson | 34.5 | −82.7 | 233.8 | 100.0 |
Fuente: NOAA NCEI
11 Glosario, metodología y fuentes
Anomalía: diferencia entre el valor observado y su normal 1991–2020. Porcentaje de lo normal: acumulado observado dividido entre el normal, por 100. Récord de estación: valor diario más extremo del mismo mes en todos los años previos del registro (al menos 20 años).
Temperatura: CPC_TEMP (malla diaria de 0.5°); la temperatura media es (Tmáx + Tmín)/2. Precipitación: CHIRPS. Los promedios estatales, regionales y por condado se ponderan por el área de cada celda dentro de cada polígono. Los condados son menores que dos celdas de la malla de temperatura de 0.5°, por lo que los mapas de temperatura, los días con helada y las tablas de anexos se presentan por región; las regiones son las divisiones climáticas de NOAA NCEI, con cada condado en la división de su centroide. Las normales corresponden a 1991-2020; la posición en la serie compara valores redondeados a un decimal. Estaciones: GHCN-Daily (NOAA NCEI), estaciones cooperativas y de primer orden; se descartan los datos marcados por su control de calidad, los valores diarios a más de 5 desviaciones robustas de la mediana de la estación y las variables cuya anomalía mensual difiere más de 3 °C de la del análisis en malla. Los promedios requieren al menos 80 % de días con datos y las normales de estación al menos 20 años completos. Este reporte se genera automáticamente y no sustituye la información oficial del National Weather Service ni del climatólogo estatal.
| Fuente | Producto | Licencia | Cita |
|---|---|---|---|
| UCSB Climate Hazards Center | CHIRPS v3.0, 0.05° | See provider terms | Climate Hazards Center, UC Santa Barbara. CHIRPS v3.0. |
| NOAA CPC | ONI, Niño-region SST indices (OISST v2.1), NAO and AO | Public domain (NOAA) | NOAA Climate Prediction Center climate indices. |
| NOAA CPC / PSL | CPC Global Unified Gauge-Based Analysis of Daily Precipitation, 0.5° | Public domain (NOAA) | CPC Global Unified Precipitation data provided by NOAA PSL, Boulder, CO, USA. |
| NOAA CPC / PSL | CPC Global Unified Temperature, daily 0.5° | Public domain (NOAA) | CPC Global Unified Temperature data provided by NOAA PSL, Boulder, CO, USA. |
| NOAA NCEI / PSL | Extended Reconstructed SST v5 (ERSST v5), 2° | Public domain (NOAA) | Huang et al. (2017), J. Climate, doi:10.1175/JCLI-D-16-0836.1 |
| GDACS | Global Disaster Alert and Coordination System event list | See provider terms | — |
| NOAA NCEI | GHCN-Daily | Public domain (NOAA) | Menne et al. (2012), J. Atmos. Oceanic Technol., doi:10.1175/JTECH-D-11-00103.1 |
| NOAA NCEI | IBTrACS v04r01 tropical-cyclone best tracks | Public domain (NOAA) | Knapp et al. (2010), Bull. Amer. Meteor. Soc., doi:10.1175/2009BAMS2755.1 |
| NOAA NCEI | Pacific Decadal Oscillation index (ERSST v5) | Public domain (NOAA) | — |
| NOAA CPC | North American Multi-Model Ensemble (NMME) tercile probabilities, 1° | Public domain (NOAA) | Kirtman et al. (2014), Bull. Amer. Meteor. Soc., doi:10.1175/BAMS-D-12-00050.1 |
| National Drought Mitigation Center, USDA, NOAA | U.S. Drought Monitor, weekly maps and area statistics | Free to use with credit (NDMC) | The U.S. Drought Monitor is jointly produced by the National Drought Mitigation Center at the University of Nebraska-Lincoln, the United States Department of Agriculture and the National Oceanic and Atmospheric Administration. Map courtesy of NDMC. |
| US Census Bureau TIGERweb | US Census Bureau, TIGERweb counties (generalised) | Public domain (US Government work) | — |
Generado por ClimaBulletin (climabulletin.org), código abierto. Preguntas y comentarios: [email protected].