Illinois · Annual
Year 2025
Downloads
1 Key messages and climate synopsis
Source: NOAA NCEI
Source: NOAA NCEI
2 Global and regional climate drivers
Sea-surface temperature anomaly, Year 2025 (°C, 1991–2020)
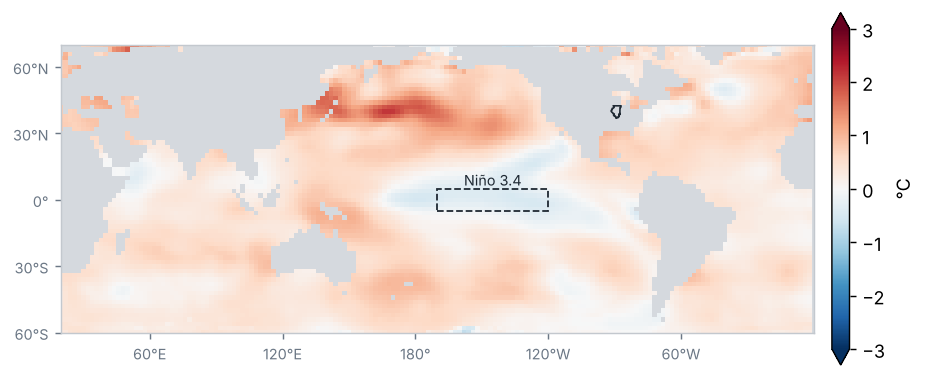
Source: NOAA NCEI / PSL
Sea-surface temperature anomaly in the Niño regions (°C)
| Region | Anomaly (°C) | Change from preceding period (°C) |
|---|---|---|
| Niño 1+2 | 0.2 | 0.3 |
| Niño 3 | −0.2 | −0.5 |
| Niño 3.4 | −0.3 | −0.7 |
| Niño 4 | −0.2 | −0.8 |
Mean of the months in the period (OISST v2.1)
Source: NOAA CPC
La Niña conditions of weak intensity: the Oceanic Niño Index (ONI) for OND 2025 was −0.6 °C.
Source: NOAA CPC
Monthly Niño 3.4 anomaly, last 24 months (°C)
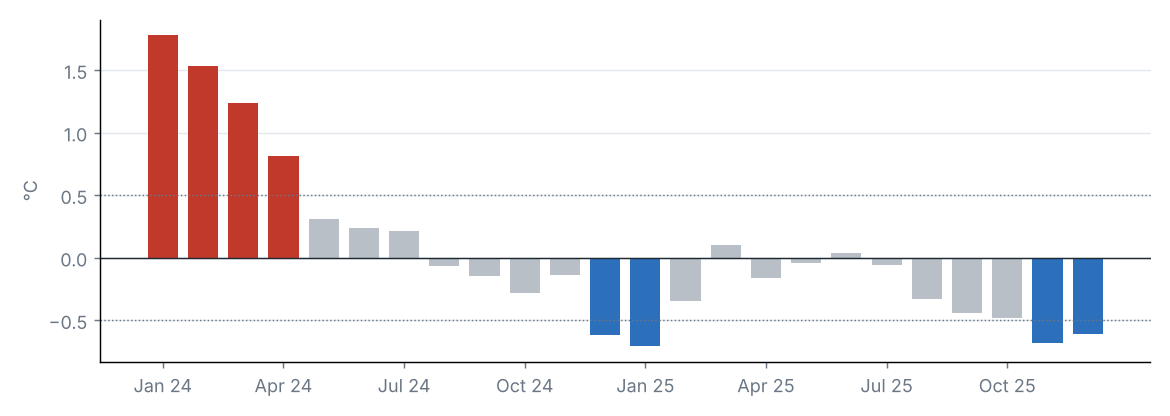
Source: NOAA CPC
Teleconnection indices
| Index | Value | Phase |
|---|---|---|
| NAO | 0.0 | Neutral |
| AO | 0.2 | Neutral |
| PDO | −2.0 | Negative |
North Atlantic Oscillation (NAO); Arctic Oscillation (AO); Pacific Decadal Oscillation (PDO).
Source: NOAA CPC, NOAA NCEI
The Niño 3.4 anomaly was −0.31 °C (−0.71 °C relative to the preceding period).
Other indices: NAO +0.02 (neutral phase); AO +0.20 (neutral phase); PDO −1.99 (negative phase).
3 Precipitation
Source: NOAA NCEI
Accumulated precipitation
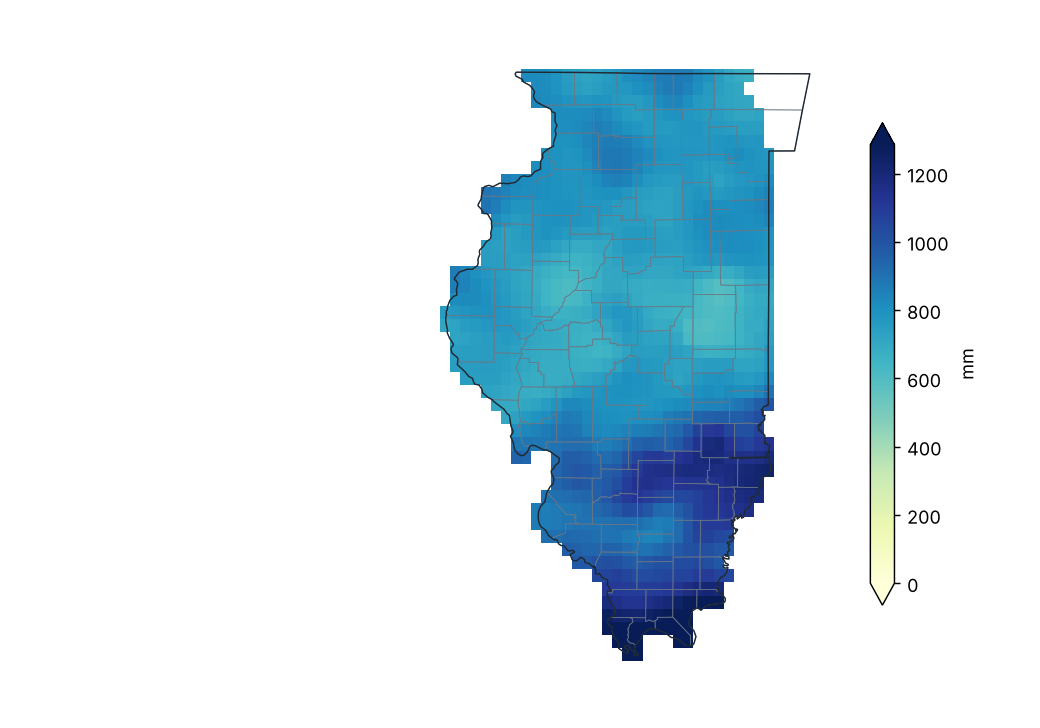
Source: NOAA NCEI
Percent of normal precipitation (1991–2020)
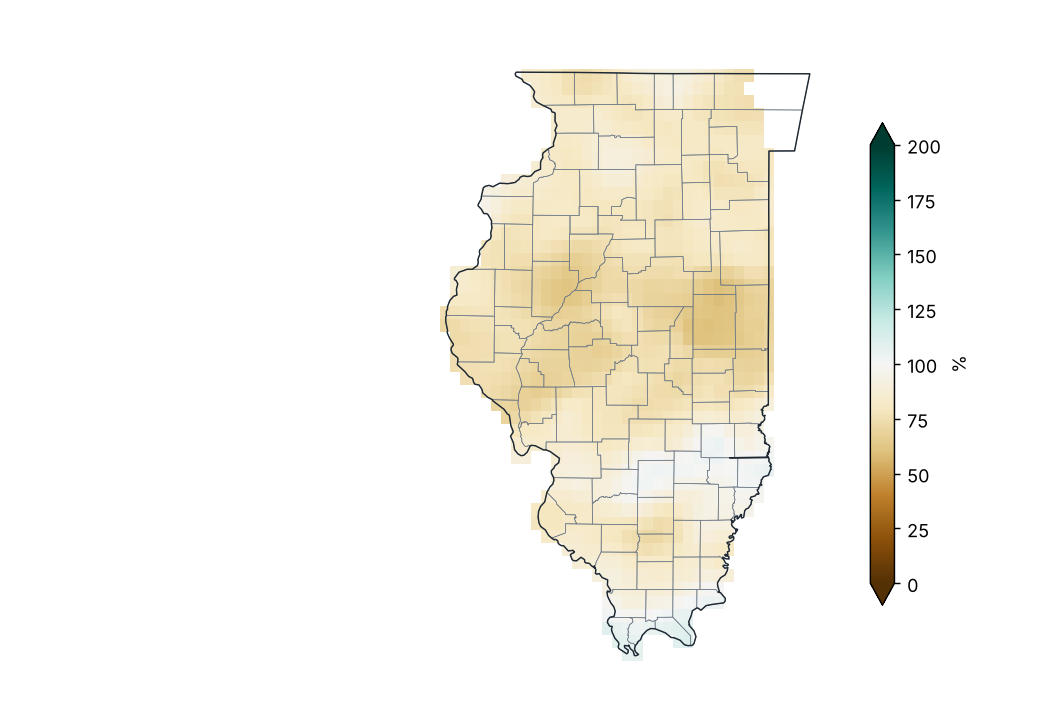
Source: NOAA NCEI
Percent of normal by county
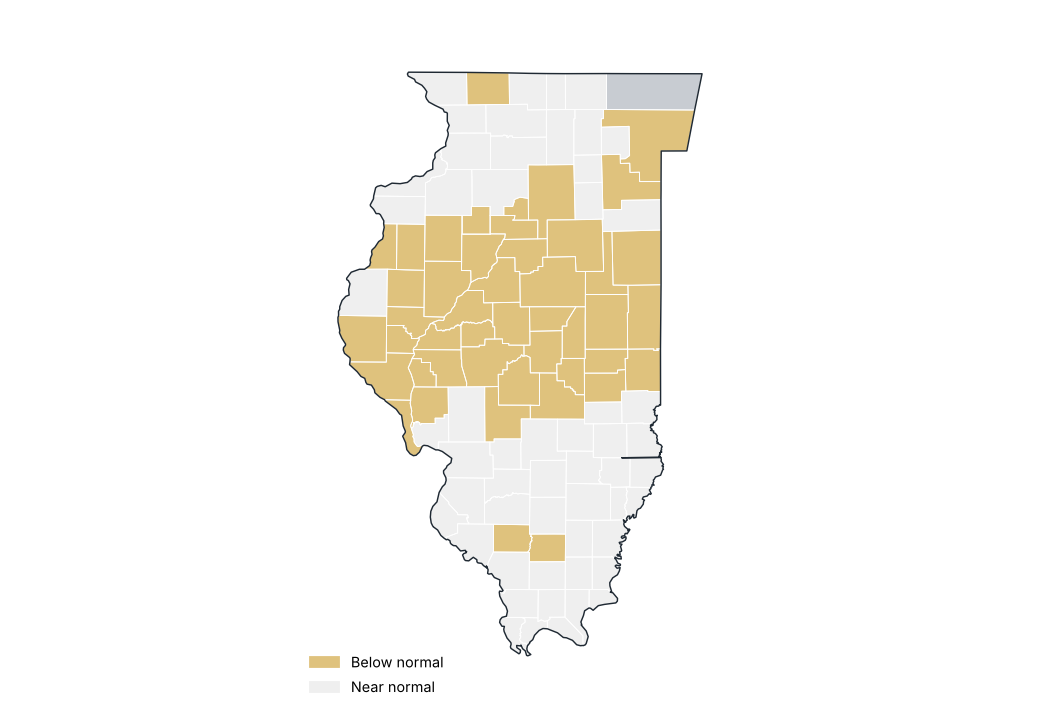
Source: NOAA NCEI
Precipitation by region
| Region | Total (mm) | Normal (mm) | Difference (%) | Category |
|---|---|---|---|---|
| Northwest | 804.7 | 968.8 | −16.9 | Near normal |
| Northeast | 771.9 | 960.4 | −19.6 | Near normal |
| West | 742.2 | 986.8 | −24.8 | Below normal |
| Central | 712.5 | 974.3 | −26.9 | Below normal |
| East | 717.9 | 992.8 | −27.7 | Below normal |
| West Southwest | 784.2 | 1020.0 | −23.1 | Below normal |
| East Southeast | 953.3 | 1103.5 | −13.6 | Near normal |
| Southwest | 1022.9 | 1148.3 | −10.9 | Near normal |
| Southeast | 1075.3 | 1205.6 | −10.8 | Near normal |
Source: NOAA NCEI
Stations with the largest precipitation excess
| Region | County | Station | Altitude (m) | Anomaly (%) |
|---|---|---|---|---|
| Southeast | Pope | Smithland L&D | 109.0 | 18.9 |
| Southwest | Pulaski | Olmsted L&D | 114.0 | 15.7 |
| East Southeast | Marion | Centralia | 148.0 | 10.5 |
| East Southeast | Jasper | Newton | 162.0 | 7.7 |
| Northwest | Rock Island | Illinois City Dam 16 | 168.0 | 6.0 |
| East Southeast | Lawrence | Lawrenceville 2WSW | 138.0 | 5.3 |
| East Southeast | Lawrence | Lawrenceville Vincennes Intl A | 130.0 | 4.0 |
| Southeast | Franklin | W Frankfort | 131.0 | 3.4 |
| East Southeast | Clay | Flora | 147.0 | 2.5 |
| East Southeast | Marion | Salem | 168.0 | 2.0 |
Source: NOAA NCEI
Stations with the largest precipitation deficit
| Region | County | Station | Altitude (m) | Anomaly (%) |
|---|---|---|---|---|
| East | Ford | Paxton | 243.0 | −59.6 |
| East | Champaign | Champaign Urbana Willard AP | 226.0 | −48.7 |
| East Southeast | Moultrie | Sullivan 3S | 195.0 | −42.4 |
| East | Champaign | Rantoul | 226.0 | −41.5 |
| Central | Tazewell | Mackinaw 3WSW | 202.0 | −41.3 |
| East | Champaign | Champaign 3S | 220.0 | −40.3 |
| East | Vermilion | Danville Sewage Plt | 163.0 | −39.2 |
| East | Vermilion | Sidell 4N | 205.0 | −37.1 |
| Central | De Witt | Clinton 1SSW | 212.0 | −36.6 |
| East | Champaign | Fisher | 220.0 | −35.8 |
Source: NOAA NCEI
Largest 24-hour rainfall at stations
| Station | County | Max 24 h rainfall (mm) | Date |
|---|---|---|---|
| Shabbona 3S | DeKalb | 152.4 | 2025-08-19 |
| Salem | Marion | 150.1 | 2025-04-05 |
| Paw Paw 2S | Lee | 148.8 | 2025-08-19 |
| Centralia | Marion | 124.7 | 2025-04-05 |
| Lawrenceville 2WSW | Lawrence | 115.6 | 2025-04-05 |
| Waltonville | Jefferson | 113.8 | 2025-04-05 |
| Newton | Jasper | 112.5 | 2025-04-04 |
| 1 ENE Fairfield | Wayne | 112.3 | 2025-04-05 |
| Flora 2 | Clay | 111.5 | 2025-04-05 |
| Kaskaskia Rvr Navigation Lock | Randolph | 111.5 | 2025-04-05 |
Source: NOAA NCEI
Statewide precipitation in each year
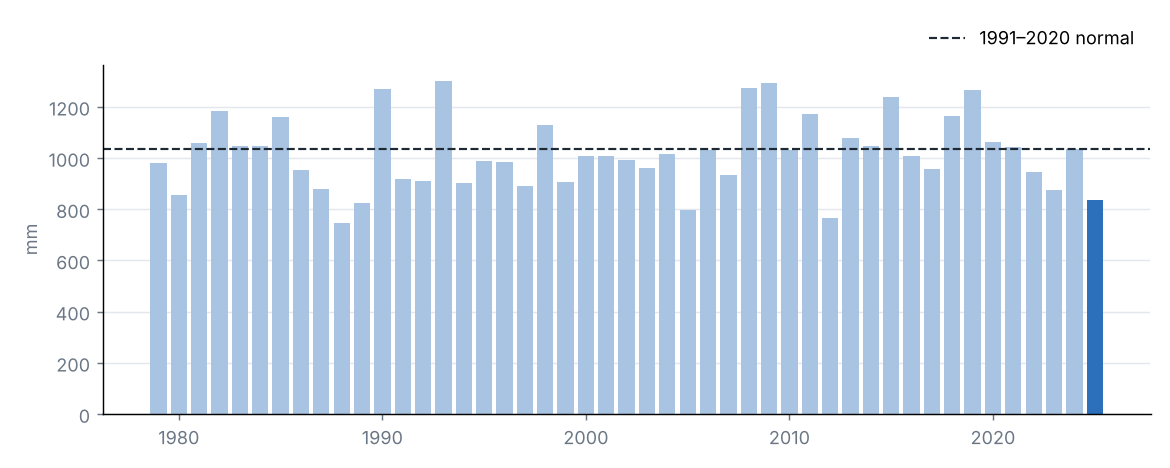
Source: NOAA NCEI
Monthly precipitation and 1991–2020 normal
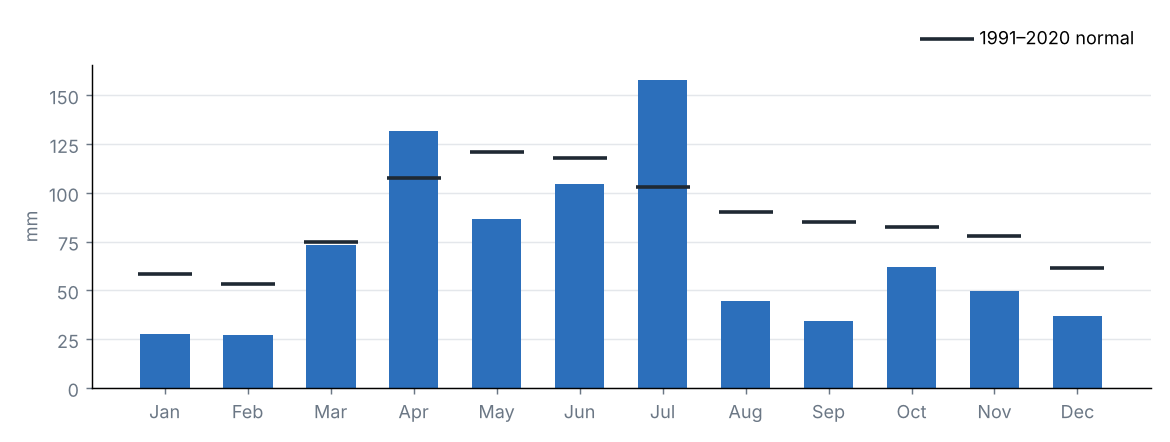
Source: NOAA NCEI
Statewide accumulated precipitation was 836.7 mm, 81% of the 1991–2020 average (1034.5 mm), category “Near normal”. It was the 5th driest year in the 1979–2025 series.
The region with the highest percentage of normal was Southeast (89%) and the lowest was East (72%).
Source: NOAA NCEI
4 Temperature
Source: NOAA NCEI
Mean temperature
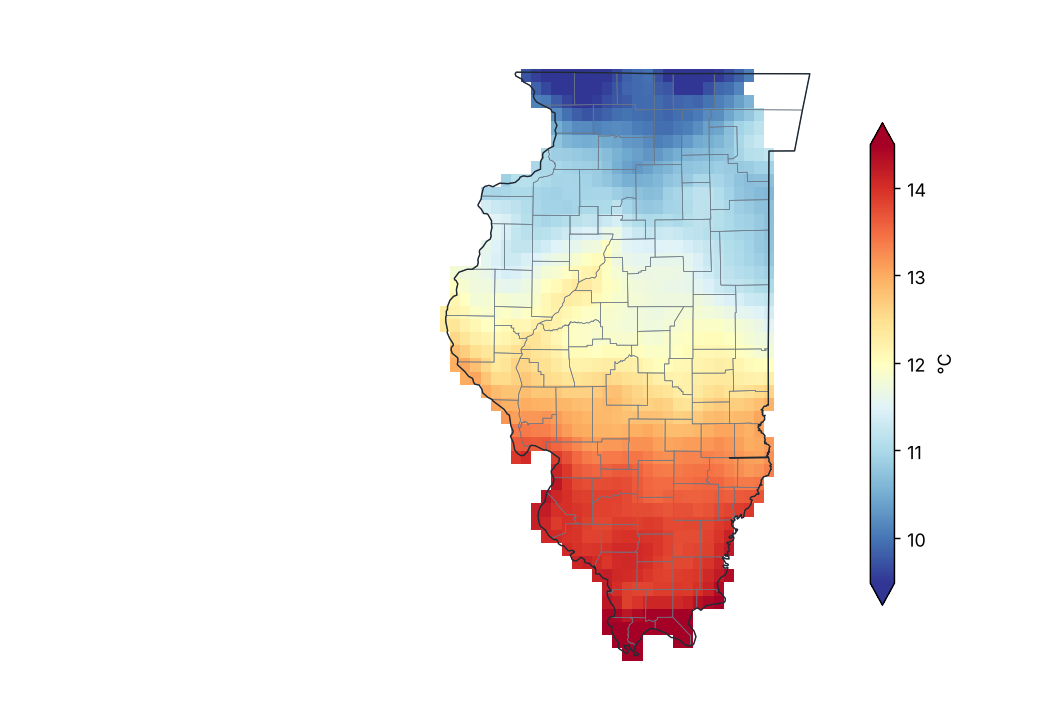
Source: NOAA NCEI
Mean temperature anomaly (1991–2020)
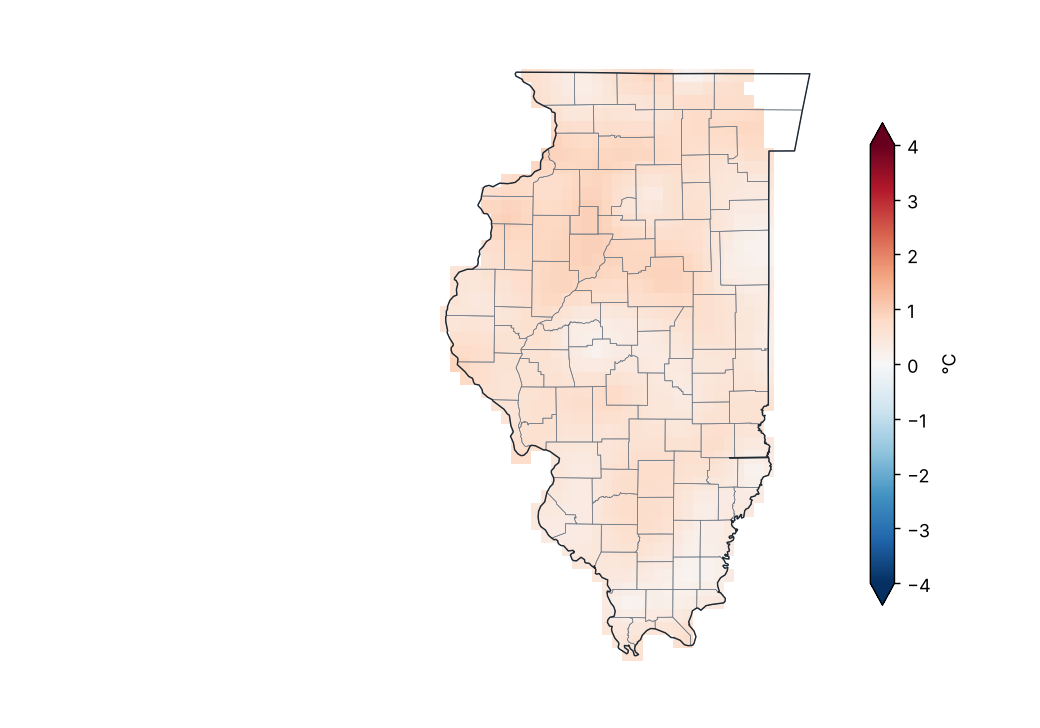
Source: NOAA NCEI
Mean temperature anomaly by region
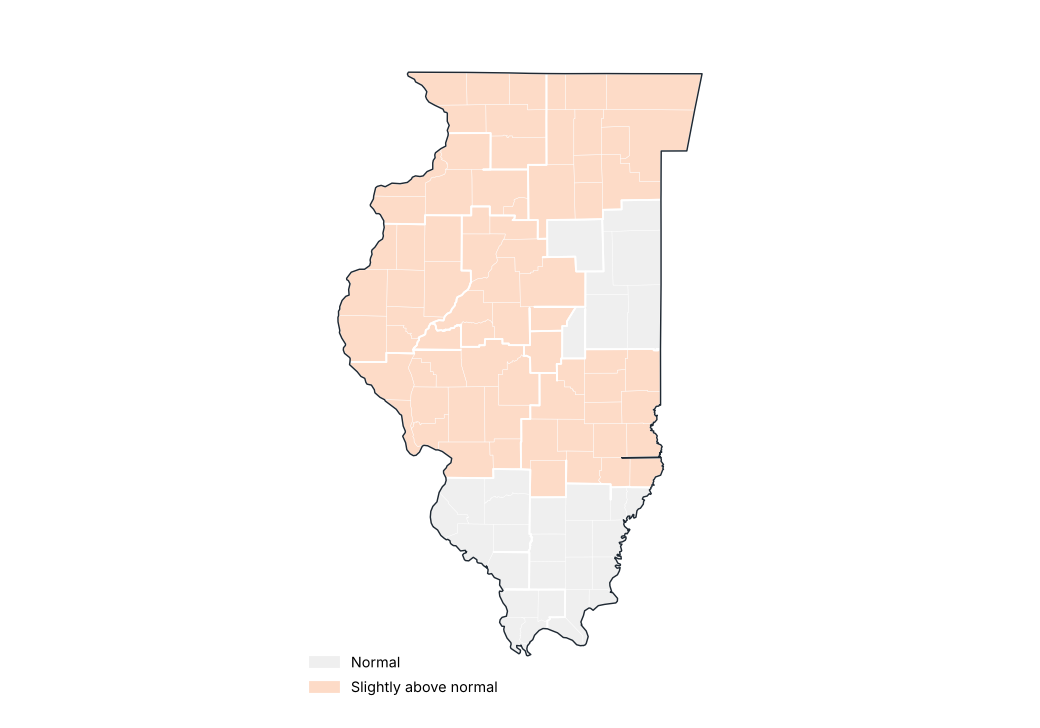
Source: NOAA NCEI
Stations with the largest positive anomaly
| Region | County | Station | Altitude (m) | Anomaly (°C) |
|---|---|---|---|---|
| West Southwest | Christian | Morrisonville | 192.0 | 2.1 |
| Southwest | Perry | Du Quoin 4 SE | 128.0 | 1.9 |
| Northwest | Whiteside | Fulton L&D #13 | 180.0 | 1.3 |
| West Southwest | Jersey | Jerseyville 2 SW | 186.0 | 1.2 |
| Northwest | Mercer | Aledo | 224.0 | 1.2 |
| West | Warren | Monmouth 4NW | 221.0 | 1.1 |
| Northwest | Jo Daviess | Elizabeth | 206.0 | 1.0 |
| Northwest | Bureau | Walnut | 213.0 | 1.0 |
| West Southwest | Morgan | Jacksonville 2E | 186.0 | 1.0 |
| West | Henderson | Gladstone L/D 18 | 164.0 | 1.0 |
Source: NOAA NCEI
Stations with the largest negative anomaly
| Region | County | Station | Altitude (m) | Anomaly (°C) |
|---|---|---|---|---|
| East Southeast | Lawrence | Lawrenceville 2WSW | 138.0 | −0.5 |
| Northeast | LaSalle | Ottawa 4SW | 166.0 | −0.2 |
| Central | Macon | Decatur Wtp | 195.0 | −0.2 |
| Northwest | Jo Daviess | Stockton 3NNE | 296.0 | −0.1 |
| East Southeast | Shelby | Windsor | 210.0 | −0.0 |
| East Southeast | Douglas | Tuscola | 198.0 | −0.0 |
Source: NOAA NCEI
Monthly statewide mean temperature anomaly
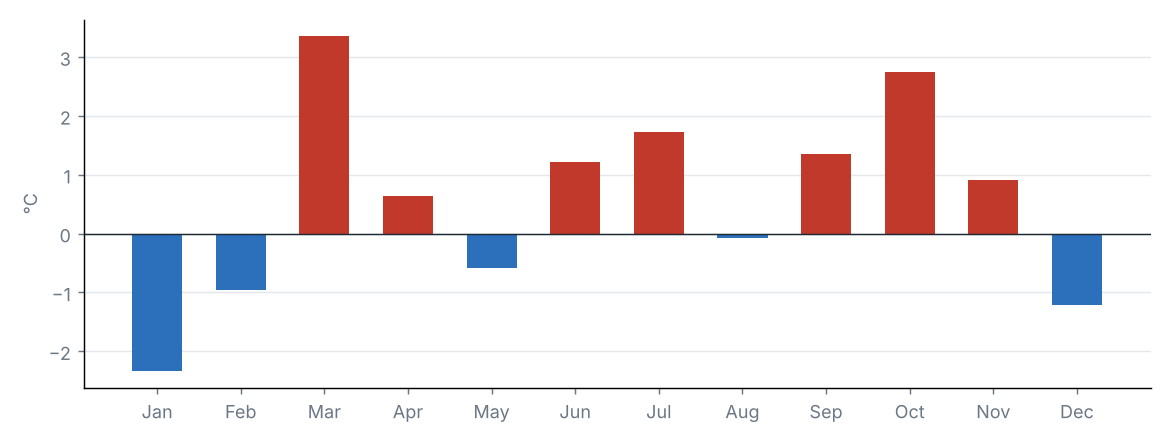
Source: NOAA NCEI
Statewide mean temperature anomaly in each year
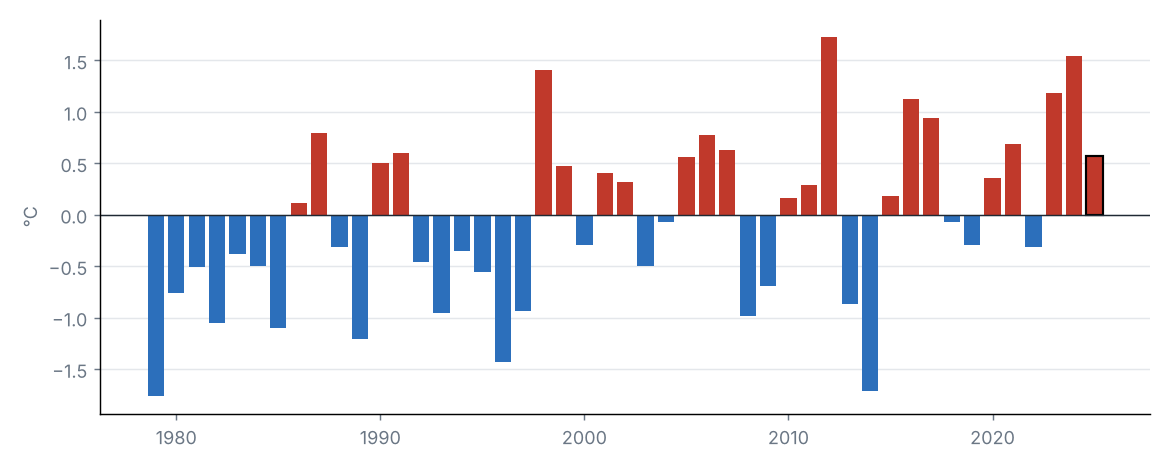
Source: NOAA NCEI
The statewide mean temperature was 12.1 °C, 0.6 °C above the 1991–2020 average (11.5 °C), category “Slightly above normal”. It was the 10th warmest year in the 1979–2025 series (tied with 1991, 2005, 2007).
By region, the largest anomaly was in Northwest (+0.7 °C) and the smallest in Southeast (+0.4 °C).
Source: NOAA NCEI
Source: NOAA NCEI
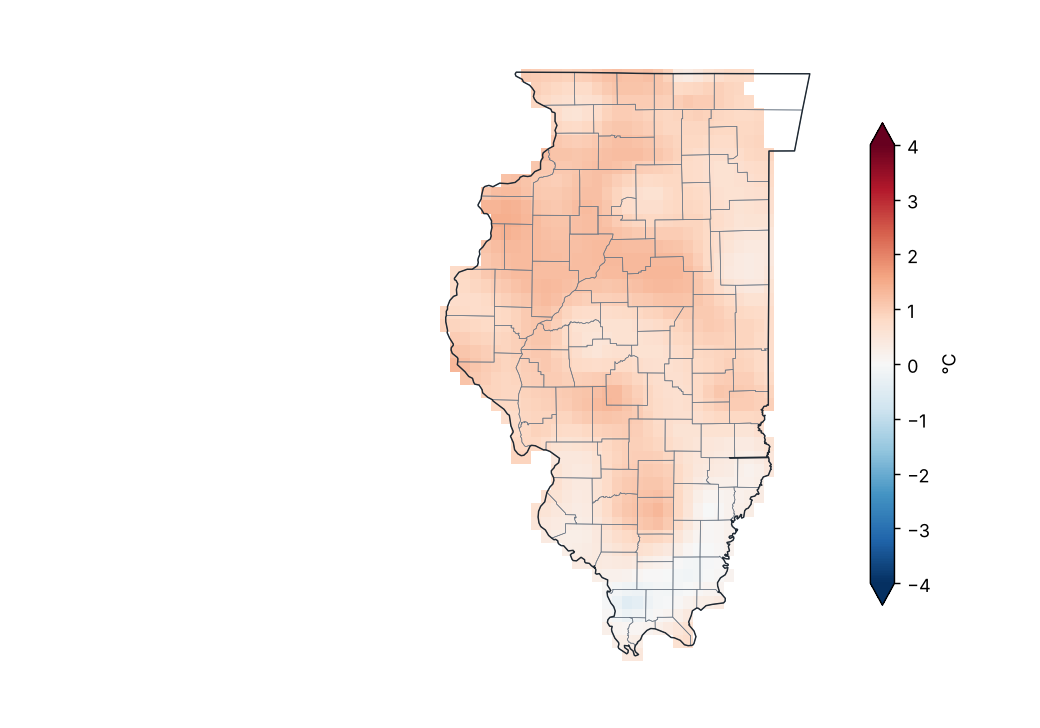
Maximum temperature anomaly (1991–2020)
Source: NOAA NCEI
Lowest and highest monthly mean maximum temperature by region
| Region | Lowest value (°C) | Station | Highest value (°C) | Station |
|---|---|---|---|---|
| Northwest | 15.1 | Stockton 3NNE | 17.4 | Hennepin |
| Northeast | 14.4 | Chicago Northerly Is | 17.4 | Joliet |
| West | 16.7 | Galesburg | 18.7 | Quincy Dam 21 |
| Central | 17.1 | Decatur Wtp | 18.6 | Decatur AP |
| East | 16.5 | Dwight Wwtp | 18.7 | Sidell 4N |
| West Southwest | 18.0 | Springfield Abraham Lincoln Ca | 19.7 | Hillsboro |
| East Southeast | 17.5 | Tuscola | 19.9 | Flora |
| Southwest | 19.2 | Carlyle Rsvr | 21.2 | Cairo 3N |
| Southeast | 18.7 | Harrisburg | 21.2 | Dixon Springs Agric Ctr |
Station monthly means (GHCN-Daily, ≥ 80% of days with data).
Source: NOAA NCEI
The statewide maximum temperature was 17.9 °C, 0.8 °C above the 1991–2020 average (17.1 °C), category “Slightly above normal”. It was the 9th warmest year in the 1979–2025 series (tied with 2006, 2007).
By region, the largest anomaly was in West (+1.1 °C) and the smallest in Southeast (+0.3 °C).
Source: NOAA NCEI
Source: NOAA NCEI
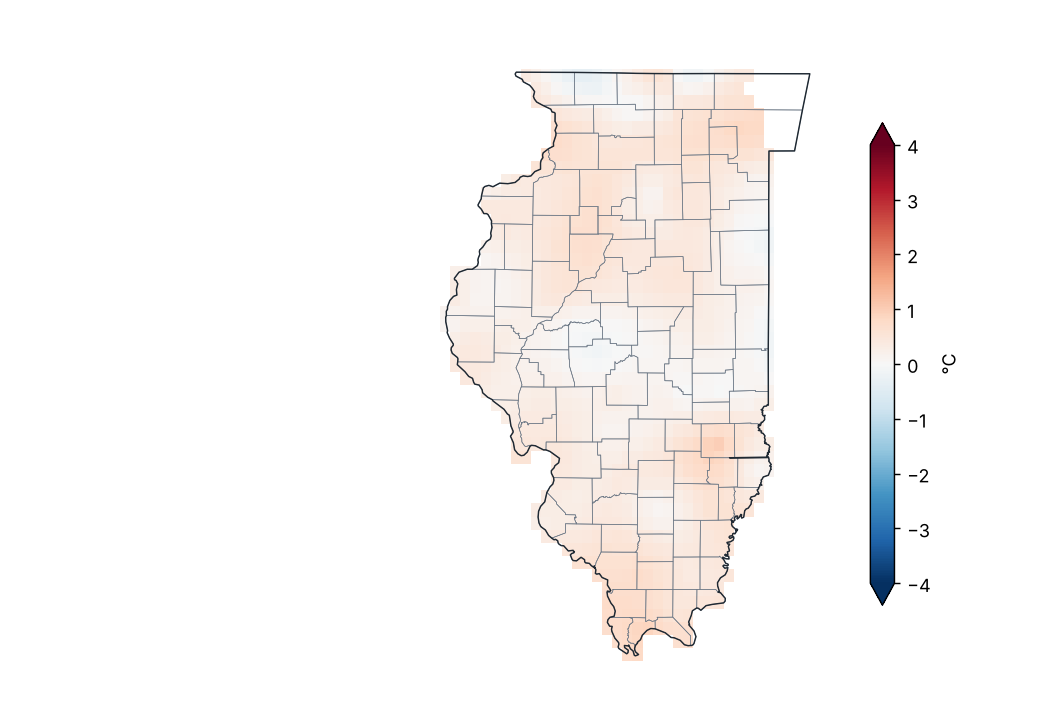
Minimum temperature anomaly (1991–2020)
Source: NOAA NCEI
Lowest and highest monthly mean minimum temperature by region
| Region | Lowest value (°C) | Station | Highest value (°C) | Station |
|---|---|---|---|---|
| Northwest | 2.8 | Stockton 3NNE | 6.1 | Rock Is L&D 15 |
| Northeast | 3.3 | Shabbona 5 NNE | 7.5 | Chicago Midway AP |
| West | 4.3 | Avon | 7.2 | Quincy Dam 21 |
| Central | 4.6 | Congerville 2NW | 6.9 | Decatur AP |
| East | 4.4 | Dwight Wwtp | 6.9 | Sidell 4N |
| West Southwest | 6.0 | Jacksonville 2E | 8.0 | Alton - Melvin Price L&D |
| East Southeast | 5.2 | Casey | 8.3 | Newton |
| Southwest | 7.8 | Carbondale Sewage Plt | 11.0 | Cairo 3N |
| Southeast | 6.6 | Harrisburg | 9.2 | Dixon Springs Agric Ctr |
Station monthly means (GHCN-Daily, ≥ 80% of days with data).
Source: NOAA NCEI
The statewide minimum temperature was 6.3 °C, 0.3 °C above the 1991–2020 average (5.9 °C), category “Normal”. It was the 13th warmest year in the 1979–2025 series (tied with 1990, 2005, 2007).
By region, the largest anomaly was in Southwest (+0.5 °C) and the smallest in East (+0.2 °C).
Source: NOAA NCEI
5 Climate extremes and records
Source: NOAA NCEI
Highest maximum temperature by county
| County | Station | Temperature (°C) | Date |
|---|---|---|---|
| Champaign | Ogden | 37.8 | 2025-08-17 |
| Christian | Morrisonville | 37.8 | 2025-09-15 |
| Clay | Flora | 37.8 | 2025-09-15 |
| Coles | Charleston | 37.2 | 2025-09-14 |
| Franklin | Rend Lake Dam | 37.2 | 2025-08-16 |
| Jefferson | Mt Vernon 3 NE | 37.2 | 2025-08-16 |
| Macon | Decatur AP | 37.2 | 2025-09-14 |
| Madison | Alton - Melvin Price L&D | 37.2 | 2025-09-14 |
| Marion | Salem | 37.2 | 2025-09-15 |
| Mercer | New Boston Dam 17 | 37.2 | 2025-09-15 |
| Rock Island | Rock Is L&D 15 | 37.2 | 2025-08-15 |
| St. Clair | Belleville Siu Rsch | 37.0 | 2025-09-14 |
| Clinton | Carlyle Rsvr | 36.7 | 2025-09-15 |
| Hancock | Bentley | 36.7 | 2025-09-14 |
| Henderson | Gladstone L/D 18 | 36.7 | 2025-09-15 |
| Jackson | Carbondale Sthrn Illinois AP | 36.7 | 2025-08-19 |
| Jersey | Jerseyville 2 SW | 36.7 | 2025-09-15 |
| Lawrence | Lawrenceville Vincennes Intl A | 36.7 | 2025-06-23 |
| Menard | Petersburg 1E | 36.7 | 2025-06-27 |
| Montgomery | Hillsboro | 36.7 | 2025-09-15 |
The 20 most extreme of 69.
Source: NOAA NCEI
Lowest minimum temperature by county
| County | Station | Temperature (°C) | Date |
|---|---|---|---|
| Sangamon | Springfield Abraham Lincoln Ca | −28.8 | 2025-01-21 |
| Champaign | Champaign 9 SW | −26.7 | 2025-12-14 |
| Jo Daviess | Elizabeth | −26.7 | 2025-01-25 |
| Bureau | Walnut | −26.1 | 2025-01-21 |
| McHenry | Mchenry Stratton Lock/Dam | −26.1 | 2025-02-18 |
| Carroll | Mt Carroll | −25.6 | 2025-02-18 |
| Kane | Chicago Aurora Muni AP | −25.6 | 2025-12-04 |
| Lee | Paw Paw 2S | −25.6 | 2025-01-21 |
| Macon | Decatur AP | −25.6 | 2025-12-14 |
| Warren | Monmouth 4NW | −25.6 | 2025-01-21 |
| Whiteside | Morrison | −25.6 | 2025-01-21 |
| DeKalb | De Kalb | −25.0 | 2025-01-22 |
| Douglas | Tuscola | −25.0 | 2025-12-15 |
| Fulton | Avon | −25.0 | 2025-01-21 |
| Knox | Galesburg | −25.0 | 2025-01-22 |
| Logan | Lincoln | −25.0 | 2025-12-14 |
| Mercer | Aledo | −25.0 | 2025-01-22 |
| Stephenson | Freeport Wwtp | −25.0 | 2025-01-21 |
| Woodford | Minonk | −25.0 | 2025-01-20 |
| Hancock | La Harpe | −24.4 | 2025-01-21 |
The 20 most extreme of 69.
Source: NOAA NCEI
Station records broken
| Station | County | Variable | New value | Date | Previous record | Previous date |
|---|---|---|---|---|---|---|
| Lawrenceville 2WSW | Lawrence | Highest 24 h rainfall | 115.6 | 2025-04-05 | 109.7 | 1995-05-18 |
| Shabbona 3S | DeKalb | Highest 24 h rainfall | 152.4 | 2025-08-19 | 143.5 | 2008-09-13 |
Most extreme daily value of the period against the same period in all earlier years of record (at least 20 years; for weeks, the same calendar month).
Source: NOAA NCEI
Climate-extremes indices (statewide mean)
| Index | Description | Value | Normal | Difference | Unit |
|---|---|---|---|---|---|
| TX90p | Warm days (Tmax > 90th percentile) | 15.2 | 10.0 | 5.2 | % |
| TN90p | Warm nights (Tmin > 90th percentile) | 12.5 | 10.0 | 2.5 | % |
| TX10p | Cool days (Tmax < 10th percentile) | 8.6 | 10.0 | −1.4 | % |
| TN10p | Cold nights (Tmin < 10th percentile) | 9.8 | 10.0 | −0.2 | % |
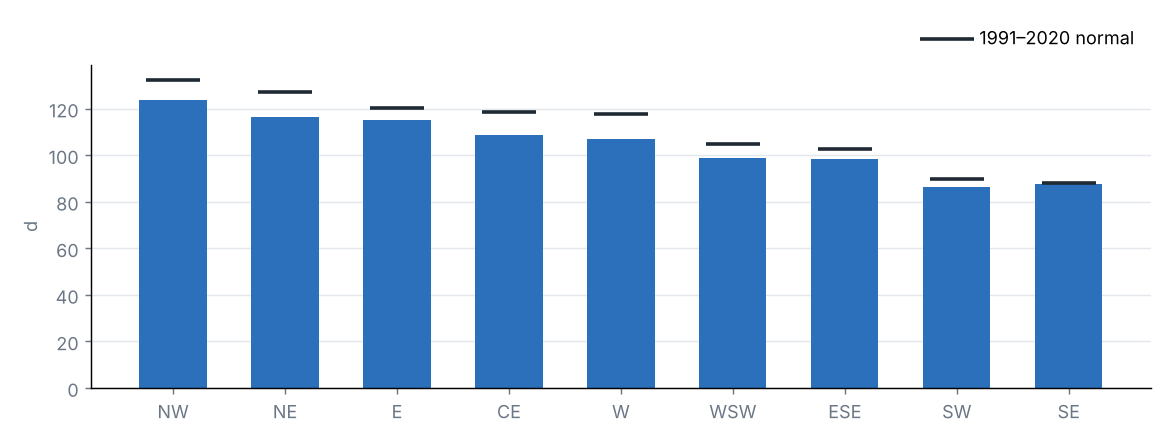
| FD | Frost days (Tmin < 0 °C) | 105.4 | 112.2 | −6.7 | d |
| SU | Summer days (Tmax > 25 °C) | 135.8 | 122.1 | 13.6 | d |
| TR | Tropical nights (Tmin > 20 °C) | 38.5 | 24.7 | 13.8 | d |
| WSDI | Warm spell days (≥ 6 days) | 17.3 | — | — | d |
| CSDI | Cold spell days (≥ 6 days) | 10.5 | — | — | d |
| Rx1day | Maximum 1-day precipitation | 57.6 | 59.9 | −2.3 | mm |
| Rx5day | Maximum 5-day precipitation | 100.2 | 103.9 | −3.7 | mm |
| CDD | Consecutive dry days (< 1 mm) | 19.3 | 19.0 | 0.2 | d |
| CWD | Consecutive wet days (≥ 1 mm) | 5.7 | 6.3 | −0.6 | d |
Percentile indices relative to calendar-day percentiles of 1991–2020 (5-day window); counts and maxima averaged over the state's grid cells.
Source: NOAA NCEI
Frost days by region
Source: NOAA NCEI
Heat and cold waves
| Dates | Type | Details |
|---|---|---|
| 2025-01-20 – 2025-01-22 | Cold wave | Up to 100% of the state below the 10th percentile of Tmin. Regions: Northwest, Northeast, West, Central, East, West Southwest, East Southeast, Southwest and Southeast. |
| 2025-02-18 – 2025-02-22 | Cold wave | Up to 100% of the state below the 10th percentile of Tmin. Regions: Northwest, Northeast, West, Central, East, West Southwest, East Southeast, Southwest and Southeast. |
| 2025-03-11 – 2025-03-15 | Heat wave | Up to 100% of the state above the 90th percentile of Tmax. Regions: Northwest, Northeast, West, Central, East, West Southwest, East Southeast, Southwest and Southeast. |
| 2025-06-22 – 2025-06-27 | Heat wave | Up to 93% of the state above the 90th percentile of Tmax. Regions: Northwest, Northeast, West, Central, East, West Southwest, East Southeast and Southeast. |
| 2025-08-16 – 2025-08-19 | Heat wave | Up to 100% of the state above the 90th percentile of Tmax. Regions: Northwest, Northeast, West, Central, East, West Southwest, East Southeast, Southwest and Southeast. |
| 2025-08-25 – 2025-08-29 | Cold wave | Up to 100% of the state below the 10th percentile of Tmin. Regions: Northwest, Northeast, West, Central, East, West Southwest, East Southeast, Southwest and Southeast. |
| 2025-09-04 – 2025-09-09 | Cold wave | Up to 100% of the state below the 10th percentile of Tmin. Regions: Northwest, Northeast, West, Central, East, West Southwest, East Southeast, Southwest and Southeast. |
| 2025-09-14 – 2025-09-19 | Heat wave | Up to 94% of the state above the 90th percentile of Tmax. Regions: Northwest, Northeast, West, Central, East, West Southwest, East Southeast, Southwest and Southeast. |
| 2025-09-28 – 2025-10-07 | Heat wave | Up to 100% of the state above the 90th percentile of Tmax. Regions: Northwest, Northeast, West, Central, East, West Southwest, East Southeast, Southwest and Southeast. |
| 2025-12-24 – 2025-12-29 | Heat wave | Up to 100% of the state above the 90th percentile of Tmax. Regions: Northwest, Northeast, West, Central, East, West Southwest, East Southeast, Southwest and Southeast. |
Wave: at least 3 consecutive days with at least half of the state above the 90th percentile of maximum temperature (heat) or below the 10th percentile of minimum temperature (cold). At most the 10 most intense are listed.
Source: NOAA NCEI
6 Drought
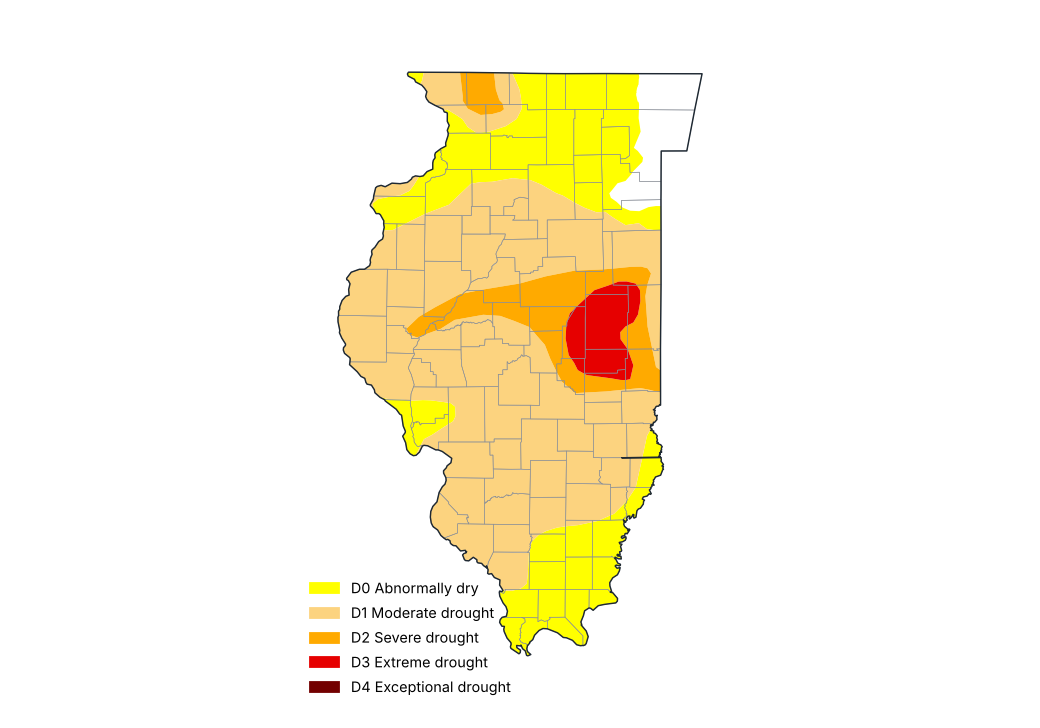
U.S. Drought Monitor, 30 December 2025
Source: National Drought Mitigation Center, USDA, NOAA
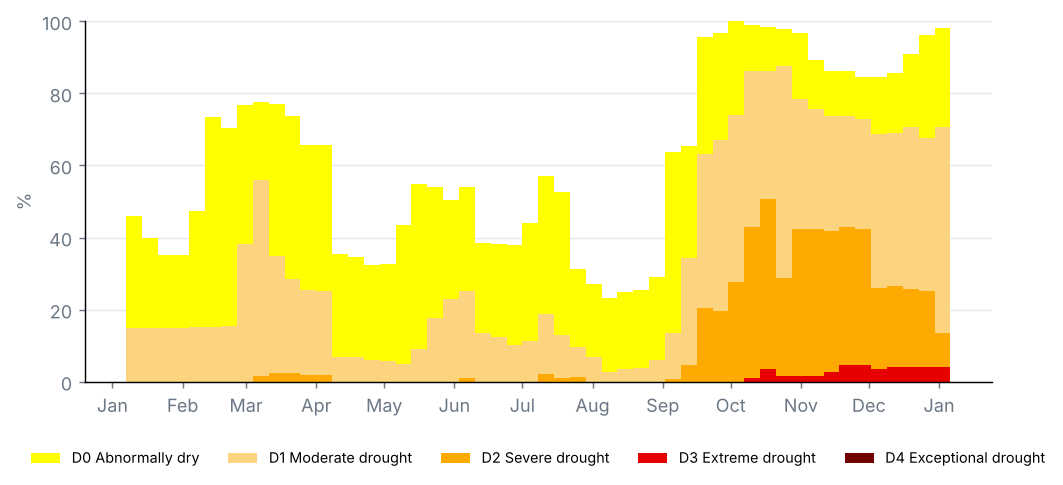
Share of the state by drought category, weekly U.S. Drought Monitor maps (%)
Source: National Drought Mitigation Center, USDA, NOAA
Counties with the most severe drought, U.S. Drought Monitor of 30 December 2025 (% of the county)
| County | D0–D4 (%) | D1–D4 (%) | D2–D4 (%) | D3–D4 (%) | D4 (%) |
|---|---|---|---|---|---|
| Douglas | 100.0 | 100.0 | 100.0 | 100.0 | 0.0 |
| Champaign | 100.0 | 100.0 | 100.0 | 94.8 | 0.0 |
| Piatt | 100.0 | 100.0 | 100.0 | 84.7 | 0.0 |
| Ford | 100.0 | 100.0 | 69.7 | 25.0 | 0.0 |
| Vermilion | 100.0 | 100.0 | 60.3 | 19.3 | 0.0 |
| Coles | 100.0 | 100.0 | 65.7 | 17.7 | 0.0 |
| Moultrie | 100.0 | 100.0 | 94.5 | 15.3 | 0.0 |
| Edgar | 100.0 | 100.0 | 88.1 | 10.5 | 0.0 |
| Iroquois | 100.0 | 100.0 | 24.2 | 2.5 | 0.0 |
| McLean | 100.0 | 100.0 | 72.9 | 1.4 | 0.0 |
Cumulative shares: D1–D4 is the share in moderate drought or worse.
Source: National Drought Mitigation Center, USDA, NOAA
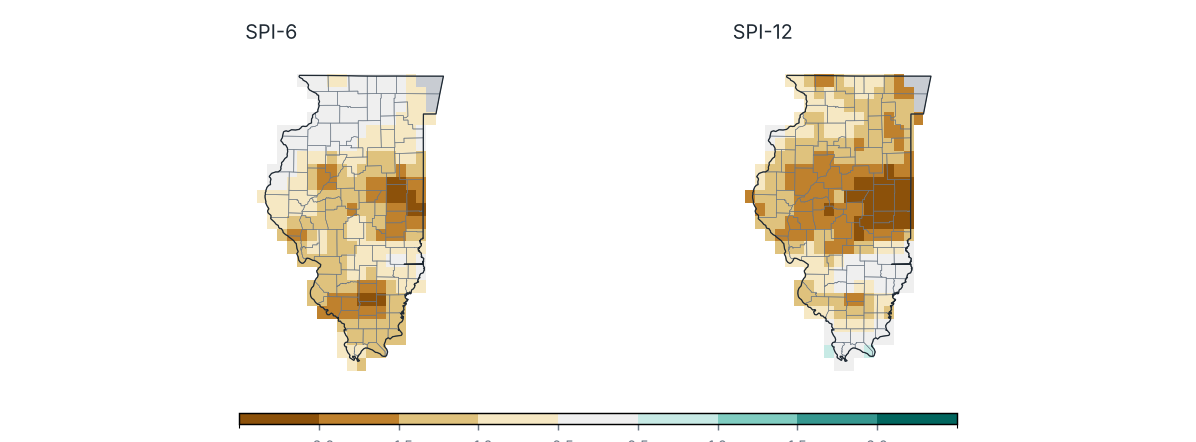
Standardized Precipitation Index (SPI) ending December 2025
Source: NOAA NCEI
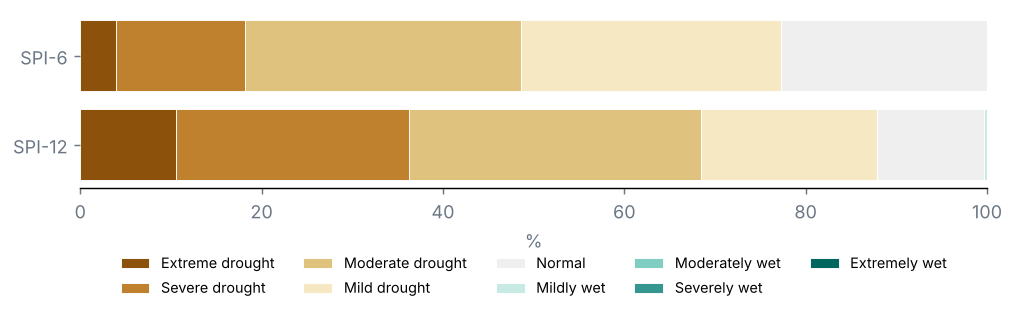
Share of the state by SPI category
Source: NOAA NCEI
Counties with the lowest SPI-12
| County | SPI-6 | SPI-12 | Category |
|---|---|---|---|
| Champaign | −2.1 | −3.0 | Extreme drought |
| Vermilion | −2.0 | −2.8 | Extreme drought |
| Piatt | −1.6 | −2.6 | Extreme drought |
| Douglas | −1.7 | −2.5 | Extreme drought |
| De Witt | −1.5 | −2.4 | Extreme drought |
| Ford | −1.7 | −2.3 | Extreme drought |
| Edgar | −1.7 | −2.3 | Extreme drought |
| Moultrie | −1.4 | −2.2 | Extreme drought |
| McLean | −1.4 | −2.0 | Severe drought |
| Sangamon | −1.3 | −1.9 | Severe drought |
Source: NOAA NCEI
U.S. Drought Monitor, map of 30 December 2025: 71% of the state in drought (D1–D4), 14% in severe drought or worse (D2–D4) and 4% in extreme or exceptional drought (D3–D4); 98% was abnormally dry or in drought (D0–D4).
On the map of 31 December 2024, 20% of the state was in drought: a change of +50 points over the period.
Counties with the largest share in severe drought or worse (D2–D4): Douglas (100%), Champaign (100%) and Piatt (100%).
SPI-12 (Jan–Dec 2025): statewide mean −1.28; 69% of the state in drought (SPI ≤ −1.0) and 36% in severe or extreme drought.
Most affected counties: Champaign (−3.00), Vermilion (−2.84) and Piatt (−2.65).
SPI-6 (Jul–Dec 2025): 49% of the state in drought.
7 Severe weather and notable events
Notable events
| Dates | Type | Area | Details |
|---|---|---|---|
| 2025-04-05 | Heavy rain | Salem | 150.1 mm in 24 hours. |
| 2025-08-19 | Heavy rain | Shabbona 3S | 152.4 mm in 24 hours. |
GDACS alerts and station rainfall of 150 mm or more in 24 hours (after quality control).
Source: GDACS, NOAA NCEI
9 Outlook
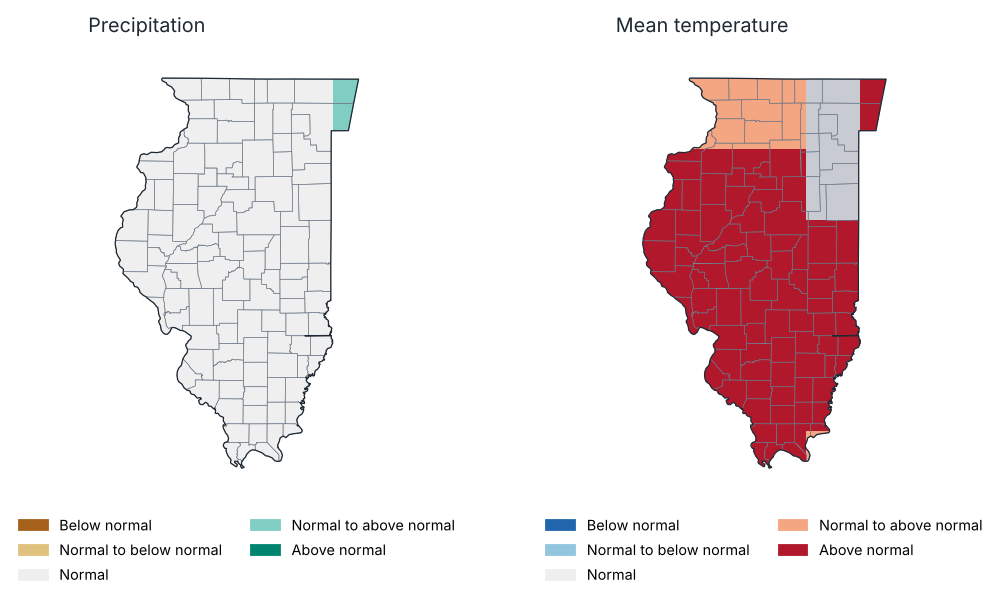
Outlook for Jan–Mar 2026: most likely tercile
Source: NOAA CPC
Probability of each tercile by region, Jan–Mar 2026 (%)
| Region | Precipitation: below | Precipitation: normal | Precipitation: above | Temp.: below | Temp.: normal | Temp.: above |
|---|---|---|---|---|---|---|
| Northwest | 32.0 | 32.0 | 35.0 | 23.0 | 28.0 | 49.0 |
| Northeast | 32.0 | 32.0 | 36.0 | 22.0 | 27.0 | 50.0 |
| West | 32.0 | 35.0 | 34.0 | 22.0 | 23.0 | 54.0 |
| Central | 31.0 | 34.0 | 35.0 | 23.0 | 22.0 | 56.0 |
| East | 29.0 | 35.0 | 36.0 | 22.0 | 25.0 | 53.0 |
| West Southwest | 31.0 | 34.0 | 35.0 | 23.0 | 24.0 | 53.0 |
| East Southeast | 27.0 | 37.0 | 36.0 | 21.0 | 27.0 | 52.0 |
| Southwest | 28.0 | 36.0 | 36.0 | 21.0 | 27.0 | 52.0 |
| Southeast | 27.0 | 38.0 | 35.0 | 20.0 | 29.0 | 51.0 |
Source: NOAA CPC
Probabilistic outlook from the North American Multi-Model Ensemble (NMME), initialised in January 2026, relative to 1991–2020 terciles. It is not an official forecast: consult the National Weather Service and NOAA's Climate Prediction Center.
Precipitation, Jan–Mar 2026: above normal is favoured over 2% of the state and below normal over 0%.
Mean temperature, Jan–Mar 2026: above normal is favoured over 100% of the state and below normal over 0%.
10 Annexes
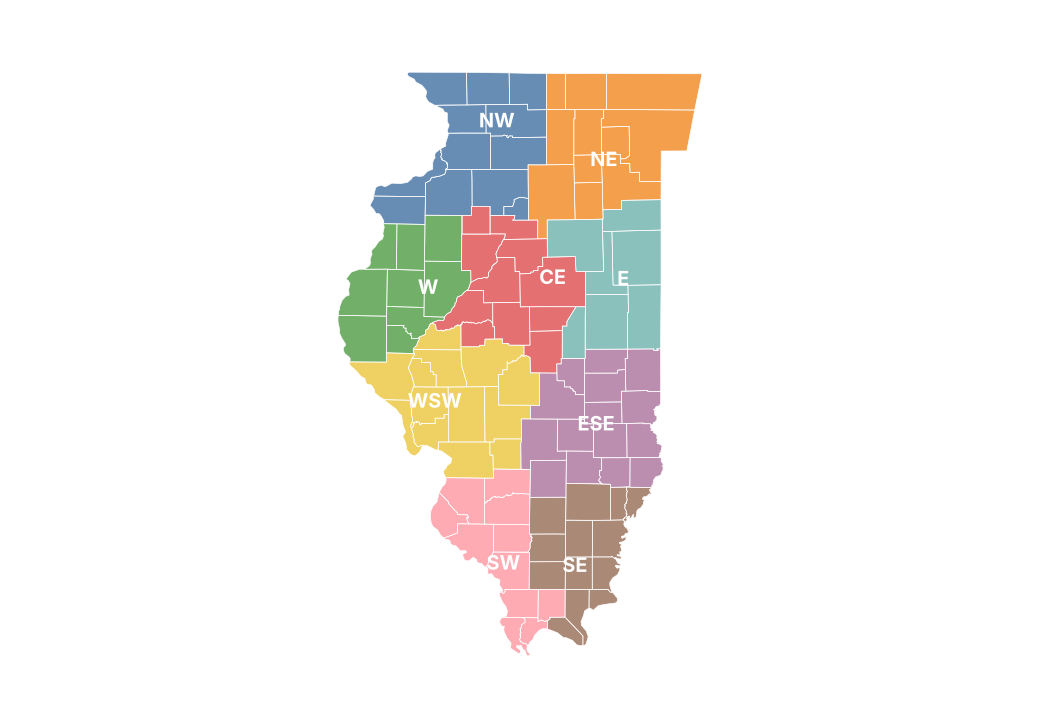
Report climate regions
Monthly precipitation by region (mm)
| Region | Jan | Feb | Mar | Apr | May | Jun | Jul | Aug | Sep | Oct | Nov | Dec |
|---|---|---|---|---|---|---|---|---|---|---|---|---|
| Northwest | 16.2 | 18.4 | 70.4 | 67.8 | 74.0 | 100.5 | 213.8 | 88.2 | 17.6 | 47.4 | 49.2 | 41.2 |
| Northeast | 18.2 | 20.0 | 85.5 | 70.6 | 55.7 | 89.7 | 142.5 | 98.1 | 33.3 | 53.3 | 53.4 | 51.5 |
| West | 15.5 | 8.5 | 67.8 | 73.3 | 90.5 | 106.7 | 200.5 | 25.9 | 27.0 | 38.8 | 42.2 | 45.3 |
| Central | 21.2 | 10.6 | 71.1 | 84.0 | 76.7 | 103.8 | 160.0 | 38.2 | 20.2 | 41.0 | 43.1 | 42.6 |
| East | 19.0 | 12.1 | 85.4 | 88.9 | 75.5 | 101.4 | 127.2 | 50.4 | 30.3 | 42.1 | 43.3 | 42.4 |
| West Southwest | 28.5 | 14.6 | 71.4 | 141.2 | 91.5 | 90.5 | 171.1 | 17.9 | 30.8 | 55.4 | 50.2 | 21.0 |
| East Southeast | 33.1 | 32.9 | 78.4 | 206.5 | 95.8 | 104.6 | 161.1 | 25.2 | 42.3 | 80.7 | 58.0 | 34.8 |
| Southwest | 53.5 | 65.1 | 60.1 | 239.4 | 109.4 | 125.5 | 111.2 | 22.0 | 49.9 | 110.8 | 53.9 | 22.2 |
| Southeast | 52.0 | 80.0 | 65.5 | 241.9 | 122.7 | 134.5 | 103.0 | 25.3 | 69.3 | 102.0 | 51.1 | 28.0 |
Source: NOAA NCEI
Monthly maximum temperature by region (°C)
| Region | Jan | Feb | Mar | Apr | May | Jun | Jul | Aug | Sep | Oct | Nov | Dec |
|---|---|---|---|---|---|---|---|---|---|---|---|---|
| Northwest | −1.3 | 0.4 | 13.1 | 16.6 | 22.1 | 28.6 | 29.6 | 27.4 | 26.8 | 20.5 | 9.9 | 0.6 |
| Northeast | −1.4 | 1.1 | 12.7 | 16.0 | 20.7 | 28.5 | 29.9 | 27.8 | 26.1 | 19.7 | 9.7 | 1.0 |
| West | −0.4 | 2.6 | 15.6 | 18.5 | 22.8 | 28.7 | 30.5 | 28.7 | 28.0 | 22.0 | 11.8 | 3.0 |
| Central | −0.7 | 3.4 | 15.3 | 18.4 | 23.2 | 29.0 | 30.8 | 28.7 | 28.4 | 21.8 | 11.6 | 2.9 |
| East | −1.2 | 3.1 | 14.5 | 17.7 | 22.3 | 29.2 | 30.7 | 28.4 | 27.8 | 21.3 | 11.0 | 2.5 |
| West Southwest | 0.3 | 4.3 | 17.0 | 19.3 | 23.1 | 29.1 | 31.5 | 29.5 | 28.8 | 22.7 | 13.1 | 5.3 |
| East Southeast | 0.3 | 4.7 | 16.3 | 19.2 | 22.8 | 29.3 | 31.7 | 29.3 | 28.8 | 22.4 | 12.7 | 5.1 |
| Southwest | 2.3 | 5.9 | 18.0 | 20.5 | 23.1 | 29.4 | 32.1 | 30.4 | 29.0 | 22.9 | 14.2 | 7.7 |
| Southeast | 2.3 | 6.2 | 17.7 | 20.2 | 23.0 | 29.3 | 32.1 | 30.3 | 28.9 | 22.4 | 13.9 | 7.3 |
Source: NOAA NCEI
Monthly mean temperature by region (°C)
| Region | Jan | Feb | Mar | Apr | May | Jun | Jul | Aug | Sep | Oct | Nov | Dec |
|---|---|---|---|---|---|---|---|---|---|---|---|---|
| Northwest | −6.7 | −4.3 | 6.6 | 10.3 | 15.5 | 22.6 | 24.3 | 21.7 | 19.5 | 14.2 | 4.8 | −4.4 |
| Northeast | −6.2 | −3.4 | 6.5 | 10.0 | 14.6 | 22.4 | 24.6 | 22.1 | 19.5 | 14.0 | 5.0 | −3.8 |
| West | −5.5 | −2.3 | 8.4 | 12.1 | 16.5 | 23.1 | 25.3 | 22.7 | 20.6 | 15.7 | 6.2 | −2.1 |
| Central | −5.6 | −1.6 | 8.3 | 12.0 | 16.7 | 23.3 | 25.5 | 22.6 | 20.4 | 15.2 | 6.0 | −2.2 |
| East | −6.1 | −1.8 | 7.8 | 11.3 | 16.1 | 23.2 | 25.3 | 22.3 | 20.1 | 14.5 | 5.5 | −2.6 |
| West Southwest | −4.5 | −0.8 | 9.7 | 12.9 | 17.2 | 23.8 | 26.3 | 23.5 | 21.2 | 16.2 | 7.5 | −0.1 |
| East Southeast | −4.4 | −0.1 | 9.4 | 12.9 | 17.2 | 24.0 | 26.6 | 23.2 | 21.2 | 15.7 | 7.4 | 0.2 |
| Southwest | −2.5 | 1.0 | 11.0 | 14.6 | 18.0 | 24.6 | 27.2 | 24.2 | 22.0 | 16.5 | 8.7 | 2.5 |
| Southeast | −2.5 | 1.2 | 10.8 | 14.3 | 17.9 | 24.5 | 27.1 | 24.1 | 21.8 | 16.1 | 8.6 | 2.6 |
Source: NOAA NCEI
Monthly minimum temperature by region (°C)
| Region | Jan | Feb | Mar | Apr | May | Jun | Jul | Aug | Sep | Oct | Nov | Dec |
|---|---|---|---|---|---|---|---|---|---|---|---|---|
| Northwest | −12.0 | −9.1 | 0.2 | 3.9 | 8.9 | 16.5 | 19.0 | 15.9 | 12.2 | 7.9 | −0.4 | −9.4 |
| Northeast | −10.9 | −7.9 | 0.3 | 4.0 | 8.4 | 16.3 | 19.3 | 16.5 | 12.8 | 8.2 | 0.2 | −8.5 |
| West | −10.5 | −7.3 | 1.2 | 5.7 | 10.2 | 17.4 | 20.2 | 16.7 | 13.2 | 9.4 | 0.7 | −7.2 |
| Central | −10.5 | −6.7 | 1.3 | 5.6 | 10.2 | 17.6 | 20.2 | 16.5 | 12.4 | 8.6 | 0.4 | −7.4 |
| East | −10.9 | −6.8 | 1.1 | 4.9 | 9.9 | 17.2 | 19.9 | 16.2 | 12.4 | 7.8 | 0.0 | −7.6 |
| West Southwest | −9.4 | −5.9 | 2.4 | 6.5 | 11.3 | 18.4 | 21.1 | 17.5 | 13.6 | 9.7 | 1.8 | −5.5 |
| East Southeast | −9.1 | −4.9 | 2.6 | 6.7 | 11.6 | 18.7 | 21.5 | 17.2 | 13.6 | 9.0 | 2.0 | −4.6 |
| Southwest | −7.4 | −4.0 | 3.9 | 8.7 | 13.0 | 19.8 | 22.3 | 17.9 | 14.9 | 10.2 | 3.2 | −2.8 |
| Southeast | −7.4 | −3.7 | 3.9 | 8.4 | 12.9 | 19.6 | 22.2 | 17.9 | 14.7 | 9.7 | 3.3 | −2.0 |
Source: NOAA NCEI
Stations used
| Id | Name | County | Latitude | Longitude | Altitude (m) | Days with data (Tmax) (%) |
|---|---|---|---|---|---|---|
| USC00110072 | Aledo | Mercer | 41.2 | −90.7 | 223.7 | 99.0 |
| USC00110082 | Alexis 1 SW | Warren | 41.1 | −90.6 | 204.8 | 0.0 |
| USC00110137 | Alton - Melvin Price L&D | Madison | 38.9 | −90.1 | 123.4 | 83.0 |
| USC00110140 | Altona | Knox | 41.1 | −90.2 | 233.2 | 0.0 |
| USC00110146 | Amboy Water | Lee | 41.7 | −89.3 | 230.1 | 0.0 |
| USC00110187 | Anna 4 N | Union | 37.5 | −89.2 | 180.7 | 99.0 |
| USC00110251 | Arthur 1W | Moultrie | 39.7 | −88.5 | 204.2 | 0.0 |
| USC00110306 | Athens 4SW | Menard | 39.9 | −89.8 | 181.1 | 0.0 |
| USC00110330 | Augusta | Hancock | 40.2 | −90.9 | 203.6 | 0.0 |
| USC00110338 | Aurora Water | Kane | 41.8 | −88.3 | 205.7 | 100.0 |
| USC00110356 | Avon | Fulton | 40.7 | −90.4 | 195.1 | 99.0 |
| USC00110442 | Barrington 3SW | Cook | 42.1 | −88.2 | 269.1 | 99.0 |
| USC00110500 | Beecher City | Effingham | 39.2 | −88.8 | 185.3 | 0.0 |
| USC00110583 | Belvidere Wwtp | Boone | 42.3 | −88.9 | 229.5 | 0.0 |
| USC00110598 | Bentley | Hancock | 40.3 | −91.1 | 198.1 | 99.0 |
| USC00110761 | Bloomington Wtr Wks | McLean | 40.5 | −89.0 | 233.5 | 0.0 |
| USC00110803 | Bourbonnais 3NW | Kankakee | 41.2 | −87.9 | 200.6 | 0.0 |
| USC00111083 | Buffalo 3NNE | Sangamon | 39.9 | −89.4 | 187.1 | 0.0 |
| USC00111250 | Canton | Fulton | 40.5 | −90.0 | 195.1 | 0.0 |
| USC00111265 | Carbondale Sewage Plt | Jackson | 37.7 | −89.2 | 118.9 | 93.0 |
| USC00111290 | Carlyle Rsvr | Clinton | 38.6 | −89.4 | 152.7 | 100.0 |
| USC00111329 | Casey | Clark | 39.3 | −88.0 | 189.0 | 100.0 |
| USC00111386 | Centralia | Marion | 38.6 | −89.1 | 147.8 | 0.0 |
| USC00111436 | Charleston | Coles | 39.5 | −88.2 | 213.4 | 98.0 |
| USC00111447 | Chatsworth | Livingston | 40.8 | −88.3 | 220.1 | 0.0 |
| USC00111491 | Chester | Randolph | 37.9 | −89.8 | 118.9 | 0.0 |
| USC00111550 | Chicago Northerly Is | Cook | 41.9 | −87.6 | 177.7 | 98.0 |
| USC00111577 | Chicago Midway AP 3SW | Cook | 41.7 | −87.8 | 189.0 | 100.0 |
| USC00111655 | Cisco | Piatt | 40.0 | −88.7 | 209.7 | 0.0 |
| USC00111664 | Cisne 2 S | Wayne | 38.5 | −88.4 | 138.4 | 0.0 |
| USC00111700 | Clay City 6SSE | Clay | 38.6 | −88.3 | 140.2 | 0.0 |
| USC00111743 | Clinton 1SSW | De Witt | 40.1 | −89.0 | 211.8 | 0.0 |
| USC00111836 | Congerville 2NW | Woodford | 40.6 | −89.2 | 195.1 | 100.0 |
| USC00112048 | Crystal Lake 4NW | McHenry | 42.3 | −88.4 | 283.8 | 74.0 |
| USC00112140 | Danville | Vermilion | 40.1 | −87.6 | 169.2 | 99.0 |
| USC00112145 | Danville Sewage Plt | Vermilion | 40.1 | −87.6 | 163.4 | 0.0 |
| USC00112193 | Decatur Wtp | Macon | 39.8 | −89.0 | 194.8 | 98.0 |
| USC00112223 | De Kalb | DeKalb | 41.9 | −88.8 | 267.6 | 100.0 |
| USC00112348 | Dixon Wwtp | Lee | 41.8 | −89.5 | 198.1 | 100.0 |
| USC00112353 | Dixon Springs Agric Ctr | Pope | 37.4 | −88.7 | 160.6 | 96.0 |
| USC00112483 | Du Quoin 4 SE | Perry | 38.0 | −89.2 | 128.0 | 95.0 |
| USC00112500 | Dwight Wwtp | Livingston | 41.1 | −88.4 | 190.5 | 99.0 |
| USC00112510 | Earlville 3S | LaSalle | 41.6 | −88.9 | 210.9 | 0.0 |
| USC00112679 | Edwardsville 2 W | Madison | 38.8 | −90.0 | 141.7 | 0.0 |
| USC00112685 | Effingham SE | Effingham | 39.1 | −88.5 | 161.8 | 0.0 |
| USC00112736 | Elgin Water | Kane | 42.1 | −88.3 | 227.1 | 99.0 |
| USC00112745 | Elizabeth | Jo Daviess | 42.3 | −90.2 | 205.7 | 98.0 |
| USC00112923 | Fairbury Wwtp | Livingston | 40.8 | −88.5 | 204.2 | 0.0 |
| USC00112931 | 1 ENE Fairfield | Wayne | 38.4 | −88.4 | 140.8 | 100.0 |
| USC00113061 | Fisher | Champaign | 40.3 | −88.3 | 219.8 | 0.0 |
| USC00113106 | Flora | Clay | 38.7 | −88.5 | 146.6 | 100.0 |
| USC00113107 | Flora 2 | Clay | 38.7 | −88.5 | 149.0 | 0.0 |
| USC00113120 | Ft Massac Sp | Massac | 37.1 | −88.7 | 104.2 | 0.0 |
| USC00113132 | Forreston | Ogle | 42.1 | −89.6 | 278.3 | 0.0 |
| USC00113262 | Freeport Wwtp | Stephenson | 42.3 | −89.6 | 228.6 | 100.0 |
| USC00113290 | Fulton L&D #13 | Whiteside | 41.9 | −90.2 | 180.4 | 99.0 |
| USC00113320 | Galesburg | Knox | 40.9 | −90.4 | 232.0 | 99.0 |
| USC00113335 | Galva | Henry | 41.2 | −90.0 | 246.9 | 100.0 |
| USC00113384 | Geneseo | Henry | 41.5 | −90.1 | 194.8 | 100.0 |
| USC00113392 | Genoa 2SW | DeKalb | 42.1 | −88.7 | 251.8 | 0.0 |
| USC00113395 | Germantown Hills | Woodford | 40.8 | −89.5 | 238.7 | 0.0 |
| USC00113455 | Gladstone L/D 18 | Henderson | 40.9 | −91.0 | 164.0 | 91.0 |
| USC00113490 | Glen Ellyn 4S | DuPage | 41.8 | −88.1 | 207.3 | 0.0 |
| USC00113580 | Olmsted L&D | Pulaski | 37.2 | −89.1 | 114.3 | 91.0 |
| USC00113879 | Harrisburg | Saline | 37.7 | −88.5 | 111.3 | 91.0 |
| USC00113902 | Harvard Wwtp | McHenry | 42.4 | −88.6 | 279.2 | 0.0 |
| USC00113940 | Havana | Mason | 40.3 | −90.1 | 141.1 | 0.0 |
| USC00114012 | Hennepin | Putnam | 41.3 | −89.3 | 157.0 | 100.0 |
| USC00114089 | Highland | Madison | 38.7 | −89.7 | 158.5 | 0.0 |
| USC00114108 | Hillsboro | Montgomery | 39.2 | −89.5 | 192.0 | 99.0 |
| USC00114198 | Hoopeston | Vermilion | 40.5 | −87.7 | 216.4 | 99.0 |
| USC00114317 | Hutsonville | Crawford | 39.1 | −87.7 | 147.2 | 0.0 |
| USC00114355 | Illinois City Dam 16 | Rock Island | 41.4 | −91.0 | 167.6 | 99.0 |
| USC00114400 | Iuka 12 SW | Marion | 38.5 | −89.0 | 179.8 | 43.0 |
| USC00114442 | Jacksonville 2E | Morgan | 39.7 | −90.2 | 185.9 | 100.0 |
| USC00114447 | Jacksonville 2 | Morgan | 39.7 | −90.2 | 190.8 | 100.0 |
| USC00114489 | Jerseyville 2 SW | Jersey | 39.1 | −90.3 | 185.9 | 95.0 |
| USC00114530 | Joliet Brandon Road Lock/Dam | Will | 41.5 | −88.1 | 165.5 | 100.0 |
| USC00114603 | Kankakee Wwtp | Kankakee | 41.1 | −87.9 | 182.9 | 99.0 |
| USC00114629 | Kaskaskia Rvr Navigation Lock | Randolph | 38.0 | −89.9 | 118.9 | 98.0 |
| USC00114710 | Kewanee 1E | Henry | 41.2 | −89.9 | 237.7 | 98.0 |
| USC00114780 | Knoxville | Knox | 40.9 | −90.3 | 221.9 | 100.0 |
| USC00114805 | Lacon | Marshall | 41.0 | −89.4 | 139.6 | 0.0 |
| USC00114823 | La Harpe | Hancock | 40.6 | −91.0 | 206.7 | 97.0 |
| USC00114833 | Lake Springfield | Sangamon | 39.8 | −89.6 | 177.1 | 0.0 |
| USC00114890 | Lansing 2S | Cook | 41.5 | −87.5 | 187.1 | 0.0 |
| USC00114957 | Lawrenceville 2WSW | Lawrence | 38.7 | −87.7 | 137.5 | 100.0 |
| USC00115079 | Lincoln | Logan | 40.2 | −89.3 | 177.7 | 100.0 |
| USC00115097 | Lisle - Morton Arboretum | DuPage | 41.8 | −88.1 | 206.3 | 98.0 |
| USC00115110 | Little Red School House | Cook | 41.7 | −87.9 | 219.2 | 0.0 |
| USC00115219 | Lovington | Moultrie | 39.7 | −88.6 | 207.9 | 0.0 |
| USC00115272 | Mackinaw 3WSW | Tazewell | 40.5 | −89.4 | 201.8 | 0.0 |
| USC00115280 | Macomb | McDonough | 40.5 | −90.7 | 185.9 | 0.0 |
| USC00115314 | Manhattan 5ENE | Will | 41.5 | −87.9 | 228.0 | 0.0 |
| USC00115342 | Marion 4 NNE | Williamson | 37.8 | −88.9 | 145.4 | 0.0 |
| USC00115372 | Marseilles Lock/Dam | LaSalle | 41.3 | −88.8 | 148.4 | 99.0 |
| USC00115430 | Mattoon | Coles | 39.5 | −88.4 | 213.4 | 0.0 |
| USC00115493 | Mchenry Stratton Lock/Dam | McHenry | 42.3 | −88.3 | 224.3 | 100.0 |
| USC00115539 | Medora 1 S | Macoupin | 39.2 | −90.1 | 185.0 | 0.0 |
| USC00115562 | Mendota 1S | LaSalle | 41.5 | −89.1 | 218.8 | 0.0 |
| USC00115660 | Milstadt 2SW | St. Clair | 38.4 | −90.1 | 198.1 | 0.0 |
| USC00115712 | Minonk | Woodford | 40.9 | −89.0 | 228.6 | 100.0 |
| USC00115763 | Monee | Will | 41.4 | −87.8 | 242.9 | 0.0 |
| USC00115768 | Monmouth | Warren | 40.9 | −90.6 | 219.5 | 94.0 |
| USC00115772 | Monmouth 4NW | Warren | 40.9 | −90.7 | 220.7 | 99.0 |
| USC00115825 | Morris 1NW | Grundy | 41.4 | −88.4 | 159.7 | 100.0 |
| USC00115833 | Morrison | Whiteside | 41.8 | −90.0 | 192.6 | 100.0 |
| USC00115841 | Morrisonville | Christian | 39.4 | −89.5 | 192.0 | 99.0 |
| USC00115876 | Morton | Tazewell | 40.6 | −89.5 | 213.7 | 0.0 |
| USC00115901 | Mt Carroll | Carroll | 42.1 | −90.0 | 215.8 | 98.0 |
| USC00115917 | Mt Olive 1 E | Macoupin | 39.1 | −89.7 | 204.2 | 0.0 |
| USC00115927 | Mt Pulaski | Logan | 40.0 | −89.3 | 201.5 | 0.0 |
| USC00115943 | Mt Vernon 3 NE | Jefferson | 38.4 | −88.9 | 149.4 | 79.0 |
| USC00115950 | Moweaqua 2S | Shelby | 39.6 | −89.0 | 190.5 | 0.0 |
| USC00115983 | Murphysboro 2 SW | Jackson | 37.8 | −89.4 | 167.6 | 0.0 |
| USC00116024 | Neoga | Cumberland | 39.3 | −88.5 | 195.7 | 0.0 |
| USC00116080 | New Boston Dam 17 | Mercer | 41.2 | −91.1 | 166.7 | 92.0 |
| USC00116157 | Newton | Jasper | 39.0 | −88.2 | 161.8 | 100.0 |
| USC00116200 | Normal 4NE | McLean | 40.5 | −88.9 | 240.8 | 99.0 |
| USC00116344 | Ogden | Champaign | 40.1 | −88.0 | 205.7 | 98.0 |
| USC00116446 | Olney 2S | Richland | 38.7 | −88.1 | 139.9 | 100.0 |
| USC00116490 | Oregon | Ogle | 42.0 | −89.3 | 206.7 | 0.0 |
| USC00116526 | Ottawa 4SW | LaSalle | 41.3 | −88.9 | 166.1 | 100.0 |
| USC00116579 | Pana | Christian | 39.4 | −89.1 | 198.1 | 100.0 |
| USC00116610 | Paris Stp | Edgar | 39.6 | −87.7 | 197.8 | 92.0 |
| USC00116616 | Park Forest Water | Cook | 41.5 | −87.7 | 216.4 | 100.0 |
| USC00116661 | Paw Paw 2S | Lee | 41.7 | −89.0 | 271.0 | 99.0 |
| USC00116663 | Paxton | Ford | 40.5 | −88.1 | 242.9 | 0.0 |
| USC00116710 | Peoria 5NW | Peoria | 40.7 | −89.6 | 213.4 | 0.0 |
| USC00116725 | Peotone | Will | 41.3 | −87.8 | 218.8 | 0.0 |
| USC00116738 | Perry 6 NW | Pike | 39.8 | −90.8 | 198.1 | 21.0 |
| USC00116753 | Peru | LaSalle | 41.3 | −89.1 | 193.2 | 100.0 |
| USC00116765 | Petersburg 1E | Menard | 40.0 | −89.8 | 182.9 | 100.0 |
| USC00116769 | Philo | Champaign | 40.0 | −88.2 | 219.5 | 0.0 |
| USC00116779 | Pinckneyville 2 N | Perry | 38.1 | −89.4 | 131.1 | 0.0 |
| USC00116837 | Pittsfield #2 | Pike | 39.6 | −90.8 | 207.3 | 67.0 |
| USC00116874 | Plumfield | Franklin | 37.9 | −89.0 | 119.8 | 0.0 |
| USC00116970 | Prairie City 2S | McDonough | 40.6 | −90.5 | 198.1 | 10.0 |
| USC00117077 | Quincy Dam 21 | Adams | 39.9 | −91.4 | 147.2 | 92.0 |
| USC00117157 | Red Bud 2 S | Randolph | 38.2 | −90.0 | 128.0 | 0.0 |
| USC00117187 | Rend Lake Dam | Franklin | 38.0 | −89.0 | 138.7 | 87.0 |
| USC00117329 | Roanoke | Woodford | 40.8 | −89.2 | 219.5 | 0.0 |
| USC00117345 | Robinson | Crawford | 39.0 | −87.8 | 163.1 | 100.0 |
| USC00117391 | Rock Is L&D 15 | Rock Island | 41.5 | −90.6 | 173.1 | 90.0 |
| USC00117457 | Romeoville Wfo | Will | 41.6 | −88.1 | 201.2 | 100.0 |
| USC00117487 | Elizabethtown | Hardin | 37.4 | −88.3 | 110.3 | 0.0 |
| USC00117636 | Salem | Marion | 38.6 | −88.9 | 167.6 | 99.0 |
| USC00117833 | Shabbona 3S | DeKalb | 41.7 | −88.9 | 259.1 | 0.0 |
| USC00117860 | Shawneetown 3 WSW | Gallatin | 37.7 | −88.2 | 121.9 | 0.0 |
| USC00117876 | Shelbyville Dam | Shelby | 39.4 | −88.8 | 198.1 | 99.0 |
| USC00117896 | Sherman | Sangamon | 39.9 | −89.6 | 177.1 | 0.0 |
| USC00117952 | Sidell 4N | Vermilion | 40.0 | −87.8 | 204.8 | 100.0 |
| USC00118020 | Smithland L&D | Pope | 37.2 | −88.4 | 108.8 | 97.0 |
| USC00118194 | St Anne | Kankakee | 41.0 | −87.7 | 203.0 | 0.0 |
| USC00118210 | St Libory | St. Clair | 38.4 | −89.7 | 129.5 | 0.0 |
| USC00118248 | Steeleville | Randolph | 38.0 | −89.7 | 131.1 | 0.0 |
| USC00118254 | Steward 3S | Lee | 41.8 | −89.0 | 246.9 | 0.0 |
| USC00118293 | Stockton 3NNE | Jo Daviess | 42.4 | −90.0 | 295.7 | 100.0 |
| USC00118353 | Streator 2SE | Livingston | 41.1 | −88.8 | 184.7 | 0.0 |
| USC00118389 | Sullivan 3S | Moultrie | 39.6 | −88.6 | 195.1 | 0.0 |
| USC00118491 | Taylorville 2SE | Christian | 39.5 | −89.3 | 188.1 | 0.0 |
| USC00118684 | Tuscola | Douglas | 39.8 | −88.3 | 198.4 | 100.0 |
| USC00118740 | Champaign 3S | Champaign | 40.1 | −88.2 | 220.1 | 100.0 |
| USC00118781 | Vandalia | Fayette | 39.0 | −89.1 | 149.4 | 0.0 |
| USC00118916 | Walnut | Bureau | 41.6 | −89.6 | 213.4 | 98.0 |
| USC00118932 | Waltonville | Jefferson | 38.2 | −89.1 | 155.8 | 0.0 |
| USC00119002 | Waterloo 6SW | Monroe | 38.3 | −90.2 | 222.5 | 0.0 |
| USC00119021 | Watseka Public Works | Iroquois | 40.8 | −87.7 | 191.1 | 0.0 |
| USC00119148 | W Frankfort | Franklin | 37.9 | −88.9 | 131.1 | 0.0 |
| USC00119241 | White Hall 1 E | Greene | 39.4 | −90.4 | 176.8 | 99.0 |
| USC00119275 | Willisville | Randolph | 38.0 | −89.6 | 151.2 | 0.0 |
| USC00119354 | Windsor | Shelby | 39.4 | −88.6 | 210.3 | 99.0 |
| USC00119480 | Woodstock 5NW | McHenry | 42.4 | −88.5 | 288.6 | 0.0 |
| USC00119816 | Yates City | Knox | 40.8 | −90.0 | 203.9 | 0.0 |
| USW00003887 | Decatur AP | Macon | 39.8 | −88.9 | 205.1 | 100.0 |
| USW00003960 | Cahokia St Louis Dwtn AP | St. Clair | 38.6 | −90.1 | 123.4 | 99.0 |
| USW00004808 | Chicago Aurora Muni AP | Kane | 41.8 | −88.5 | 213.7 | 100.0 |
| USW00004838 | Chicago Palwaukee AP | Cook | 42.1 | −87.9 | 191.7 | 100.0 |
| USW00013802 | Belleville Siu Rsch | St. Clair | 38.5 | −89.8 | 137.2 | 98.0 |
| USW00013809 | Lawrenceville Vincennes Intl A | Lawrence | 38.8 | −87.6 | 130.1 | 100.0 |
| USW00014806 | Rantoul | Champaign | 40.3 | −88.2 | 225.6 | 0.0 |
| USW00014819 | Chicago Midway AP | Cook | 41.8 | −87.8 | 185.9 | 100.0 |
| USW00014834 | Joliet | Will | 41.5 | −88.1 | 167.9 | 98.0 |
| USW00014842 | General Wayne A Downing Intl A | Peoria | 40.7 | −89.7 | 199.6 | 100.0 |
| USW00014880 | Chicago Waukegan Rgnl AP | Lake | 42.4 | −87.9 | 216.4 | 100.0 |
| USW00014923 | Moline Quad City Intl AP | Rock Island | 41.4 | −90.5 | 175.6 | 100.0 |
| USW00053802 | Mattoon Charleston Coles Co AP | Coles | 39.5 | −88.3 | 216.4 | 99.0 |
| USW00054808 | Champaign 9 SW | Champaign | 40.1 | −88.4 | 213.4 | 100.0 |
| USW00054811 | Shabbona 5 NNE | DeKalb | 41.8 | −88.9 | 262.4 | 100.0 |
| USW00054831 | Bloomington Normal AP | McLean | 40.5 | −89.0 | 263.7 | 99.0 |
| USW00093809 | Cairo 3N | Alexander | 37.0 | −89.2 | 95.4 | 97.0 |
| USW00093810 | Carbondale Sthrn Illinois AP | Jackson | 37.8 | −89.2 | 121.9 | 99.0 |
| USW00093822 | Springfield Abraham Lincoln Ca | Sangamon | 39.8 | −89.7 | 179.8 | 100.0 |
| USW00093989 | Quincy Rgnl AP | Adams | 39.9 | −91.2 | 231.6 | 100.0 |
| USW00094822 | Rockford Gtr Rockford AP | Winnebago | 42.2 | −89.1 | 221.0 | 100.0 |
| USW00094846 | Chicago Ohare Intl AP | DuPage | 42.0 | −87.9 | 204.8 | 100.0 |
| USW00094870 | Champaign Urbana Willard AP | Champaign | 40.0 | −88.3 | 226.5 | 99.0 |
| USW00094892 | Chicago W Chicago Dupage AP | DuPage | 41.9 | −88.3 | 228.3 | 100.0 |
Source: NOAA NCEI
11 Glossary, methodology and sources
Anomaly: difference between the observed value and its 1991–2020 normal. Percent of normal: observed total divided by the normal, times 100. Station record: most extreme daily value for the same month in all earlier years of record (at least 20 years).
Temperature: NOAA nClimGrid-Daily. Precipitation: NOAA nClimGrid-Daily. nClimGrid-Daily is the grid behind NOAA's official statewide values; it is averaged here from 1/24° to 1/8° (about 12 km). Mean temperature is (Tmax + Tmin)/2. Statewide, regional and county averages are weighted by the area of each grid cell inside each polygon. Temperature maps, frost days and annex tables are given by region; regions are NOAA NCEI climate divisions, with each county in the division of its centroid. Recent weeks use NCEI's preliminary file of the month; such reports are marked preliminary and updated when the final file is published. Normals refer to 1991-2020; ranks compare values rounded to one decimal. Stations: GHCN-Daily (NOAA NCEI) cooperative and first-order stations; values flagged by its quality control are discarded, as are daily values more than 5 robust standard deviations from the station median and variables whose monthly anomaly differs by more than 3 °C from the gridded analysis. Period means require at least 80% of days with data and station normals at least 20 complete years. This report is generated automatically and does not replace official information from the National Weather Service or the state climatologist.
| Source | Product | License | Citation |
|---|---|---|---|
| NOAA CPC | ONI, Niño-region SST indices (OISST v2.1), NAO and AO | Public domain (NOAA) | NOAA Climate Prediction Center climate indices. |
| NOAA NCEI / PSL | Extended Reconstructed SST v5 (ERSST v5), 2° | Public domain (NOAA) | Huang et al. (2017), J. Climate, doi:10.1175/JCLI-D-16-0836.1 |
| GDACS | Global Disaster Alert and Coordination System event list | See provider terms | — |
| NOAA NCEI | GHCN-Daily | Public domain (NOAA) | Menne et al. (2012), J. Atmos. Oceanic Technol., doi:10.1175/JTECH-D-11-00103.1 |
| NOAA NCEI | Pacific Decadal Oscillation index (ERSST v5) | Public domain (NOAA) | — |
| NOAA NCEI | nClimGrid-Daily, contiguous United States (1/24°, averaged here to 1/8°) | Public domain (NOAA) | Durre, I., et al. (2022). NOAA's nClimGrid-Daily Version 1. NOAA National Centers for Environmental Information. doi:10.25921/c4gt-r169 |
| NOAA CPC | North American Multi-Model Ensemble (NMME) tercile probabilities, 1° | Public domain (NOAA) | Kirtman et al. (2014), Bull. Amer. Meteor. Soc., doi:10.1175/BAMS-D-12-00050.1 |
| National Drought Mitigation Center, USDA, NOAA | U.S. Drought Monitor, weekly maps and area statistics | Free to use with credit (NDMC) | The U.S. Drought Monitor is jointly produced by the National Drought Mitigation Center at the University of Nebraska-Lincoln, the United States Department of Agriculture and the National Oceanic and Atmospheric Administration. Map courtesy of NDMC. |
| US Census Bureau TIGERweb | US Census Bureau, TIGERweb counties (generalised) | Public domain (US Government work) | — |
Generated by ClimaBulletin (climabulletin.org), open source. Questions and comments: [email protected].