Florida · Annual
Year 2025
Downloads
1 Key messages and climate synopsis
Source: NOAA NCEI
Source: NOAA NCEI
2 Global and regional climate drivers
Sea-surface temperature anomaly, Year 2025 (°C, 1991–2020)
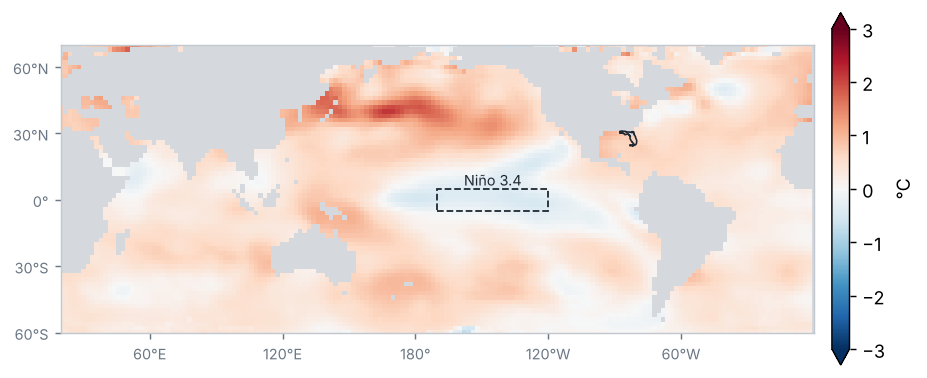
Source: NOAA NCEI / PSL
Sea-surface temperature anomaly in the Niño regions (°C)
| Region | Anomaly (°C) | Change from preceding period (°C) |
|---|---|---|
| Niño 1+2 | 0.2 | 0.3 |
| Niño 3 | −0.2 | −0.5 |
| Niño 3.4 | −0.3 | −0.7 |
| Niño 4 | −0.2 | −0.8 |
Mean of the months in the period (OISST v2.1)
Source: NOAA CPC
La Niña conditions of weak intensity: the Oceanic Niño Index (ONI) for OND 2025 was −0.6 °C.
Source: NOAA CPC
Monthly Niño 3.4 anomaly, last 24 months (°C)
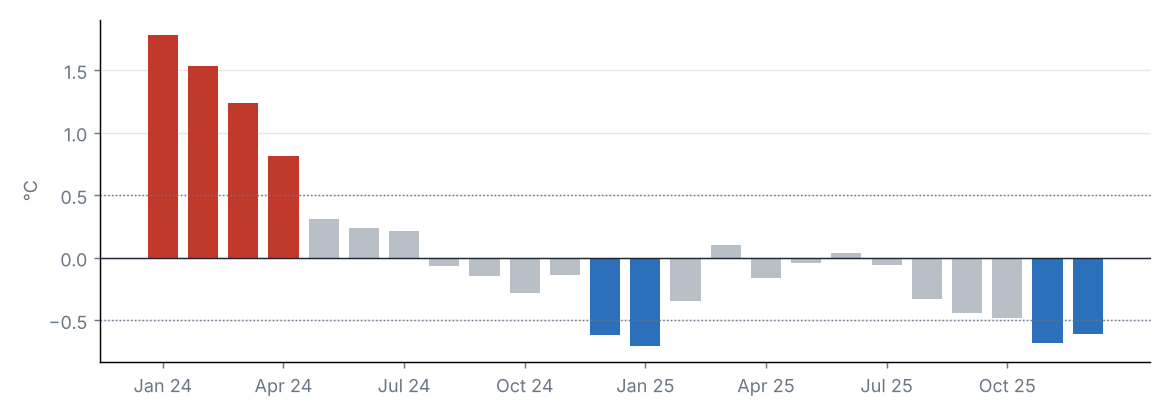
Source: NOAA CPC
Teleconnection indices
| Index | Value | Phase |
|---|---|---|
| NAO | 0.0 | Neutral |
| AO | 0.2 | Neutral |
| PDO | −2.0 | Negative |
North Atlantic Oscillation (NAO); Arctic Oscillation (AO); Pacific Decadal Oscillation (PDO).
Source: NOAA CPC, NOAA NCEI
The Niño 3.4 anomaly was −0.31 °C (−0.71 °C relative to the preceding period).
Other indices: NAO +0.02 (neutral phase); AO +0.20 (neutral phase); PDO −1.99 (negative phase).
3 Precipitation
Source: NOAA NCEI
Accumulated precipitation
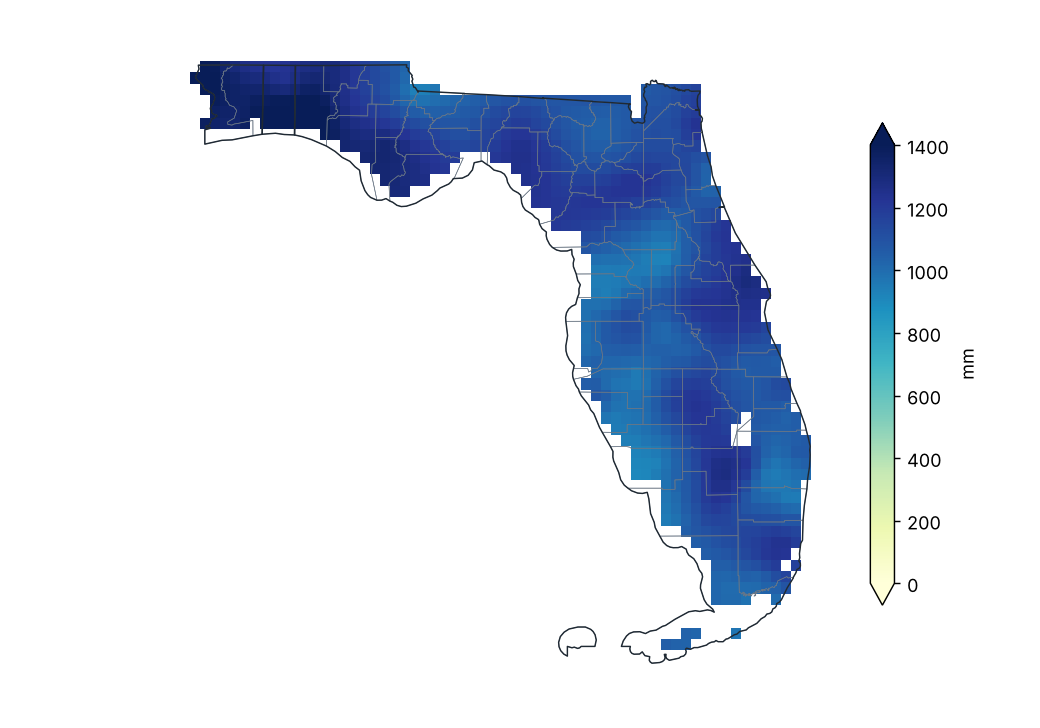
Source: NOAA NCEI
Percent of normal precipitation (1991–2020)
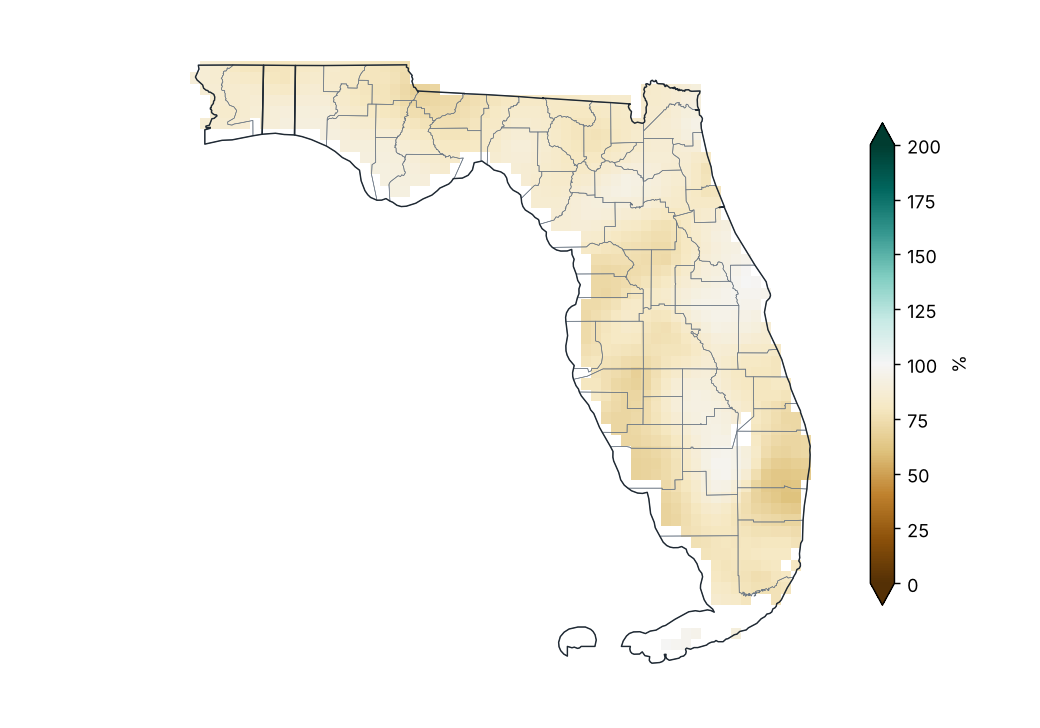
Source: NOAA NCEI
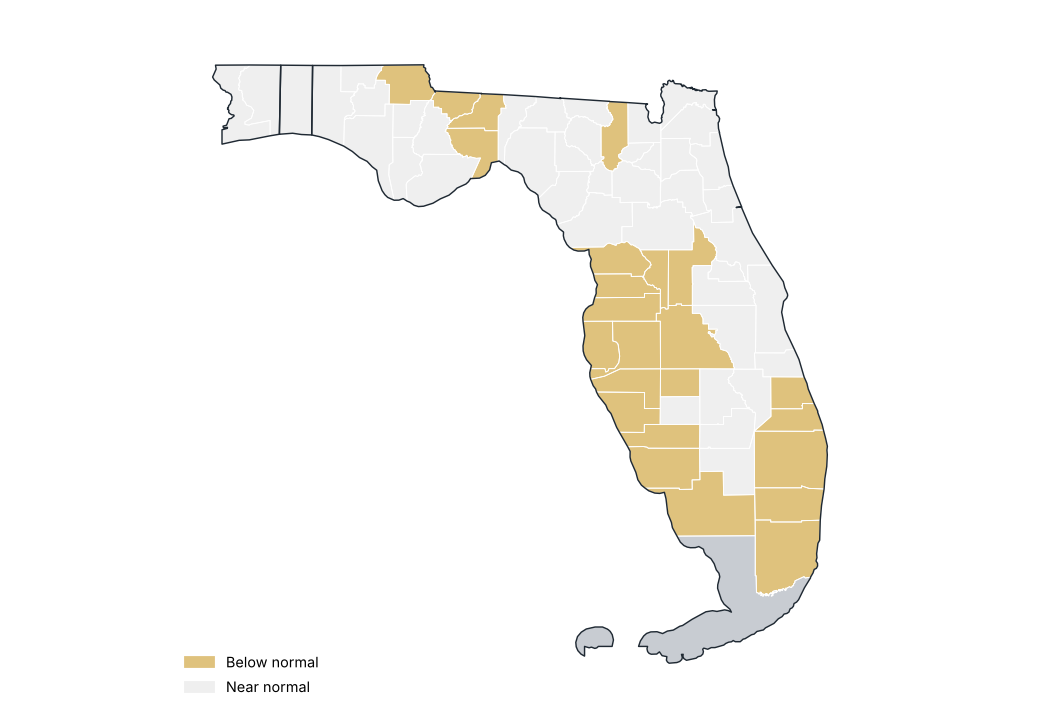
Percent of normal by county
Source: NOAA NCEI
Precipitation by region
| Region | Total (mm) | Normal (mm) | Difference (%) | Category |
|---|---|---|---|---|
| Northwest | 1245.4 | 1494.8 | −16.7 | Near normal |
| North | 1145.0 | 1348.5 | −15.1 | Near normal |
| North Central | 1072.7 | 1313.1 | −18.3 | Near normal |
| South Central | 1098.7 | 1335.1 | −17.7 | Near normal |
| South Florida | 1083.8 | 1389.5 | −22.0 | Below normal |
Source: NOAA NCEI
Stations with the largest precipitation excess
| Region | County | Station | Altitude (m) | Anomaly (%) |
|---|---|---|---|---|
| South Central | Brevard | Titusville | 5.0 | 23.9 |
| North | Duval | Jacksonville Craig Muni AP | 12.0 | 4.0 |
| North Central | Orange | Orlando Intl AP | 27.0 | 3.9 |
| South Central | Brevard | Melbourne Intl AP | 7.0 | 1.1 |
Source: NOAA NCEI
Stations with the largest precipitation deficit
| Region | County | Station | Altitude (m) | Anomaly (%) |
|---|---|---|---|---|
| South Florida | Broward | Ft Lauderdale Executive AP | 4.0 | −81.7 |
| South Florida | Broward | Hollywood N Perry AP | 2.0 | −55.8 |
| South Central | Manatee | Ft Green 12 WSW | 34.0 | −44.0 |
| South Florida | Miami-Dade | Miami Kendall Tamiami Exec AP | 2.0 | −41.6 |
| South Florida | Martin | Stuart | 4.0 | −36.1 |
| South Florida | Miami-Dade | Miami Opa Locka AP | 1.0 | −35.5 |
| North Central | Hernando | Brooksville Hernando Co AP | 20.0 | −35.3 |
| South Central | Sarasota | Venice | 2.0 | −34.0 |
| South Florida | Broward | Ft Lauderdale | 5.0 | −33.7 |
| South Central | Polk | Winter Haven Gilbert AP | 44.0 | −33.5 |
Source: NOAA NCEI
Largest 24-hour rainfall at stations
| Station | County | Max 24 h rainfall (mm) | Date |
|---|---|---|---|
| Titusville | Brevard | 332.7 | 2025-10-27 |
| Mt Plymouth 1SSW | Lake | 268.7 | 2025-10-27 |
| Flamingo Rs | Monroe | 184.2 | 2025-06-05 |
| Miami Beach | Miami-Dade | 184.2 | 2025-03-31 |
| Key W Wfo | Monroe | 168.1 | 2025-02-24 |
| Mayo | Lafayette | 165.1 | 2025-03-10 |
| Lisbon | Lake | 153.2 | 2025-10-27 |
| Leesburg Muni AP | Lake | 153.2 | 2025-10-26 |
| Lake City 2 E | Columbia | 145.0 | 2025-01-19 |
| Marathon AP | Monroe | 132.6 | 2025-10-10 |
Source: NOAA NCEI
Statewide precipitation in each year
Source: NOAA NCEI
Monthly precipitation and 1991–2020 normal
Source: NOAA NCEI
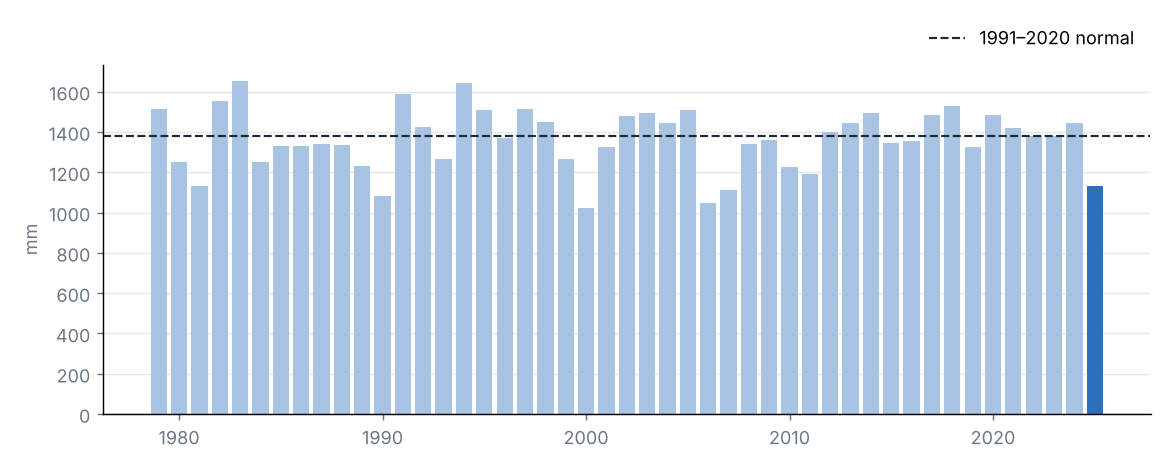
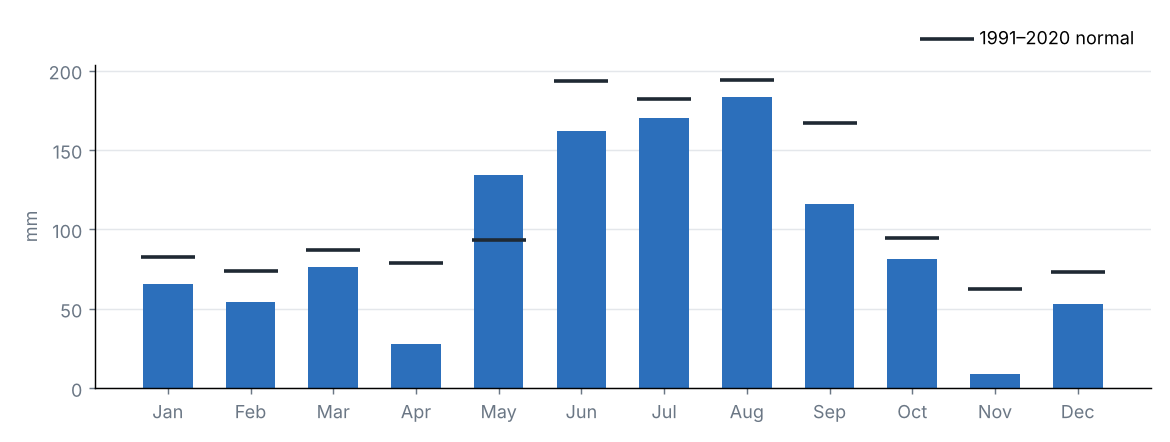
Statewide accumulated precipitation was 1132.5 mm, 82% of the 1991–2020 average (1381.3 mm), category “Near normal”. It was the 6th driest year in the 1979–2025 series.
The region with the highest percentage of normal was North (85%) and the lowest was South Florida (78%).
Source: NOAA NCEI
4 Temperature
Source: NOAA NCEI
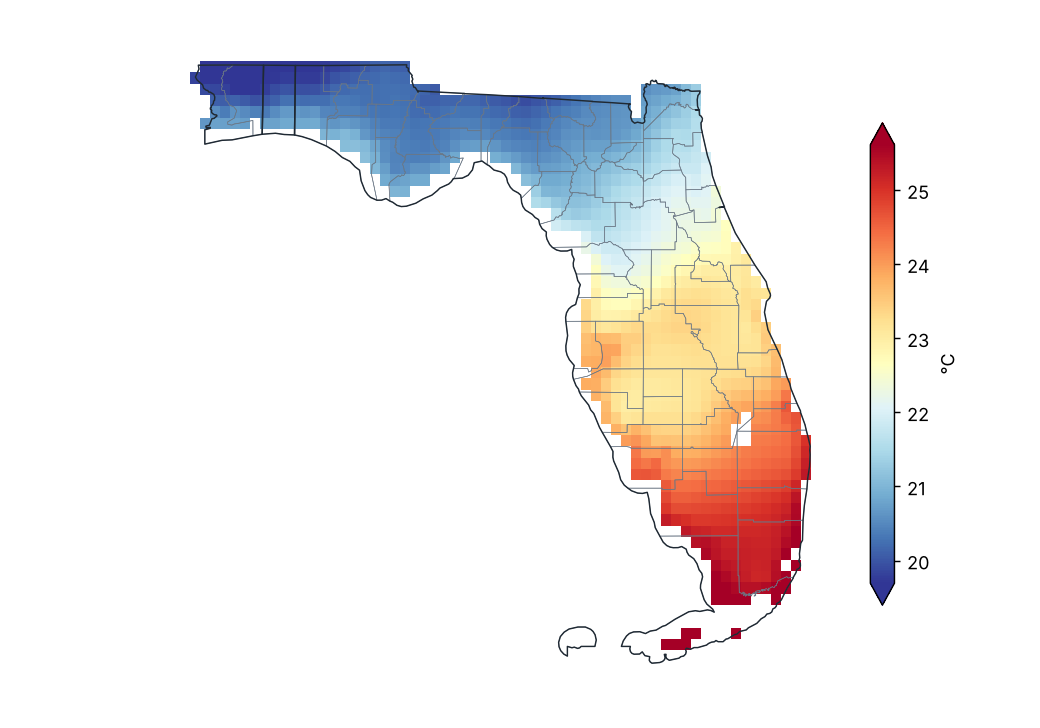
Mean temperature
Source: NOAA NCEI
Mean temperature anomaly (1991–2020)
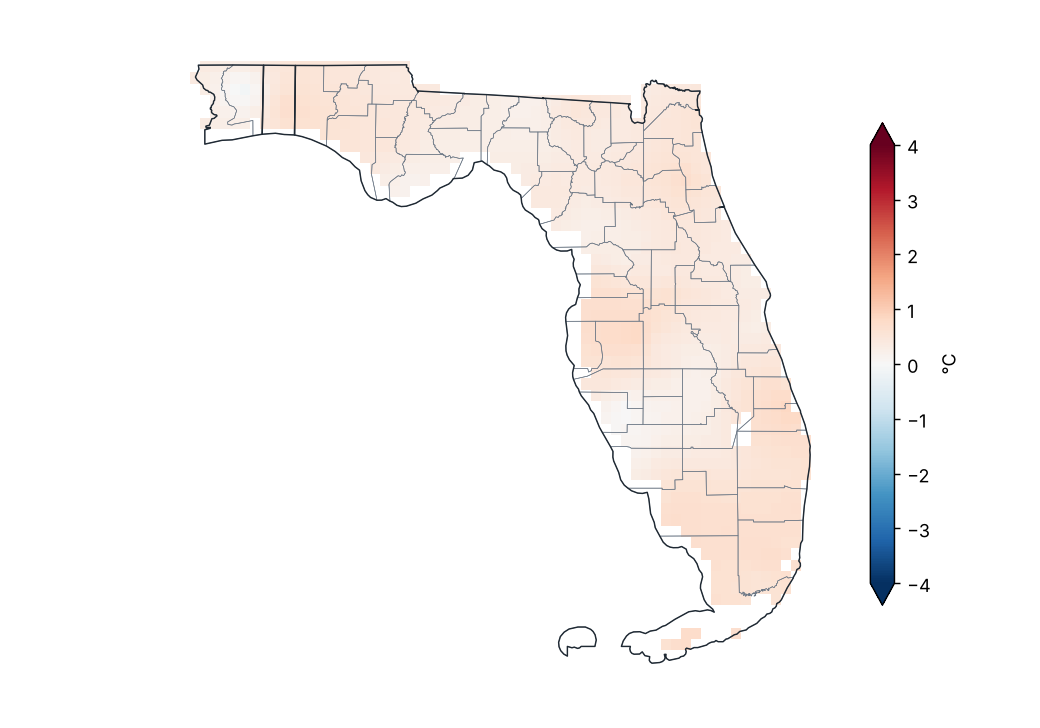
Source: NOAA NCEI
Mean temperature anomaly by region
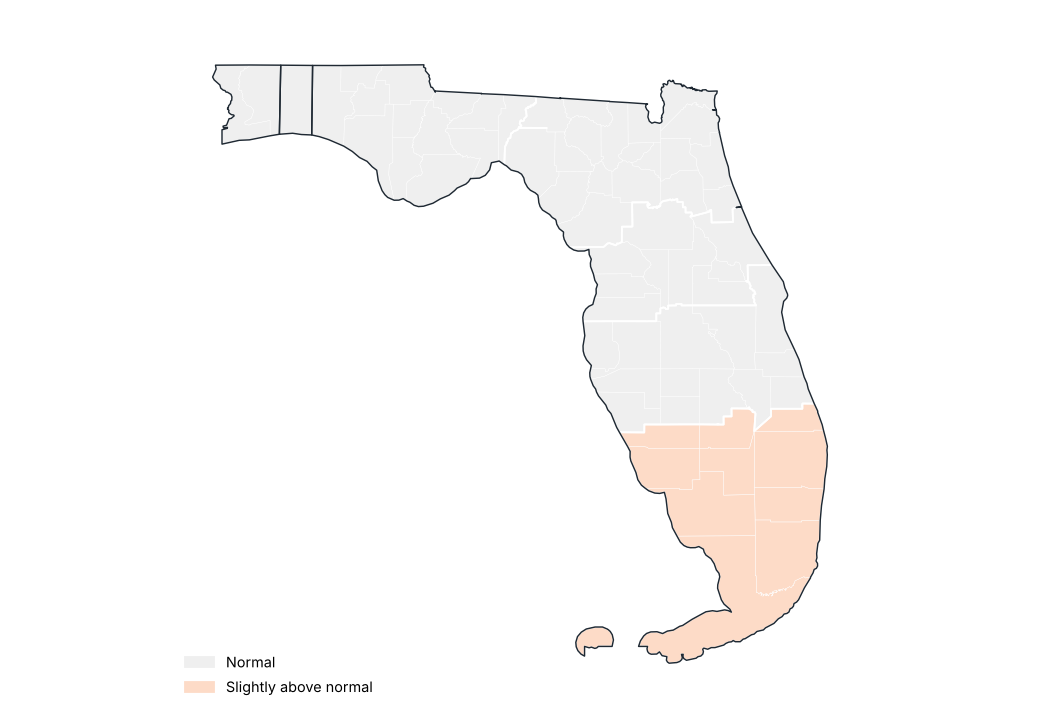
Source: NOAA NCEI
Stations with the largest positive anomaly
| Region | County | Station | Altitude (m) | Anomaly (°C) |
|---|---|---|---|---|
| North Central | Lake | Clermont 9 S | 40.0 | 1.8 |
| South Florida | Broward | Ft Lauderdale Beach | 1.0 | 1.5 |
| South Florida | Broward | Ft Lauderdale Executive AP | 4.0 | 1.3 |
| South Central | Hillsborough | Plant City | 33.0 | 1.3 |
| South Florida | Broward | Hollywood N Perry AP | 2.0 | 1.1 |
| North Central | Volusia | Deland 1 SSE | 8.0 | 1.0 |
| South Florida | Broward | Pompano Beach Airpark | 5.0 | 1.0 |
| South Central | Hillsborough | Tampa Intl AP | 2.0 | 0.9 |
| South Florida | Miami-Dade | Homestead Gen Aviation AP | 3.0 | 0.9 |
| South Florida | Monroe | Key West Nas | 2.0 | 0.9 |
Source: NOAA NCEI
Stations with the largest negative anomaly
| Region | County | Station | Altitude (m) | Anomaly (°C) |
|---|---|---|---|---|
| North | Dixie | Cross City AP | 12.0 | −0.4 |
| North | Levy | Usher Twr | 10.0 | −0.3 |
| South Central | Sarasota | Myakka Rvr Sp | 6.0 | −0.3 |
| South Florida | Monroe | Marathon AP | 1.0 | −0.2 |
| Northwest | Franklin | Apalachicola AP | 6.0 | −0.1 |
| South Florida | Miami-Dade | Royal Palm Rs | 2.0 | −0.1 |
| North | St. Johns | St Augustine Wtp | 4.0 | −0.1 |
| South Central | Polk | Bartow 1SE | 34.0 | −0.0 |
| North | Duval | Jacksonville Nas | 6.0 | −0.0 |
| Northwest | Franklin | Apalachicola AP | 6.0 | −0.0 |
Source: NOAA NCEI
Monthly statewide mean temperature anomaly
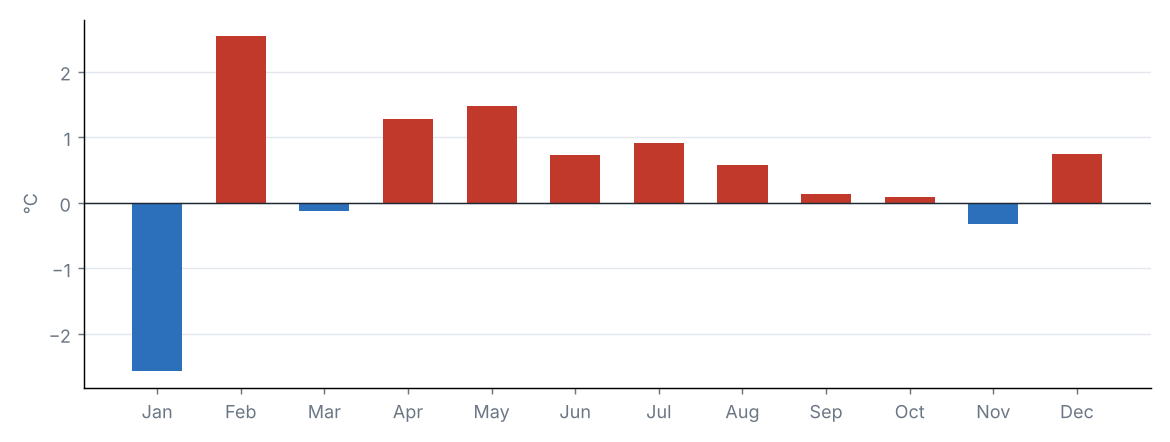
Source: NOAA NCEI
Statewide mean temperature anomaly in each year
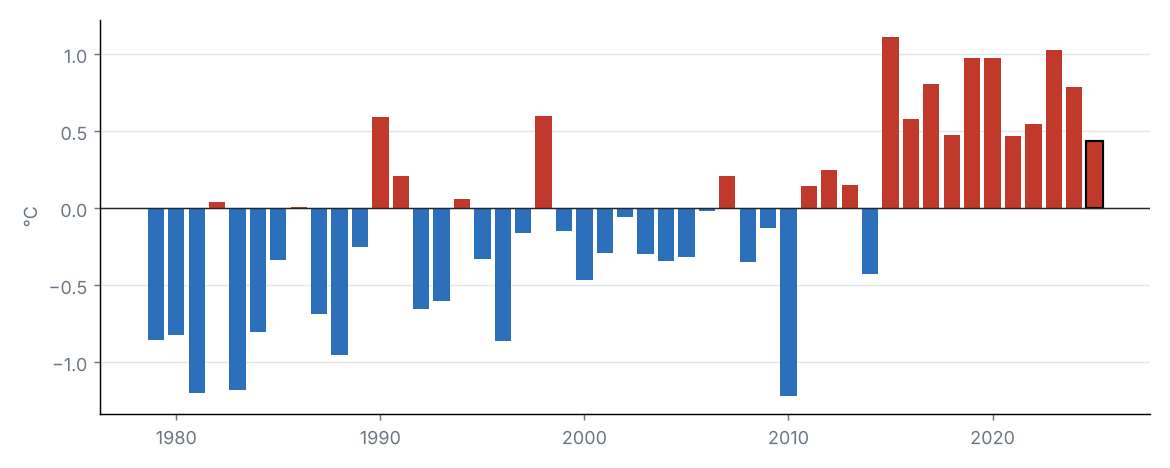
Source: NOAA NCEI
The statewide mean temperature was 22.4 °C, 0.4 °C above the 1991–2020 average (22.0 °C), category “Normal”. It was the 13th warmest year in the 1979–2025 series.
By region, the largest anomaly was in South Florida (+0.5 °C) and the smallest in Northwest (+0.4 °C).
Source: NOAA NCEI
Source: NOAA NCEI
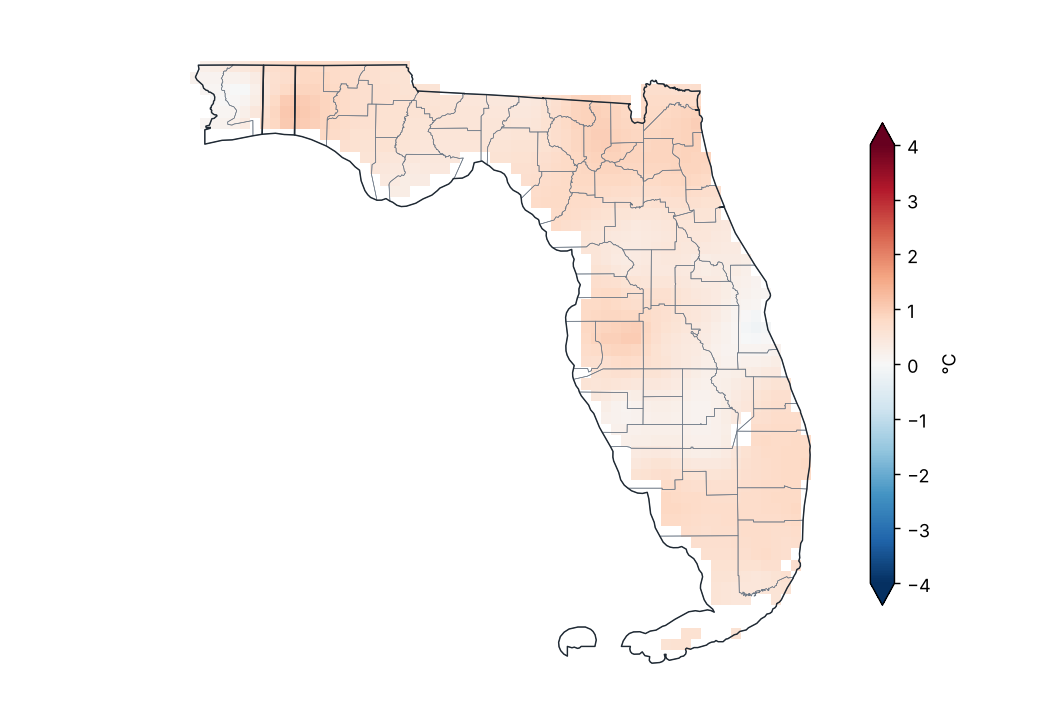
Maximum temperature anomaly (1991–2020)
Source: NOAA NCEI
Lowest and highest monthly mean maximum temperature by region
| Region | Lowest value (°C) | Station | Highest value (°C) | Station |
|---|---|---|---|---|
| Northwest | 25.2 | Pensacola 7 NNE | 27.7 | Tallahassee AP |
| North | 26.1 | Jacksonville Beach | 29.1 | Live Oak |
| North Central | 25.8 | Daytona Beach | 30.6 | Clermont 9 S |
| South Central | 27.1 | Titusville | 30.4 | Plant City |
| South Florida | 27.9 | Palm Beach Gardens | 31.2 | Everglades City 5 NE |
Station monthly means (GHCN-Daily, ≥ 80% of days with data).
Source: NOAA NCEI
The statewide maximum temperature was 28.3 °C, 0.6 °C above the 1991–2020 average (27.7 °C), category “Slightly above normal”. It was the 7th warmest year in the 1979–2025 series.
By region, the largest anomaly was in North (+0.8 °C) and the smallest in South Central (+0.4 °C).
Source: NOAA NCEI
Source: NOAA NCEI
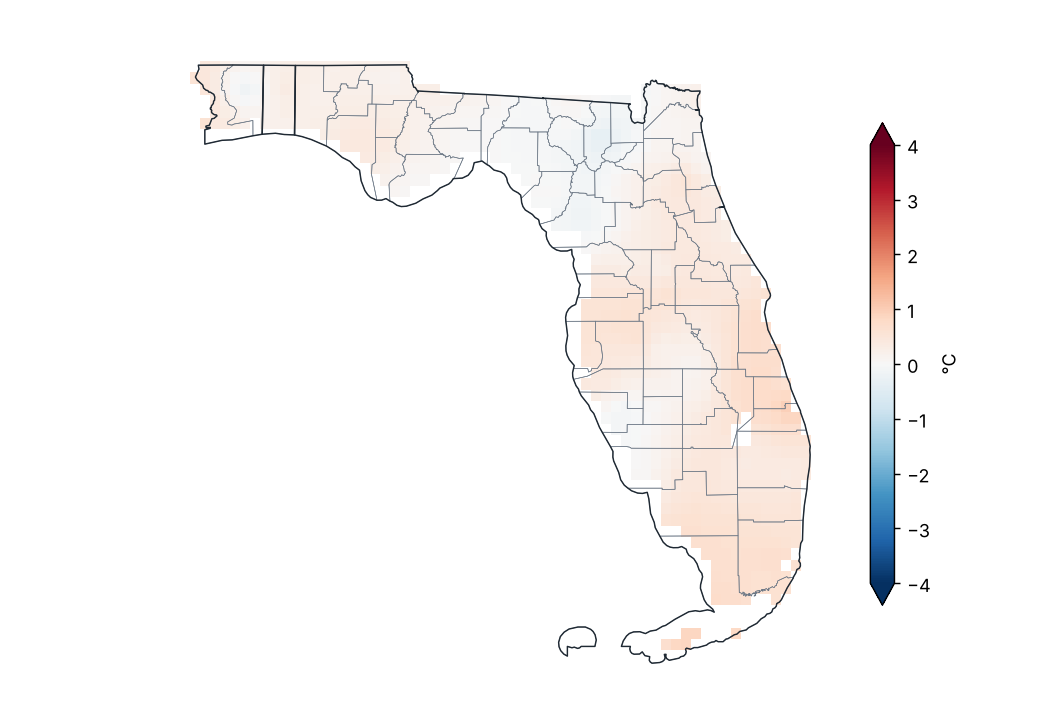
Minimum temperature anomaly (1991–2020)
Source: NOAA NCEI
Lowest and highest monthly mean minimum temperature by region
| Region | Lowest value (°C) | Station | Highest value (°C) | Station |
|---|---|---|---|---|
| Northwest | 12.9 | Crestview Faa/Ap | 17.3 | Tyndall Afb |
| North | 13.4 | Mayo | 17.9 | Mayport Pilot Stn |
| North Central | 14.4 | Inverness 3 SE | 18.3 | Orlando Executive AP |
| South Central | 16.0 | Archbold Bio Stn | 21.5 | Cocoa Beach Patrick Afb |
| South Florida | 17.8 | Punta Gorda Charlotte Co AP | 24.2 | Key West Nas |
Station monthly means (GHCN-Daily, ≥ 80% of days with data).
Source: NOAA NCEI
The statewide minimum temperature was 16.6 °C, 0.3 °C above the 1991–2020 average (16.3 °C), category “Normal”. It was the 14th warmest year in the 1979–2025 series (tied with 1990, 1994).
By region, the largest anomaly was in South Florida (+0.5 °C) and the smallest in North (+0.0 °C).
Source: NOAA NCEI
5 Climate extremes and records
Source: NOAA NCEI
Highest maximum temperature by county
| County | Station | Temperature (°C) | Date |
|---|---|---|---|
| Lake | Clermont 9 S | 40.6 | 2025-07-29 |
| Suwannee | Live Oak | 39.4 | 2025-07-29 |
| Hamilton | Jasper | 38.9 | 2025-07-29 |
| Duval | Jacksonville | 38.3 | 2025-07-28 |
| Hardee | Wauchula | 38.3 | 2025-06-12 |
| Hendry | Big Cypress | 38.3 | 2025-05-21 |
| Jackson | Marianna 7 NE | 38.3 | 2025-06-25 |
| Manatee | Ft Green 12 WSW | 38.3 | 2025-07-28 |
| Marion | Ocala | 38.3 | 2025-07-29 |
| Monroe | Bahia Honda Sp | 38.3 | 2025-08-22 |
| Okaloosa | Destin Ft Walton Beach AP | 38.3 | 2025-07-15 |
| Volusia | Deland 1 SSE | 38.3 | 2025-07-30 |
| Alachua | Gainesville Rgnl AP | 37.8 | 2025-07-27 |
| Citrus | Inverness 3 SE | 37.8 | 2025-07-29 |
| Columbia | Lake City 2 E | 37.8 | 2025-07-15 |
| Hillsborough | Plant City | 37.8 | 2025-07-29 |
| Holmes | Bonifay Tri Co AP | 37.8 | 2025-07-14 |
| Leon | Tallahassee AP | 37.8 | 2025-07-14 |
| Orange | Orlando W | 37.8 | 2025-07-30 |
| Polk | Mtn Lake | 37.8 | 2025-07-30 |
The 20 most extreme of 56.
Source: NOAA NCEI
Lowest minimum temperature by county
| County | Station | Temperature (°C) | Date |
|---|---|---|---|
| Okaloosa | Crestview Faa/Ap | −11.6 | 2025-01-23 |
| Santa Rosa | Whiting Fld Nas S | −11.6 | 2025-01-22 |
| Escambia | Pensacola Rgnl AP | −10.5 | 2025-01-22 |
| Washington | Chipley | −10.0 | 2025-01-22 |
| Lafayette | Mayo | −9.4 | 2025-01-25 |
| Jackson | Marianna Muni AP | −9.3 | 2025-01-22 |
| Leon | Tallahassee AP | −7.2 | 2025-01-24 |
| Bay | Nw Florida Beaches Intl AP | −7.1 | 2025-01-22 |
| Holmes | Bonifay Tri Co AP | −7.1 | 2025-01-23 |
| Gulf | Wewahitchka | −6.7 | 2025-01-23 |
| Dixie | Cross City AP | −6.0 | 2025-01-25 |
| Jefferson | Monticello 10 SW | −5.6 | 2025-01-23 |
| Alachua | Gainesville Rgnl AP | −5.5 | 2025-01-25 |
| Duval | Jacksonville Whitehouse Naval | −5.5 | 2025-01-25 |
| Baker | Glen St Mary 1 W | −5.0 | 2025-01-12 |
| Gadsden | Quincy 3 SSW | −5.0 | 2025-01-13 |
| Hamilton | Jasper | −5.0 | 2025-01-13 |
| Hernando | Brooksville Hernando Co AP | −4.9 | 2025-01-25 |
| Taylor | Perry Foley AP | −4.7 | 2025-01-25 |
| Citrus | Inverness 3 SE | −4.4 | 2025-01-25 |
The 20 most extreme of 56.
Source: NOAA NCEI
Station records broken
| Station | County | Variable | New value | Date | Previous record | Previous date |
|---|---|---|---|---|---|---|
| Bahia Honda Sp | Monroe | Highest maximum temperature | 38.3 | 2025-08-22 | 37.8 | 2023-07-23 |
| Big Cypress | Hendry | Highest maximum temperature | 38.3 | 2025-05-21 | 37.8 | 2023-08-08 |
| Clermont 9 S | Lake | Highest maximum temperature | 40.6 | 2025-07-29 | 38.9 | 2023-07-04 |
| Ft Green 12 WSW | Manatee | Highest maximum temperature | 38.3 | 2025-07-28 | 37.2 | 2023-08-12 |
| N Miami Beach #2 | Miami-Dade | Highest maximum temperature | 37.2 | 2025-08-08 | 36.7 | 2019-06-23 |
| Titusville | Brevard | Highest 24 h rainfall | 332.7 | 2025-10-27 | 290.6 | 1945-06-24 |
| Marianna Muni AP | Jackson | Lowest minimum temperature | −9.3 | 2025-01-22 | −8.9 | 1951-02-03 |
| Tampa Intl AP | Hillsborough | Highest maximum temperature | 37.8 | 2025-07-27 | 37.2 | 1985-06-05 |
| Whiting Fld Nas S | Santa Rosa | Lowest minimum temperature | −11.6 | 2025-01-22 | −9.4 | 1996-12-20 |
Most extreme daily value of the period against the same period in all earlier years of record (at least 20 years; for weeks, the same calendar month).
Source: NOAA NCEI
Climate-extremes indices (statewide mean)
| Index | Description | Value | Normal | Difference | Unit |
|---|---|---|---|---|---|
| TX90p | Warm days (Tmax > 90th percentile) | 18.2 | 10.0 | 8.2 | % |
| TN90p | Warm nights (Tmin > 90th percentile) | 16.0 | 10.0 | 6.0 | % |
| TX10p | Cool days (Tmax < 10th percentile) | 7.7 | 10.0 | −2.3 | % |
| TN10p | Cold nights (Tmin < 10th percentile) | 6.5 | 10.0 | −3.5 | % |
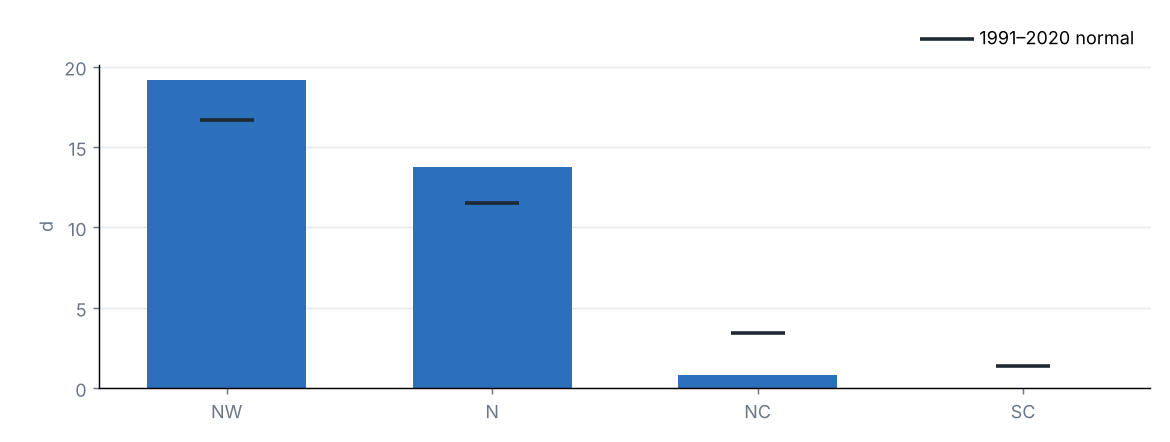
| FD | Frost days (Tmin < 0 °C) | 7.1 | 6.8 | 0.3 | d |
| SU | Summer days (Tmax > 25 °C) | 282.1 | 266.7 | 15.4 | d |
| TR | Tropical nights (Tmin > 20 °C) | 151.1 | 145.9 | 5.2 | d |
| WSDI | Warm spell days (≥ 6 days) | 27.0 | — | — | d |
| CSDI | Cold spell days (≥ 6 days) | 3.1 | — | — | d |
| Rx1day | Maximum 1-day precipitation | 60.9 | 83.5 | −22.6 | mm |
| Rx5day | Maximum 5-day precipitation | 102.1 | 150.9 | −48.8 | mm |
| CDD | Consecutive dry days (< 1 mm) | 27.9 | 25.6 | 2.3 | d |
| CWD | Consecutive wet days (≥ 1 mm) | 13.9 | 13.4 | 0.5 | d |
Percentile indices relative to calendar-day percentiles of 1991–2020 (5-day window); counts and maxima averaged over the state's grid cells.
Source: NOAA NCEI
Frost days by region
Source: NOAA NCEI
Heat and cold waves
| Dates | Type | Details |
|---|---|---|
| 2025-02-03 – 2025-02-07 | Heat wave | Up to 83% of the state above the 90th percentile of Tmax. Regions: Northwest, North, North Central, South Central and South Florida. |
| 2025-02-09 – 2025-02-11 | Heat wave | Up to 91% of the state above the 90th percentile of Tmax. Regions: Northwest, North, North Central, South Central and South Florida. |
| 2025-04-02 – 2025-04-07 | Heat wave | Up to 83% of the state above the 90th percentile of Tmax. Regions: Northwest, North, North Central, South Central and South Florida. |
| 2025-05-17 – 2025-05-22 | Heat wave | Up to 82% of the state above the 90th percentile of Tmax. Regions: North, North Central, South Central and South Florida. |
| 2025-07-20 – 2025-07-22 | Heat wave | Up to 85% of the state above the 90th percentile of Tmax. Regions: North, North Central, South Central and South Florida. |
| 2025-07-27 – 2025-08-02 | Heat wave | Up to 97% of the state above the 90th percentile of Tmax. Regions: Northwest, North, North Central, South Central and South Florida. |
| 2025-11-11 – 2025-11-13 | Cold wave | Up to 100% of the state below the 10th percentile of Tmin. Regions: Northwest, North, North Central, South Central and South Florida. |
| 2025-11-19 – 2025-11-27 | Heat wave | Up to 94% of the state above the 90th percentile of Tmax. Regions: Northwest, North, North Central, South Central and South Florida. |
Wave: at least 3 consecutive days with at least half of the state above the 90th percentile of maximum temperature (heat) or below the 10th percentile of minimum temperature (cold). At most the 10 most intense are listed.
Source: NOAA NCEI
6 Drought
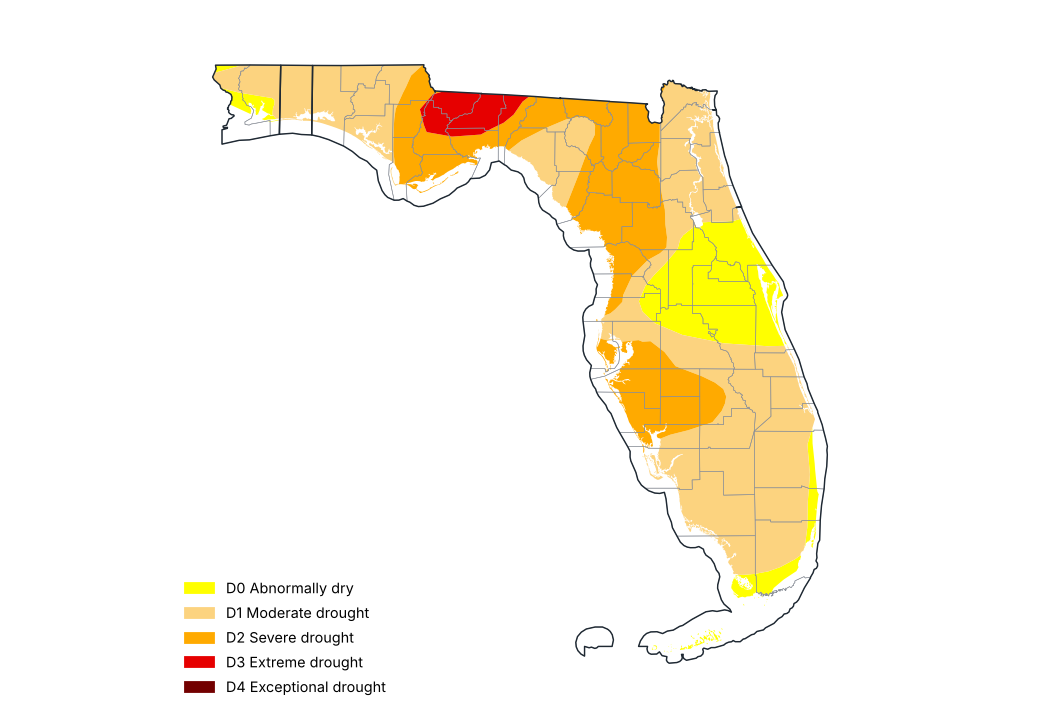
U.S. Drought Monitor, 30 December 2025
Source: National Drought Mitigation Center, USDA, NOAA
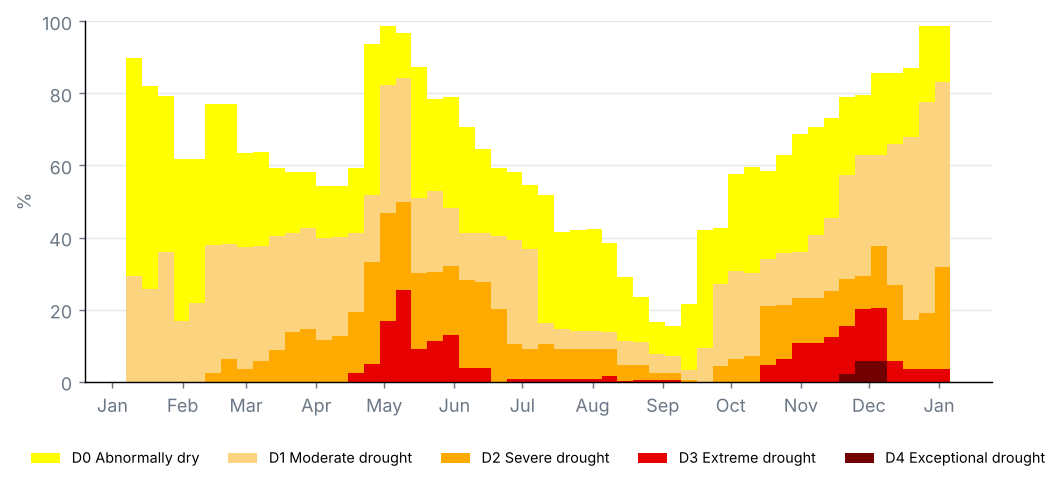
Share of the state by drought category, weekly U.S. Drought Monitor maps (%)
Source: National Drought Mitigation Center, USDA, NOAA
Counties with the most severe drought, U.S. Drought Monitor of 30 December 2025 (% of the county)
| County | D0–D4 (%) | D1–D4 (%) | D2–D4 (%) | D3–D4 (%) | D4 (%) |
|---|---|---|---|---|---|
| Gadsden | 100.0 | 100.0 | 100.0 | 98.8 | 0.0 |
| Leon | 100.0 | 100.0 | 100.0 | 97.7 | 0.0 |
| Liberty | 100.0 | 100.0 | 100.0 | 42.1 | 0.0 |
| Jefferson | 100.0 | 100.0 | 100.0 | 39.6 | 0.0 |
| Wakulla | 100.0 | 100.0 | 100.0 | 25.5 | 0.0 |
| Calhoun | 100.0 | 100.0 | 94.6 | 5.2 | 0.0 |
| Jackson | 100.0 | 100.0 | 46.9 | 0.7 | 0.0 |
| Columbia | 100.0 | 100.0 | 100.0 | 0.0 | 0.0 |
| DeSoto | 100.0 | 100.0 | 100.0 | 0.0 | 0.0 |
| Franklin | 100.0 | 100.0 | 100.0 | 0.0 | 0.0 |
Cumulative shares: D1–D4 is the share in moderate drought or worse.
Source: National Drought Mitigation Center, USDA, NOAA
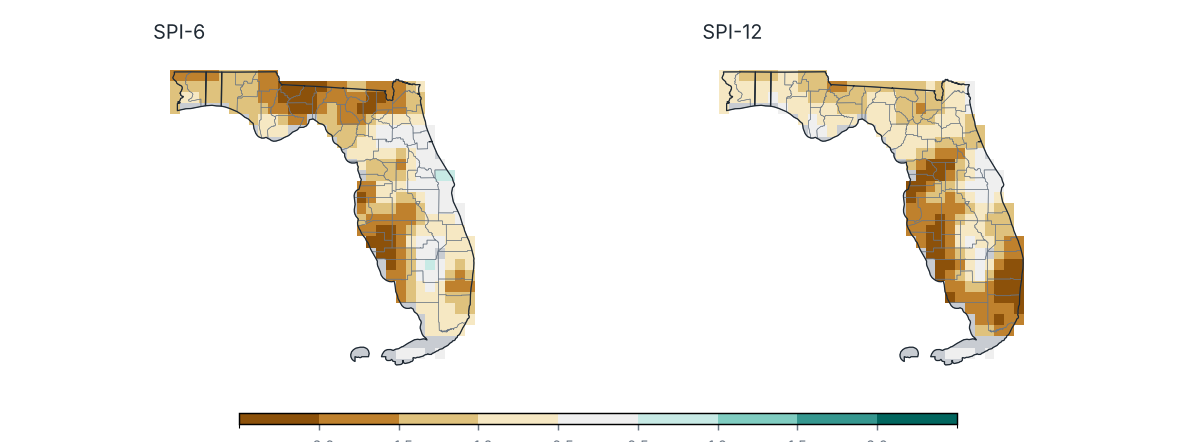
Standardized Precipitation Index (SPI) ending December 2025
Source: NOAA NCEI
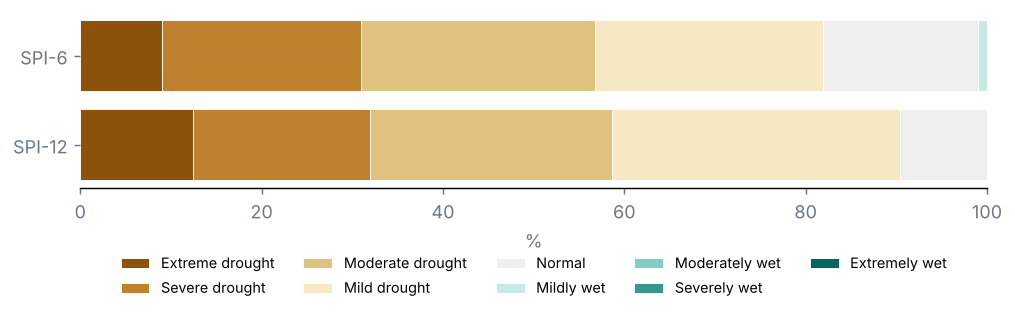
Share of the state by SPI category
Source: NOAA NCEI
Counties with the lowest SPI-12
| County | SPI-6 | SPI-12 | Category |
|---|---|---|---|
| Broward | −1.5 | −2.6 | Extreme drought |
| Hernando | −1.3 | −2.2 | Extreme drought |
| Palm Beach | −0.8 | −2.1 | Extreme drought |
| Lee | −1.7 | −2.0 | Extreme drought |
| Sumter | −1.3 | −2.0 | Extreme drought |
| Miami-Dade | −1.1 | −2.0 | Extreme drought |
| Sarasota | −2.3 | −2.0 | Severe drought |
| Manatee | −1.9 | −2.0 | Severe drought |
| Pasco | −1.3 | −1.9 | Severe drought |
| Citrus | −1.1 | −1.9 | Severe drought |
Source: NOAA NCEI
U.S. Drought Monitor, map of 30 December 2025: 83% of the state in drought (D1–D4), 32% in severe drought or worse (D2–D4) and 4% in extreme or exceptional drought (D3–D4); 99% was abnormally dry or in drought (D0–D4).
On the map of 31 December 2024, 29% of the state was in drought: a change of +54 points over the period.
Counties with the largest share in severe drought or worse (D2–D4): Gadsden (100%), Leon (100%) and Liberty (100%).
SPI-12 (Jan–Dec 2025): statewide mean −1.24; 59% of the state in drought (SPI ≤ −1.0) and 32% in severe or extreme drought.
Most affected counties: Broward (−2.59), Hernando (−2.20) and Palm Beach (−2.09).
SPI-6 (Jul–Dec 2025): 57% of the state in drought.
7 Severe weather and notable events
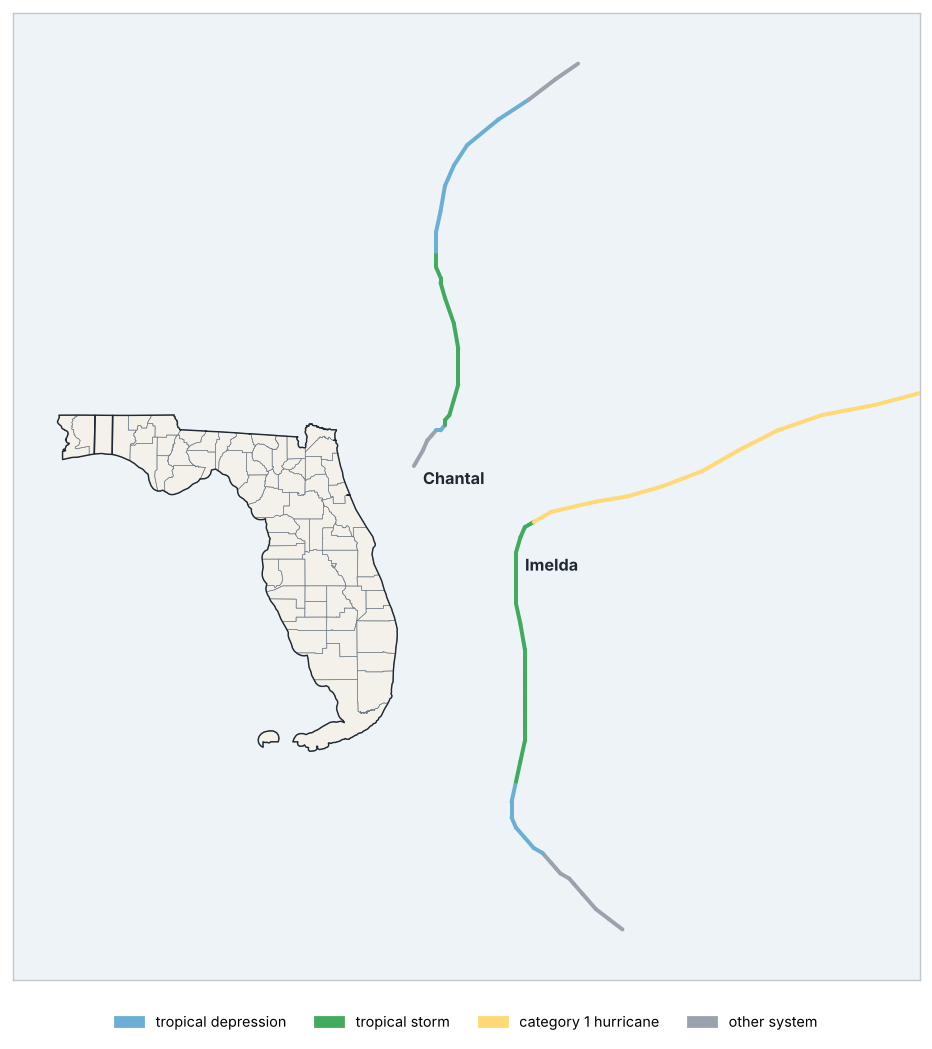
Tracks of nearby tropical cyclones
Source: NOAA NCEI
Tropical cyclones within 300 km of the state
| Name | Basin | Peak intensity | Maximum wind (km/h) | Start | End | Closest approach (km) | Landfall | Landfall intensity |
|---|---|---|---|---|---|---|---|---|
| Chantal | North Atlantic | Tropical storm | 93 | 2025-07-04 | 2025-07-07 | 155 | — | — |
| Imelda | North Atlantic | Category 1 hurricane | 148 | 2025-09-26 | 2025-10-06 | 269 | — | — |
Source: NOAA NCEI
Notable events
| Dates | Type | Area | Details |
|---|---|---|---|
| 2025-02-24 | Heavy rain | Key W Wfo | 168.1 mm in 24 hours. |
| 2025-03-10 | Heavy rain | Mayo | 165.1 mm in 24 hours. |
| 2025-03-31 | Heavy rain | Miami Beach | 184.2 mm in 24 hours. |
| 2025-06-05 | Heavy rain | Flamingo Rs | 184.2 mm in 24 hours. |
| 2025-10-26 | Heavy rain | Leesburg Muni AP | 153.2 mm in 24 hours. |
| 2025-10-27 | Heavy rain | Titusville | 332.7 mm in 24 hours. |
| 2025-10-27 | Heavy rain | Mt Plymouth 1SSW | 268.7 mm in 24 hours. |
| 2025-10-27 | Heavy rain | Lisbon | 153.2 mm in 24 hours. |
GDACS alerts and station rainfall of 150 mm or more in 24 hours (after quality control).
Source: GDACS, NOAA NCEI
Tropical cyclones within 300 km of the state: 2 (Chantal and Imelda).
9 Outlook
Outlook for Jan–Mar 2026: most likely tercile
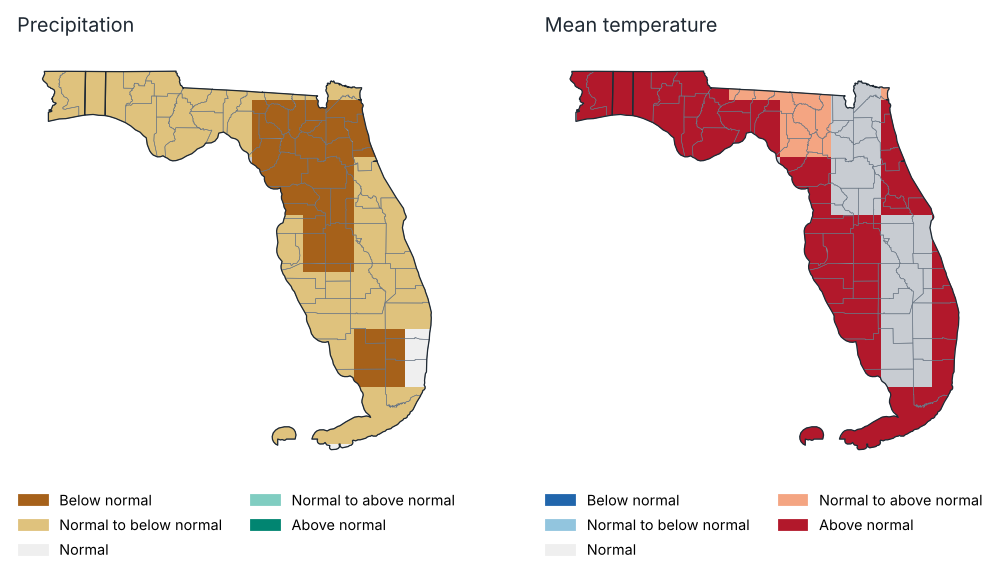
Source: NOAA CPC
Probability of each tercile by region, Jan–Mar 2026 (%)
| Region | Precipitation: below | Precipitation: normal | Precipitation: above | Temp.: below | Temp.: normal | Temp.: above |
|---|---|---|---|---|---|---|
| Northwest | 46.0 | 36.0 | 18.0 | 15.0 | 24.0 | 61.0 |
| North | 52.0 | 34.0 | 14.0 | 14.0 | 30.0 | 56.0 |
| North Central | 52.0 | 31.0 | 17.0 | 9.0 | 28.0 | 63.0 |
| South Central | 49.0 | 35.0 | 16.0 | 11.0 | 30.0 | 59.0 |
| South Florida | 47.0 | 38.0 | 15.0 | 11.0 | 25.0 | 64.0 |
Source: NOAA CPC
Probabilistic outlook from the North American Multi-Model Ensemble (NMME), initialised in January 2026, relative to 1991–2020 terciles. It is not an official forecast: consult the National Weather Service and NOAA's Climate Prediction Center.
Precipitation, Jan–Mar 2026: above normal is favoured over 0% of the state and below normal over 98%.
Mean temperature, Jan–Mar 2026: above normal is favoured over 100% of the state and below normal over 0%.
10 Annexes
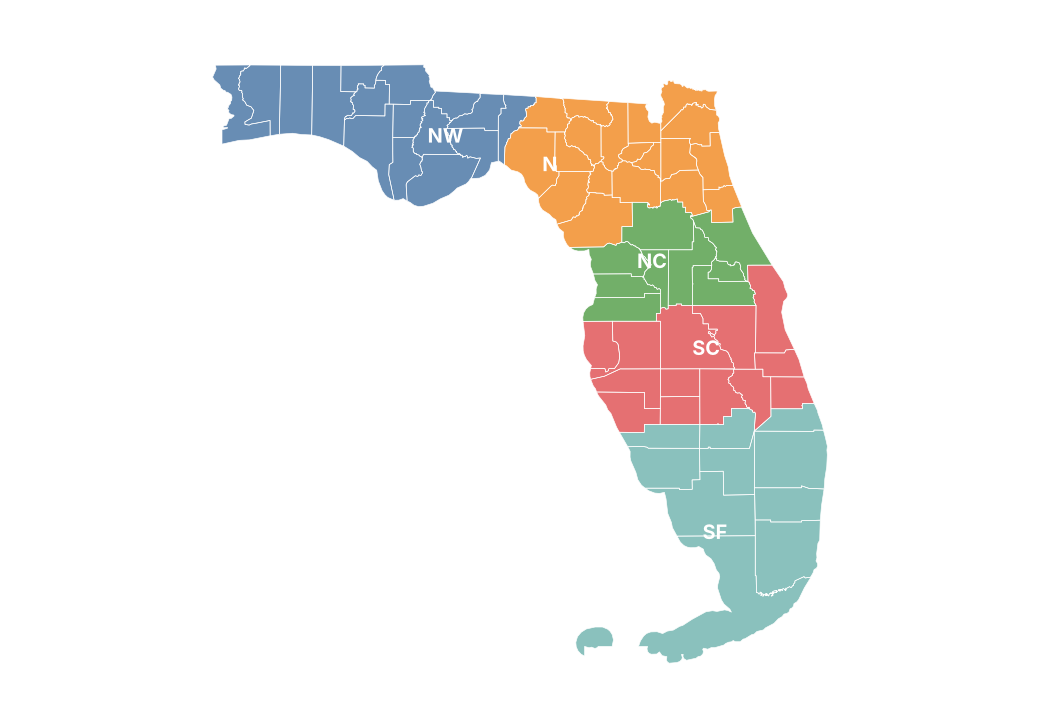
Report climate regions
Monthly precipitation by county (mm)
| County | Jan | Feb | Mar | Apr | May | Jun | Jul | Aug | Sep | Oct | Nov | Dec |
|---|---|---|---|---|---|---|---|---|---|---|---|---|
| Alachua | 85.3 | 48.6 | 134.0 | 21.3 | 90.8 | 145.3 | 261.1 | 202.9 | 98.5 | 62.3 | 0.7 | 43.9 |
| Baker | 140.9 | 41.1 | 110.7 | 17.4 | 132.1 | 140.1 | 170.3 | 201.3 | 33.4 | 28.0 | 1.8 | 55.2 |
| Bay | 77.7 | 78.9 | 131.3 | 44.4 | 175.5 | 212.8 | 174.6 | 162.1 | 47.8 | 66.7 | 20.5 | 111.5 |
| Bradford | 116.9 | 42.0 | 118.1 | 17.5 | 108.9 | 139.7 | 218.4 | 211.3 | 71.2 | 54.8 | 0.8 | 45.2 |
| Brevard | 38.0 | 52.4 | 21.1 | 22.0 | 161.1 | 129.9 | 153.5 | 161.6 | 210.2 | 203.3 | 10.0 | 48.8 |
| Broward | 27.9 | 28.4 | 55.8 | 28.7 | 104.1 | 132.2 | 124.3 | 152.4 | 233.5 | 107.4 | 21.7 | 30.1 |
| Calhoun | 89.8 | 74.9 | 127.6 | 53.8 | 145.3 | 184.0 | 143.4 | 150.2 | 38.9 | 42.2 | 19.3 | 102.9 |
| Charlotte | 32.0 | 46.4 | 26.1 | 14.8 | 105.3 | 211.6 | 167.5 | 205.7 | 126.2 | 41.5 | 2.5 | 23.6 |
| Citrus | 52.1 | 30.9 | 74.2 | 15.5 | 103.7 | 118.0 | 239.9 | 170.4 | 79.6 | 79.2 | 3.9 | 29.3 |
| Clay | 127.4 | 42.0 | 94.5 | 20.1 | 146.8 | 117.4 | 174.5 | 222.7 | 82.5 | 81.8 | 0.6 | 39.0 |
| Collier | 26.4 | 50.1 | 30.4 | 9.9 | 91.9 | 192.4 | 186.6 | 197.1 | 198.0 | 95.3 | 6.2 | 14.1 |
| Columbia | 142.3 | 38.7 | 121.2 | 21.0 | 109.9 | 136.0 | 172.3 | 199.5 | 34.5 | 20.8 | 2.6 | 61.0 |
| DeSoto | 37.7 | 52.9 | 31.1 | 13.6 | 147.4 | 216.2 | 219.9 | 198.9 | 118.7 | 29.8 | 5.2 | 22.0 |
| Dixie | 111.5 | 63.3 | 183.2 | 45.7 | 94.2 | 115.0 | 215.6 | 170.3 | 102.1 | 45.7 | 1.4 | 63.0 |
| Duval | 151.7 | 47.4 | 97.2 | 23.9 | 179.8 | 116.1 | 113.4 | 231.6 | 66.7 | 74.1 | 0.7 | 44.5 |
| Escambia | 77.7 | 81.2 | 137.8 | 96.9 | 179.0 | 185.3 | 77.8 | 224.0 | 39.0 | 132.4 | 13.0 | 137.3 |
| Flagler | 60.7 | 32.3 | 34.2 | 15.1 | 130.1 | 88.6 | 149.9 | 224.6 | 180.2 | 136.1 | 6.4 | 27.9 |
| Franklin | 88.2 | 95.2 | 105.1 | 47.0 | 138.2 | 178.5 | 225.1 | 204.5 | 53.6 | 35.8 | 13.7 | 77.3 |
| Gadsden | 113.9 | 74.3 | 136.4 | 65.3 | 99.9 | 158.6 | 96.8 | 130.9 | 17.3 | 29.5 | 10.2 | 76.9 |
| Gilchrist | 110.7 | 55.2 | 162.8 | 32.8 | 96.5 | 124.0 | 222.8 | 175.1 | 86.9 | 44.2 | 1.2 | 57.1 |
| Glades | 41.1 | 59.1 | 37.5 | 6.2 | 148.6 | 168.9 | 254.9 | 206.0 | 161.1 | 76.3 | 4.3 | 17.5 |
| Gulf | 78.6 | 95.6 | 105.3 | 39.8 | 158.9 | 204.0 | 225.6 | 194.0 | 59.1 | 47.8 | 17.4 | 92.1 |
| Hamilton | 129.4 | 44.2 | 128.1 | 31.3 | 124.1 | 120.6 | 151.5 | 214.1 | 20.4 | 20.5 | 5.3 | 84.4 |
| Hardee | 41.3 | 59.2 | 22.9 | 11.7 | 166.7 | 204.2 | 216.9 | 180.7 | 118.6 | 23.4 | 8.8 | 24.6 |
| Hendry | 30.1 | 70.4 | 28.1 | 7.5 | 129.5 | 183.6 | 235.9 | 202.7 | 193.5 | 118.5 | 3.7 | 13.3 |
| Hernando | 40.6 | 32.5 | 59.4 | 17.2 | 93.9 | 121.3 | 225.1 | 192.4 | 67.7 | 58.1 | 5.9 | 49.1 |
| Highlands | 42.4 | 62.0 | 39.4 | 10.8 | 184.1 | 191.6 | 274.1 | 180.1 | 135.1 | 44.2 | 6.2 | 20.7 |
| Hillsborough | 56.3 | 59.8 | 24.6 | 13.5 | 115.9 | 188.4 | 182.7 | 246.0 | 79.0 | 23.7 | 7.8 | 61.3 |
| Holmes | 81.0 | 70.0 | 147.8 | 72.5 | 172.9 | 158.7 | 164.6 | 149.1 | 55.5 | 48.9 | 18.0 | 128.9 |
| Indian River | 31.7 | 95.3 | 35.3 | 17.3 | 91.7 | 123.7 | 123.5 | 132.5 | 210.0 | 180.7 | 4.4 | 23.6 |
| Jackson | 96.1 | 69.3 | 130.5 | 74.0 | 125.5 | 141.1 | 115.9 | 132.2 | 29.7 | 42.1 | 21.7 | 105.4 |
| Jefferson | 117.1 | 72.3 | 158.5 | 70.9 | 90.9 | 177.6 | 117.9 | 166.1 | 47.3 | 30.1 | 2.8 | 78.1 |
| Lafayette | 139.2 | 60.3 | 184.7 | 42.5 | 103.4 | 119.2 | 168.6 | 189.4 | 63.4 | 30.5 | 1.8 | 72.6 |
| Lake | 41.5 | 29.5 | 30.0 | 11.0 | 161.9 | 152.3 | 180.0 | 152.9 | 99.8 | 102.6 | 7.7 | 52.3 |
| Lee | 24.7 | 47.4 | 20.7 | 12.7 | 91.8 | 186.3 | 153.8 | 196.5 | 151.4 | 59.7 | 0.7 | 20.2 |
| Leon | 115.6 | 74.5 | 146.4 | 66.6 | 91.5 | 196.3 | 94.9 | 152.8 | 22.5 | 28.1 | 4.8 | 80.8 |
| Levy | 84.0 | 56.6 | 152.0 | 35.2 | 97.1 | 116.3 | 256.6 | 155.7 | 116.4 | 64.1 | 1.5 | 46.8 |
| Liberty | 96.3 | 82.7 | 122.0 | 50.4 | 138.1 | 194.0 | 156.0 | 161.7 | 37.4 | 34.4 | 13.6 | 87.9 |
| Madison | 131.1 | 61.9 | 162.5 | 56.8 | 104.5 | 133.1 | 144.1 | 185.0 | 48.5 | 27.6 | 3.4 | 84.5 |
| Manatee | 38.5 | 61.5 | 22.1 | 18.7 | 99.3 | 246.2 | 156.5 | 234.0 | 59.1 | 18.7 | 7.5 | 36.9 |
| Marion | 62.9 | 34.8 | 56.7 | 17.9 | 109.8 | 145.7 | 240.8 | 172.6 | 103.7 | 89.0 | 3.4 | 23.6 |
| Martin | 29.8 | 67.0 | 51.2 | 13.6 | 95.2 | 153.6 | 141.6 | 109.8 | 198.4 | 172.4 | 8.3 | 15.5 |
| Miami-Dade | 28.6 | 17.0 | 57.6 | 16.6 | 134.9 | 153.4 | 127.1 | 199.0 | 254.4 | 104.9 | 29.2 | 17.3 |
| Monroe | — | — | — | — | — | — | — | — | — | — | — | — |
| Nassau | 129.5 | 51.5 | 104.4 | 22.6 | 161.5 | 119.9 | 116.7 | 234.8 | 44.5 | 66.9 | 1.5 | 55.4 |
| Okaloosa | 68.7 | 77.7 | 129.8 | 40.6 | 217.1 | 248.4 | 137.6 | 149.2 | 47.9 | 92.2 | 11.3 | 136.1 |
| Okeechobee | 35.7 | 75.7 | 43.3 | 13.4 | 129.8 | 163.1 | 189.4 | 137.9 | 179.1 | 104.5 | 5.5 | 20.5 |
| Orange | 44.2 | 33.4 | 28.4 | 15.6 | 220.9 | 135.6 | 171.2 | 184.4 | 128.9 | 139.8 | 6.7 | 70.8 |
| Osceola | 47.9 | 53.3 | 23.4 | 18.0 | 201.3 | 154.9 | 182.0 | 168.1 | 141.7 | 125.8 | 6.5 | 50.6 |
| Palm Beach | 25.4 | 48.7 | 42.1 | 14.5 | 107.2 | 130.3 | 156.9 | 145.2 | 199.6 | 151.0 | 9.8 | 21.6 |
| Pasco | 49.9 | 45.5 | 43.9 | 17.8 | 101.8 | 155.5 | 203.1 | 224.1 | 72.5 | 41.4 | 8.0 | 75.3 |
| Pinellas | 49.1 | 59.5 | 33.4 | 18.2 | 85.0 | 200.1 | 181.0 | 253.9 | 40.2 | 24.8 | 5.2 | 63.7 |
| Polk | 50.6 | 63.0 | 17.9 | 11.2 | 188.6 | 173.3 | 174.7 | 170.6 | 107.6 | 46.9 | 12.1 | 46.7 |
| Putnam | 82.2 | 39.4 | 70.0 | 19.4 | 115.9 | 109.5 | 221.1 | 228.5 | 123.4 | 106.6 | 1.6 | 29.0 |
| St. Johns | 110.1 | 41.7 | 62.4 | 21.2 | 140.7 | 99.5 | 140.6 | 244.9 | 110.2 | 108.1 | 1.1 | 30.5 |
| St. Lucie | 31.9 | 90.6 | 53.2 | 17.8 | 87.5 | 151.1 | 122.4 | 113.5 | 217.9 | 180.2 | 6.8 | 19.8 |
| Santa Rosa | 78.5 | 77.2 | 112.4 | 70.2 | 190.6 | 218.9 | 100.2 | 201.2 | 39.7 | 104.5 | 10.3 | 137.2 |
| Sarasota | 38.5 | 55.6 | 27.2 | 19.2 | 96.0 | 267.5 | 135.4 | 228.2 | 61.8 | 22.8 | 7.1 | 31.1 |
| Seminole | 38.0 | 27.1 | 29.1 | 17.6 | 213.3 | 115.5 | 158.3 | 199.0 | 143.5 | 159.7 | 11.0 | 58.4 |
| Sumter | 45.0 | 29.3 | 44.9 | 12.1 | 132.0 | 155.0 | 205.1 | 151.7 | 80.2 | 76.4 | 5.7 | 45.4 |
| Suwannee | 144.3 | 46.4 | 152.7 | 31.7 | 108.4 | 121.2 | 161.4 | 193.0 | 35.4 | 22.5 | 2.6 | 78.6 |
| Taylor | 124.0 | 69.5 | 178.1 | 68.3 | 91.9 | 145.7 | 166.2 | 193.4 | 88.4 | 33.1 | 1.8 | 67.0 |
| Union | 136.3 | 38.9 | 114.9 | 17.7 | 98.9 | 141.7 | 200.6 | 202.4 | 51.8 | 34.6 | 1.4 | 48.9 |
| Volusia | 45.5 | 27.7 | 27.3 | 14.1 | 168.6 | 106.4 | 148.7 | 195.8 | 199.9 | 182.9 | 13.7 | 39.8 |
| Wakulla | 110.0 | 78.0 | 140.0 | 63.2 | 102.2 | 196.0 | 133.0 | 173.9 | 37.6 | 30.2 | 6.0 | 77.8 |
| Walton | 71.2 | 78.2 | 145.3 | 40.6 | 225.3 | 235.5 | 162.4 | 142.9 | 51.0 | 78.5 | 14.1 | 130.0 |
| Washington | 79.5 | 67.2 | 144.7 | 70.3 | 159.3 | 167.0 | 157.4 | 141.3 | 43.9 | 54.9 | 24.1 | 121.9 |
Source: NOAA NCEI
Monthly maximum temperature by region (°C)
| Region | Jan | Feb | Mar | Apr | May | Jun | Jul | Aug | Sep | Oct | Nov | Dec |
|---|---|---|---|---|---|---|---|---|---|---|---|---|
| Northwest | 15.0 | 21.4 | 23.4 | 27.8 | 30.4 | 32.5 | 33.7 | 31.6 | 32.4 | 27.1 | 23.4 | 18.8 |
| North | 16.5 | 23.2 | 24.4 | 29.4 | 32.0 | 33.2 | 34.3 | 33.3 | 31.8 | 27.1 | 24.7 | 21.1 |
| North Central | 18.1 | 25.1 | 25.9 | 29.8 | 32.4 | 32.9 | 33.8 | 33.5 | 31.8 | 28.3 | 25.3 | 23.5 |
| South Central | 19.8 | 26.2 | 26.3 | 29.5 | 32.2 | 32.6 | 33.6 | 33.7 | 31.7 | 29.5 | 26.2 | 24.8 |
| South Florida | 22.9 | 27.9 | 27.9 | 29.9 | 32.6 | 33.1 | 33.7 | 34.1 | 32.4 | 30.7 | 27.9 | 27.1 |
Source: NOAA NCEI
Monthly mean temperature by region (°C)
| Region | Jan | Feb | Mar | Apr | May | Jun | Jul | Aug | Sep | Oct | Nov | Dec |
|---|---|---|---|---|---|---|---|---|---|---|---|---|
| Northwest | 8.2 | 15.3 | 16.4 | 21.1 | 24.6 | 27.2 | 28.6 | 27.0 | 25.7 | 20.9 | 16.0 | 12.5 |
| North | 9.4 | 16.5 | 17.0 | 22.0 | 25.4 | 27.6 | 28.9 | 28.3 | 25.7 | 21.4 | 16.7 | 14.3 |
| North Central | 12.0 | 19.0 | 18.8 | 23.1 | 26.3 | 27.7 | 28.8 | 28.7 | 26.9 | 23.2 | 18.6 | 17.1 |
| South Central | 14.0 | 20.4 | 19.5 | 23.5 | 26.7 | 27.8 | 28.7 | 28.9 | 27.3 | 24.6 | 19.6 | 18.8 |
| South Florida | 17.2 | 22.3 | 21.1 | 24.0 | 27.2 | 28.4 | 29.0 | 29.4 | 28.1 | 26.3 | 22.1 | 21.6 |
Source: NOAA NCEI
Monthly minimum temperature by region (°C)
| Region | Jan | Feb | Mar | Apr | May | Jun | Jul | Aug | Sep | Oct | Nov | Dec |
|---|---|---|---|---|---|---|---|---|---|---|---|---|
| Northwest | 1.5 | 9.2 | 9.5 | 14.5 | 18.7 | 21.9 | 23.4 | 22.4 | 18.9 | 14.8 | 8.6 | 6.2 |
| North | 2.2 | 9.9 | 9.6 | 14.7 | 18.9 | 22.0 | 23.4 | 23.3 | 19.7 | 15.6 | 8.7 | 7.6 |
| North Central | 5.9 | 13.0 | 11.6 | 16.4 | 20.3 | 22.5 | 23.7 | 23.8 | 21.9 | 18.0 | 11.9 | 10.8 |
| South Central | 8.1 | 14.7 | 12.7 | 17.4 | 21.3 | 23.0 | 23.9 | 24.1 | 22.9 | 19.7 | 13.0 | 12.8 |
| South Florida | 11.6 | 16.8 | 14.3 | 18.2 | 21.9 | 23.7 | 24.4 | 24.6 | 23.8 | 21.9 | 16.2 | 16.1 |
Source: NOAA NCEI
Stations used
| Id | Name | County | Latitude | Longitude | Altitude (m) | Days with data (Tmax) (%) |
|---|---|---|---|---|---|---|
| USC00080211 | Apalachicola AP | Franklin | 29.7 | −85.0 | 6.1 | 96.0 |
| USC00080236 | Archbold Bio Stn | Highlands | 27.2 | −81.4 | 41.5 | 100.0 |
| USC00080414 | Bahia Honda Sp | Monroe | 24.7 | −81.3 | 2.4 | 100.0 |
| USC00080478 | Bartow 1SE | Polk | 27.9 | −81.8 | 34.1 | 100.0 |
| USC00080598 | Bell 4NW | Gilchrist | 29.8 | −82.9 | 9.8 | 36.0 |
| USC00080737 | Big Cypress | Hendry | 26.3 | −81.0 | 4.6 | 99.0 |
| USC00080945 | Bradenton 5 ESE | Manatee | 27.4 | −82.5 | 5.2 | 100.0 |
| USC00081276 | Canal Pt Usda | Palm Beach | 26.9 | −80.6 | 9.1 | 74.0 |
| USC00081306 | Cape Florida | Miami-Dade | 25.7 | −80.2 | 1.8 | 100.0 |
| USC00081544 | Chipley | Washington | 30.8 | −85.6 | 39.6 | 95.0 |
| USC00081641 | Clermont 9 S | Lake | 28.5 | −81.7 | 39.6 | 91.0 |
| USC00082008 | Cross City 1 E | Dixie | 29.6 | −83.1 | 12.8 | 4.0 |
| USC00082046 | Curry Hammock Sp | Monroe | 24.7 | −81.0 | 1.2 | 100.0 |
| USC00082150 | Daytona Beach | Volusia | 29.2 | −81.0 | 8.8 | 100.0 |
| USC00082229 | Deland 1 SSE | Volusia | 29.0 | −81.3 | 7.6 | 93.0 |
| USC00082288 | Desoto City 8 SW | Highlands | 27.4 | −81.5 | 26.5 | 0.0 |
| USC00082298 | Devils Garden | Hendry | 26.7 | −81.1 | 7.9 | 0.0 |
| USC00082418 | Dry Tortugas | Monroe | 24.6 | −82.9 | 0.9 | 100.0 |
| USC00082944 | Fernandina Beach | Nassau | 30.7 | −81.5 | 14.9 | 89.0 |
| USC00083020 | Flamingo Rs | Monroe | 25.1 | −80.9 | 0.9 | 55.0 |
| USC00083153 | Ft Green 12 WSW | Manatee | 27.6 | −82.1 | 34.1 | 100.0 |
| USC00083163 | Ft Lauderdale | Broward | 26.1 | −80.2 | 4.9 | 96.0 |
| USC00083168 | Ft Lauderdale Beach | Broward | 26.1 | −80.1 | 1.2 | 81.0 |
| USC00083207 | Ft Pierce | St. Lucie | 27.4 | −80.4 | 7.6 | 98.0 |
| USC00083209 | Ft Pierce Arc | St. Lucie | 27.4 | −80.4 | 6.1 | 12.0 |
| USC00083470 | Glen St Mary 1 W | Baker | 30.3 | −82.2 | 39.0 | 65.0 |
| USC00083874 | Hastings 4NE | St. Johns | 29.8 | −81.5 | 3.0 | 100.0 |
| USC00083909 | Hialeah | Miami-Dade | 25.8 | −80.3 | 3.7 | 93.0 |
| USC00083986 | Hillsborough Rvr Sp | Hillsborough | 28.1 | −82.2 | 16.2 | 0.0 |
| USC00084050 | Hollywood | Broward | 26.0 | −80.1 | 2.7 | 93.0 |
| USC00084095 | Homestead Gen Aviation AP | Miami-Dade | 25.5 | −80.5 | 2.7 | 98.0 |
| USC00084289 | Inverness 3 SE | Citrus | 28.8 | −82.3 | 17.7 | 100.0 |
| USC00084366 | Jacksonville Beach | Duval | 30.3 | −81.4 | 3.0 | 99.0 |
| USC00084394 | Jasper | Hamilton | 30.5 | −82.9 | 39.6 | 78.0 |
| USC00084412 | John Pennekamp Sp | Monroe | 25.2 | −80.3 | 1.8 | 99.0 |
| USC00084461 | Juno Beach | Palm Beach | 26.9 | −80.1 | 1.5 | 72.0 |
| USC00084500 | Kenansville | Osceola | 27.9 | −81.0 | 18.6 | 57.0 |
| USC00084571 | Key W Wfo | Monroe | 24.6 | −81.8 | 1.2 | 100.0 |
| USC00084621 | Kissimmee Prairie Preserve | Okeechobee | 27.6 | −81.1 | 21.9 | 88.0 |
| USC00084625 | Kissimmee 2 | Osceola | 28.3 | −81.4 | 18.3 | 94.0 |
| USC00084731 | Lake City 2 E | Columbia | 30.2 | −82.6 | 59.4 | 90.0 |
| USC00084802 | Lakeland 2 | Polk | 28.0 | −82.0 | 42.4 | 100.0 |
| USC00085076 | Lisbon | Lake | 28.9 | −81.8 | 20.7 | 93.0 |
| USC00085099 | Live Oak | Suwannee | 30.3 | −83.0 | 40.2 | 99.0 |
| USC00085184 | Loxahatchee Nwr | Palm Beach | 26.5 | −80.2 | 6.4 | 87.0 |
| USC00085359 | Marco Is | Collier | 25.9 | −81.7 | 3.0 | 100.0 |
| USC00085377 | Marianna 7 NE | Jackson | 30.7 | −85.0 | 35.1 | 67.0 |
| USC00085539 | Mayo | Lafayette | 30.1 | −83.2 | 25.3 | 98.0 |
| USC00085612 | Melbourne Wfo | Brevard | 28.1 | −80.7 | 10.7 | 99.0 |
| USC00085667 | Miami Nwsfo | Miami-Dade | 25.8 | −80.4 | 4.3 | 99.0 |
| USC00085880 | Monticello 10 SW | Jefferson | 30.4 | −84.0 | 66.8 | 98.0 |
| USC00085895 | Moore Haven Lock 1 | Glades | 26.8 | −81.1 | 10.7 | 97.0 |
| USC00085973 | Mtn Lake | Polk | 27.9 | −81.6 | 38.1 | 99.0 |
| USC00086048 | Muse | Glades | 26.8 | −81.5 | 13.1 | 0.0 |
| USC00086065 | Myakka Rvr Sp | Sarasota | 27.2 | −82.3 | 5.8 | 100.0 |
| USC00086078 | Naples | Collier | 26.2 | −81.7 | 12.2 | 52.0 |
| USC00086092 | Nettles Is | St. Lucie | 27.3 | −80.2 | 3.0 | 99.0 |
| USC00086240 | Niceville | Okaloosa | 30.5 | −86.5 | 22.6 | 100.0 |
| USC00086315 | N Miami Beach #2 | Miami-Dade | 25.9 | −80.2 | 3.0 | 96.0 |
| USC00086319 | N Port | Sarasota | 27.0 | −82.2 | 3.7 | 0.0 |
| USC00086414 | Ocala | Marion | 29.2 | −82.1 | 22.9 | 96.0 |
| USC00086634 | Orlando W | Orange | 28.5 | −81.5 | 45.7 | 98.0 |
| USC00086761 | Palm Bay | Brevard | 27.9 | −80.6 | 8.2 | 99.0 |
| USC00086764 | Palm Beach Gardens | Palm Beach | 26.8 | −80.1 | 6.1 | 89.0 |
| USC00086767 | Palm Coast 6NE | Flagler | 29.6 | −81.2 | 1.5 | 92.0 |
| USC00086999 | Pensacola 7 NNE | Escambia | 30.5 | −87.2 | 34.7 | 100.0 |
| USC00087020 | Perrine 4W | Miami-Dade | 25.6 | −80.4 | 3.0 | 0.0 |
| USC00087025 | Perry | Taylor | 30.1 | −83.6 | 13.7 | 0.0 |
| USC00087205 | Plant City | Hillsborough | 28.0 | −82.1 | 33.2 | 100.0 |
| USC00087228 | Mt Plymouth 1SSW | Lake | 28.8 | −81.5 | 27.4 | 100.0 |
| USC00087261 | New Smyrna Bch - Marine Discov | Volusia | 29.0 | −80.9 | 4.9 | 100.0 |
| USC00087304 | Port Salerno 5W | Martin | 27.1 | −80.3 | 3.7 | 100.0 |
| USC00087429 | Quincy 3 SSW | Gadsden | 30.5 | −84.6 | 72.2 | 36.0 |
| USC00087760 | Royal Palm Rs | Miami-Dade | 25.4 | −80.6 | 2.1 | 90.0 |
| USC00087826 | St Augustine Wtp | St. Johns | 29.9 | −81.3 | 3.7 | 88.0 |
| USC00087851 | Saint Leo | Pasco | 28.3 | −82.3 | 52.7 | 100.0 |
| USC00087887 | St Petersburg 2 | Pinellas | 27.8 | −82.7 | 6.7 | 0.0 |
| USC00087982 | Sanford | Seminole | 28.8 | −81.3 | 3.7 | 98.0 |
| USC00088051 | Scottsmoor 2.5 SSW | Brevard | 28.7 | −80.9 | 12.8 | 99.0 |
| USC00088368 | S Bay 15 S | Palm Beach | 26.5 | −80.6 | 6.1 | 100.0 |
| USC00088620 | Stuart | Martin | 27.2 | −80.2 | 4.0 | 99.0 |
| USC00088756 | Tallahassee AP | Leon | 30.4 | −84.4 | 16.8 | 99.0 |
| USC00088782 | Tampa Bay Area Wfo | Hillsborough | 27.7 | −82.4 | 12.2 | 100.0 |
| USC00088784 | Tampa 6 NE | Hillsborough | 28.1 | −82.5 | 13.4 | 0.0 |
| USC00088824 | Tarpon Spgs Sewage Plt | Pinellas | 28.2 | −82.8 | 1.8 | 100.0 |
| USC00088942 | Titusville | Brevard | 28.6 | −80.8 | 4.9 | 97.0 |
| USC00089120 | Usher Twr | Levy | 29.4 | −82.8 | 10.1 | 100.0 |
| USC00089176 | Venice | Sarasota | 27.1 | −82.4 | 2.4 | 100.0 |
| USC00089219 | Vero Beach 4SE | Indian River | 27.7 | −80.4 | 6.1 | 99.0 |
| USC00089401 | Wauchula | Hardee | 27.5 | −81.8 | 18.3 | 100.0 |
| USC00089566 | Wewahitchka | Gulf | 30.1 | −85.2 | 13.4 | 99.0 |
| USC00089795 | Woodruff Dam | Jackson | 30.7 | −84.9 | 32.6 | 0.0 |
| USW00003818 | Marianna Muni AP | Jackson | 30.8 | −85.2 | 32.6 | 100.0 |
| USW00003852 | Valparaiso Hurlburt Fld | Okaloosa | 30.4 | −86.7 | 11.9 | 98.0 |
| USW00003853 | Mayport Pilot Stn | Duval | 30.4 | −81.4 | 4.9 | 96.0 |
| USW00003855 | Pensacola Forest Sherman Nas | Escambia | 30.4 | −87.3 | 8.5 | 65.0 |
| USW00012809 | Bartow Muni AP | Polk | 27.9 | −81.8 | 57.0 | 0.0 |
| USW00012810 | Macdill Afb | Hillsborough | 27.9 | −82.5 | 7.9 | 98.0 |
| USW00012812 | Punta Gorda Charlotte Co AP | Charlotte | 26.9 | −82.0 | 6.1 | 100.0 |
| USW00012815 | Orlando Intl AP | Orange | 28.4 | −81.3 | 27.1 | 100.0 |
| USW00012816 | Gainesville Rgnl AP | Alachua | 29.7 | −82.3 | 40.5 | 100.0 |
| USW00012818 | Brooksville Hernando Co AP | Hernando | 28.5 | −82.5 | 19.8 | 100.0 |
| USW00012819 | Leesburg Muni AP | Lake | 28.8 | −81.8 | 20.7 | 100.0 |
| USW00012826 | Homestead Afb | Miami-Dade | 25.5 | −80.4 | 4.9 | 98.0 |
| USW00012832 | Apalachicola AP | Franklin | 29.7 | −85.0 | 5.5 | 99.0 |
| USW00012833 | Cross City AP | Dixie | 29.6 | −83.1 | 11.6 | 88.0 |
| USW00012834 | Daytona Beach Intl AP | Volusia | 29.2 | −81.1 | 7.9 | 100.0 |
| USW00012835 | Ft Myers Page Fld AP | Lee | 26.6 | −81.9 | 4.0 | 100.0 |
| USW00012836 | Key W Intl AP | Monroe | 24.6 | −81.8 | 0.3 | 100.0 |
| USW00012838 | Melbourne Intl AP | Brevard | 28.1 | −80.6 | 6.7 | 100.0 |
| USW00012839 | Miami Intl AP | Miami-Dade | 25.8 | −80.3 | 1.5 | 100.0 |
| USW00012841 | Orlando Executive AP | Orange | 28.5 | −81.3 | 31.7 | 100.0 |
| USW00012842 | Tampa Intl AP | Hillsborough | 28.0 | −82.5 | 1.8 | 100.0 |
| USW00012843 | Vero Beach Intl AP | Indian River | 27.7 | −80.4 | 5.8 | 100.0 |
| USW00012844 | W Palm Beach Intl AP | Palm Beach | 26.7 | −80.1 | 3.7 | 100.0 |
| USW00012849 | Ft Lauderdale Intl AP | Broward | 26.1 | −80.2 | 0.9 | 99.0 |
| USW00012850 | Key West Nas | Monroe | 24.6 | −81.7 | 1.8 | 97.0 |
| USW00012854 | Orlando Sanford AP | Seminole | 28.8 | −81.2 | 14.9 | 100.0 |
| USW00012861 | Ocala Jim Taylor Fld | Marion | 29.2 | −82.2 | 26.5 | 0.0 |
| USW00012867 | Cocoa Beach Patrick Afb | Brevard | 28.2 | −80.6 | 3.0 | 92.0 |
| USW00012868 | Cape Kennedy Afs | Brevard | 28.5 | −80.6 | 4.9 | 98.0 |
| USW00012871 | Sarasota Bradenton AP | Manatee | 27.4 | −82.6 | 5.2 | 100.0 |
| USW00012873 | St Petersburg Clearwater Intl | Pinellas | 27.9 | −82.7 | 0.0 | 100.0 |
| USW00012876 | Winter Haven Gilbert AP | Polk | 28.1 | −81.8 | 43.6 | 99.0 |
| USW00012882 | Miami Opa Locka AP | Miami-Dade | 25.9 | −80.3 | 1.2 | 99.0 |
| USW00012883 | Lakeland Linder Rgnl AP | Polk | 28.0 | −82.0 | 45.1 | 100.0 |
| USW00012885 | Ft Lauderdale Executive AP | Broward | 26.2 | −80.2 | 3.7 | 87.0 |
| USW00012888 | Miami Kendall Tamiami Exec AP | Miami-Dade | 25.6 | −80.4 | 1.8 | 76.0 |
| USW00012894 | Ft Myers SW Florida Rgnl AP | Lee | 26.5 | −81.8 | 8.2 | 100.0 |
| USW00012895 | Ft Pierce St Lucie Co Intl AP | St. Lucie | 27.5 | −80.4 | 5.8 | 100.0 |
| USW00012896 | Marathon AP | Monroe | 24.7 | −81.0 | 0.9 | 100.0 |
| USW00012897 | Naples Muni AP | Collier | 26.2 | −81.8 | 2.1 | 100.0 |
| USW00013846 | Tyndall Afb | Bay | 30.1 | −85.6 | 7.0 | 98.0 |
| USW00013858 | Valparaiso Eglin Afb | Okaloosa | 30.5 | −86.5 | 18.0 | 98.0 |
| USW00013884 | Crestview Faa/Ap | Okaloosa | 30.8 | −86.5 | 46.9 | 100.0 |
| USW00013889 | Jacksonville | Duval | 30.5 | −81.7 | 48.8 | 100.0 |
| USW00013899 | Pensacola Rgnl AP | Escambia | 30.5 | −87.2 | 36.0 | 100.0 |
| USW00053847 | Whiting Fld Nas S | Santa Rosa | 30.7 | −87.0 | 50.0 | 95.0 |
| USW00053848 | Choctaw Naval Outlying Fld Mil | Santa Rosa | 30.5 | −87.0 | 34.1 | 42.0 |
| USW00053853 | Destin Ft Walton Beach AP | Okaloosa | 30.4 | −86.5 | 5.5 | 100.0 |
| USW00053860 | Jacksonville Craig Muni AP | Duval | 30.3 | −81.5 | 11.9 | 100.0 |
| USW00053862 | Perry Foley AP | Taylor | 30.1 | −83.6 | 13.7 | 93.0 |
| USW00063871 | Bonifay Tri Co AP | Holmes | 30.8 | −85.6 | 31.1 | 99.0 |
| USW00063890 | Jacksonville Whitehouse Naval | Duval | 30.4 | −81.9 | 27.1 | 65.0 |
| USW00073805 | Nw Florida Beaches Intl AP | Bay | 30.3 | −85.8 | 17.1 | 97.0 |
| USW00092805 | Pompano Beach Airpark | Broward | 26.2 | −80.1 | 4.6 | 87.0 |
| USW00092806 | St Petersburg Albert Whitted A | Pinellas | 27.8 | −82.6 | 1.2 | 98.0 |
| USW00092809 | Hollywood N Perry AP | Broward | 26.0 | −80.2 | 1.8 | 99.0 |
| USW00092811 | Miami Beach | Miami-Dade | 25.8 | −80.1 | 2.4 | 0.0 |
| USW00092814 | St Augustine AP | St. Johns | 30.0 | −81.3 | 3.0 | 0.0 |
| USW00092821 | Titusville 7 E | Brevard | 28.6 | −80.7 | 0.9 | 100.0 |
| USW00092826 | Everglades City 5 NE | Collier | 25.9 | −81.3 | 1.2 | 100.0 |
| USW00092827 | Sebring 23 SSE | Highlands | 27.2 | −81.4 | 45.7 | 100.0 |
| USW00093805 | Tallahassee | Leon | 30.4 | −84.3 | 53.9 | 100.0 |
| USW00093837 | Jacksonville Nas | Duval | 30.2 | −81.7 | 6.1 | 98.0 |
| USW00093841 | Whiting Fld Nas | Santa Rosa | 30.7 | −87.0 | 60.7 | 89.0 |
Source: NOAA NCEI
11 Glossary, methodology and sources
Anomaly: difference between the observed value and its 1991–2020 normal. Percent of normal: observed total divided by the normal, times 100. Station record: most extreme daily value for the same month in all earlier years of record (at least 20 years).
Temperature: NOAA nClimGrid-Daily. Precipitation: NOAA nClimGrid-Daily. nClimGrid-Daily is the grid behind NOAA's official statewide values; it is averaged here from 1/24° to 1/8° (about 12 km). Mean temperature is (Tmax + Tmin)/2. Statewide, regional and county averages are weighted by the area of each grid cell inside each polygon. Temperature maps, frost days and annex tables are given by region; regions are NOAA NCEI climate divisions, with each county in the division of its centroid. Recent weeks use NCEI's preliminary file of the month; such reports are marked preliminary and updated when the final file is published. Normals refer to 1991-2020; ranks compare values rounded to one decimal. Stations: GHCN-Daily (NOAA NCEI) cooperative and first-order stations; values flagged by its quality control are discarded, as are daily values more than 5 robust standard deviations from the station median and variables whose monthly anomaly differs by more than 3 °C from the gridded analysis. Period means require at least 80% of days with data and station normals at least 20 complete years. This report is generated automatically and does not replace official information from the National Weather Service or the state climatologist.
| Source | Product | License | Citation |
|---|---|---|---|
| NOAA CPC | ONI, Niño-region SST indices (OISST v2.1), NAO and AO | Public domain (NOAA) | NOAA Climate Prediction Center climate indices. |
| NOAA NCEI / PSL | Extended Reconstructed SST v5 (ERSST v5), 2° | Public domain (NOAA) | Huang et al. (2017), J. Climate, doi:10.1175/JCLI-D-16-0836.1 |
| GDACS | Global Disaster Alert and Coordination System event list | See provider terms | — |
| NOAA NCEI | GHCN-Daily | Public domain (NOAA) | Menne et al. (2012), J. Atmos. Oceanic Technol., doi:10.1175/JTECH-D-11-00103.1 |
| NOAA NCEI | IBTrACS v04r01 tropical-cyclone best tracks | Public domain (NOAA) | Knapp et al. (2010), Bull. Amer. Meteor. Soc., doi:10.1175/2009BAMS2755.1 |
| NOAA NCEI | Pacific Decadal Oscillation index (ERSST v5) | Public domain (NOAA) | — |
| NOAA NCEI | nClimGrid-Daily, contiguous United States (1/24°, averaged here to 1/8°) | Public domain (NOAA) | Durre, I., et al. (2022). NOAA's nClimGrid-Daily Version 1. NOAA National Centers for Environmental Information. doi:10.25921/c4gt-r169 |
| NOAA CPC | North American Multi-Model Ensemble (NMME) tercile probabilities, 1° | Public domain (NOAA) | Kirtman et al. (2014), Bull. Amer. Meteor. Soc., doi:10.1175/BAMS-D-12-00050.1 |
| National Drought Mitigation Center, USDA, NOAA | U.S. Drought Monitor, weekly maps and area statistics | Free to use with credit (NDMC) | The U.S. Drought Monitor is jointly produced by the National Drought Mitigation Center at the University of Nebraska-Lincoln, the United States Department of Agriculture and the National Oceanic and Atmospheric Administration. Map courtesy of NDMC. |
| US Census Bureau TIGERweb | US Census Bureau, TIGERweb counties (generalised) | Public domain (US Government work) | — |
Generated by ClimaBulletin (climabulletin.org), open source. Questions and comments: [email protected].