California · Annual
Year 2025
Downloads
1 Key messages and climate synopsis
Source: NOAA NCEI
Source: NOAA NCEI
2 Global and regional climate drivers
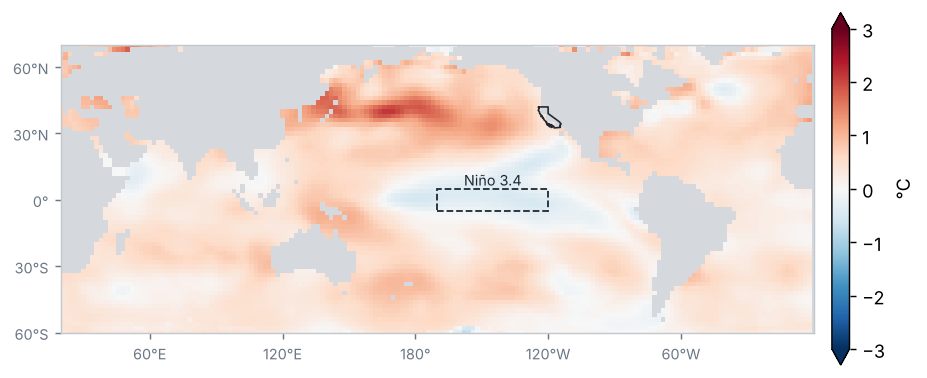
Sea-surface temperature anomaly, Year 2025 (°C, 1991–2020)
Source: NOAA NCEI / PSL
Sea-surface temperature anomaly in the Niño regions (°C)
| Region | Anomaly (°C) | Change from preceding period (°C) |
|---|---|---|
| Niño 1+2 | 0.2 | 0.3 |
| Niño 3 | −0.2 | −0.5 |
| Niño 3.4 | −0.3 | −0.7 |
| Niño 4 | −0.2 | −0.8 |
Mean of the months in the period (OISST v2.1)
Source: NOAA CPC
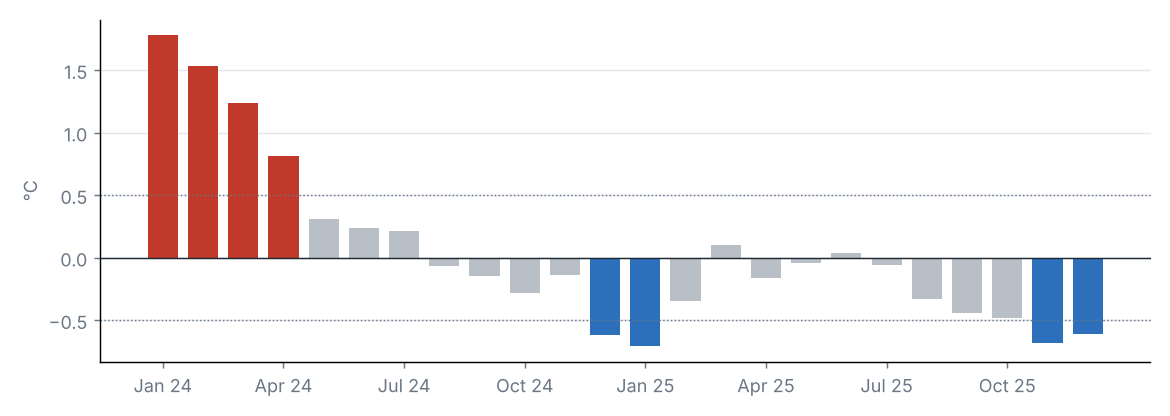
La Niña conditions of weak intensity: the Oceanic Niño Index (ONI) for OND 2025 was −0.6 °C.
Source: NOAA CPC
Monthly Niño 3.4 anomaly, last 24 months (°C)
Source: NOAA CPC
Teleconnection indices
| Index | Value | Phase |
|---|---|---|
| NAO | 0.0 | Neutral |
| AO | 0.2 | Neutral |
| PDO | −2.0 | Negative |
North Atlantic Oscillation (NAO); Arctic Oscillation (AO); Pacific Decadal Oscillation (PDO).
Source: NOAA CPC, NOAA NCEI
The Niño 3.4 anomaly was −0.31 °C (−0.71 °C relative to the preceding period).
Other indices: NAO +0.02 (neutral phase); AO +0.20 (neutral phase); PDO −1.99 (negative phase).
3 Precipitation
Source: NOAA NCEI
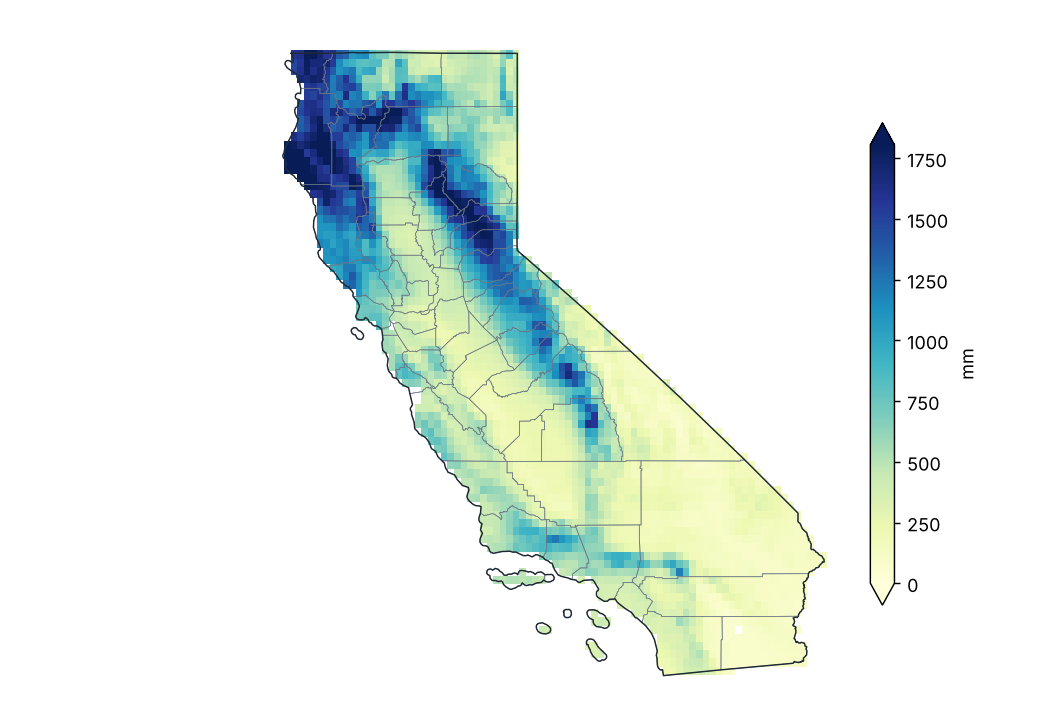
Accumulated precipitation
Source: NOAA NCEI
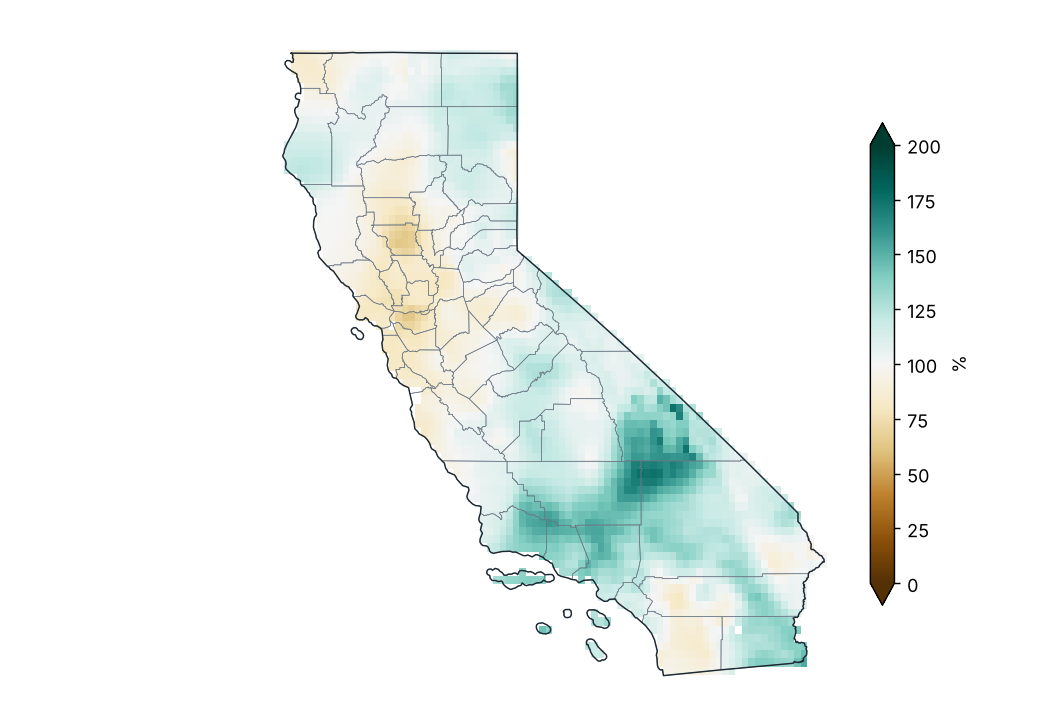
Percent of normal precipitation (1991–2020)
Source: NOAA NCEI
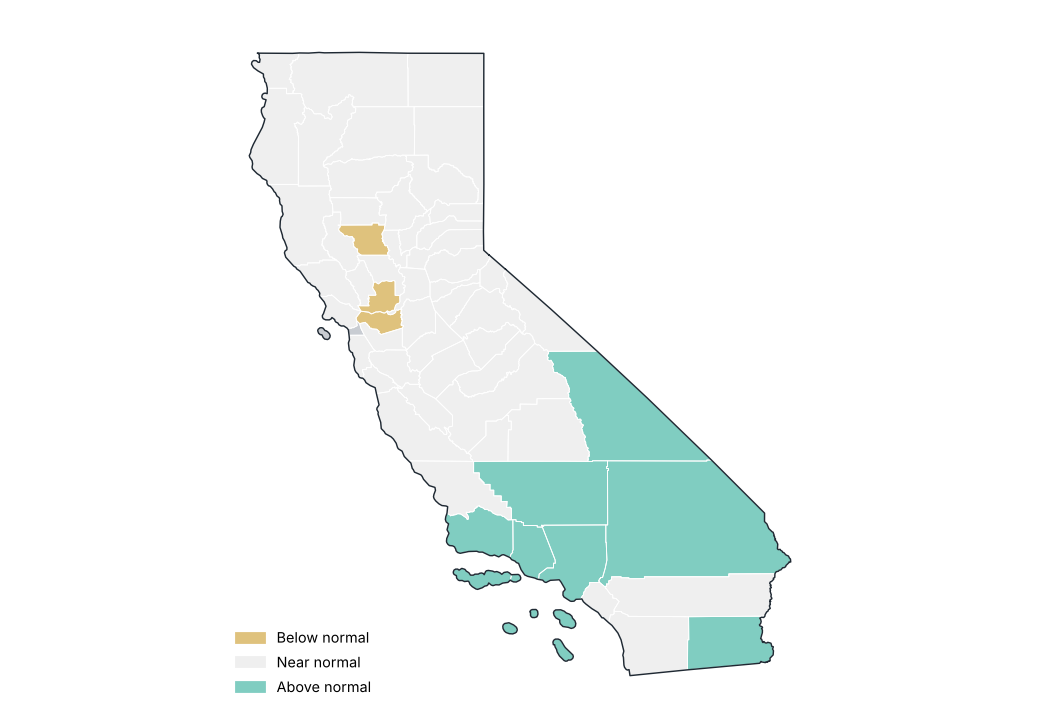
Percent of normal by county
Source: NOAA NCEI
Precipitation by region
| Region | Total (mm) | Normal (mm) | Difference (%) | Category |
|---|---|---|---|---|
| North Coast Drainage | 1261.6 | 1250.6 | 0.9 | Near normal |
| Sacramento Drainage | 889.7 | 889.8 | −0.0 | Near normal |
| Northeast Interior Basins | 558.7 | 494.6 | 13.0 | Near normal |
| Central Coast Drainage | 490.0 | 521.5 | −6.0 | Near normal |
| San Joaquin Drainage | 508.2 | 472.1 | 7.6 | Near normal |
| South Coast Drainage | 486.3 | 393.9 | 23.5 | Above normal |
| Southeast Desert Basin | 185.3 | 156.5 | 18.4 | Near normal |
Source: NOAA NCEI
Stations with the largest precipitation excess
| Region | County | Station | Altitude (m) | Anomaly (%) |
|---|---|---|---|---|
| Southeast Desert Basin | San Bernardino | Trona | 517.0 | 137.4 |
| South Coast Drainage | Los Angeles | Mt Wilson Cbs | 1740.0 | 87.5 |
| Southeast Desert Basin | Inyo | Death Valley Np | −59.0 | 80.2 |
| South Coast Drainage | Los Angeles | Sandberg | 1375.0 | 74.1 |
| South Coast Drainage | Los Angeles | Van Nuys AP | 239.0 | 71.8 |
| South Coast Drainage | Los Angeles | Burbank Glendale Pasadena AP | 223.0 | 66.7 |
| South Coast Drainage | Ventura | Oxnard Wfo | 16.0 | 66.1 |
| South Coast Drainage | Los Angeles | Fairmont | 933.0 | 62.9 |
| San Joaquin Drainage | Kern | Bakersfield 5 NW | 143.0 | 59.1 |
| Southeast Desert Basin | San Bernardino | Twentynine Palms | 602.0 | 58.6 |
Source: NOAA NCEI
Stations with the largest precipitation deficit
| Region | County | Station | Altitude (m) | Anomaly (%) |
|---|---|---|---|---|
| Central Coast Drainage | Contra Costa | Concord Buchanan Fld | 7.0 | −65.0 |
| North Coast Drainage | Humboldt | Orleans | 123.0 | −50.8 |
| Sacramento Drainage | Shasta | Coleman Fisheries Stn | 128.0 | −48.6 |
| Sacramento Drainage | Colusa | Colusa 2 SSW | 15.0 | −46.8 |
| Central Coast Drainage | Alameda | Fremont | 12.0 | −46.5 |
| North Coast Drainage | Napa | Calistoga | 107.0 | −42.1 |
| North Coast Drainage | Sonoma | Graton | 61.0 | −38.4 |
| Southeast Desert Basin | Riverside | Mecca Fire Stn | −56.0 | −36.2 |
| Southeast Desert Basin | Riverside | Hemet | 552.0 | −33.5 |
| Central Coast Drainage | Contra Costa | Mt Diablo Junction | 661.0 | −30.3 |
Source: NOAA NCEI
Largest 24-hour rainfall at stations
| Station | County | Max 24 h rainfall (mm) | Date |
|---|---|---|---|
| Bowman Dam | Nevada | 286.3 | 2025-12-22 |
| Gibraltar Dam #2 | Santa Barbara | 181.6 | 2025-12-24 |
| Strawberry Valley 2 | Butte | 177.8 | 2025-12-22 |
| Juncal Dam | Santa Barbara | 175.8 | 2025-12-26 |
| Loraine 5 NNE | Kern | 172.7 | 2025-03-07 |
| Blue Canyon Nyack AP | Placer | 170.9 | 2025-12-21 |
| Calaveras Big Trees | Calaveras | 170.2 | 2025-11-13 |
| De Sabla | Butte | 169.9 | 2025-02-04 |
| Mt Wilson Cbs | Los Angeles | 157.0 | 2025-12-25 |
| Placerville 3 ENE | El Dorado | 157.0 | 2025-11-17 |
Source: NOAA NCEI
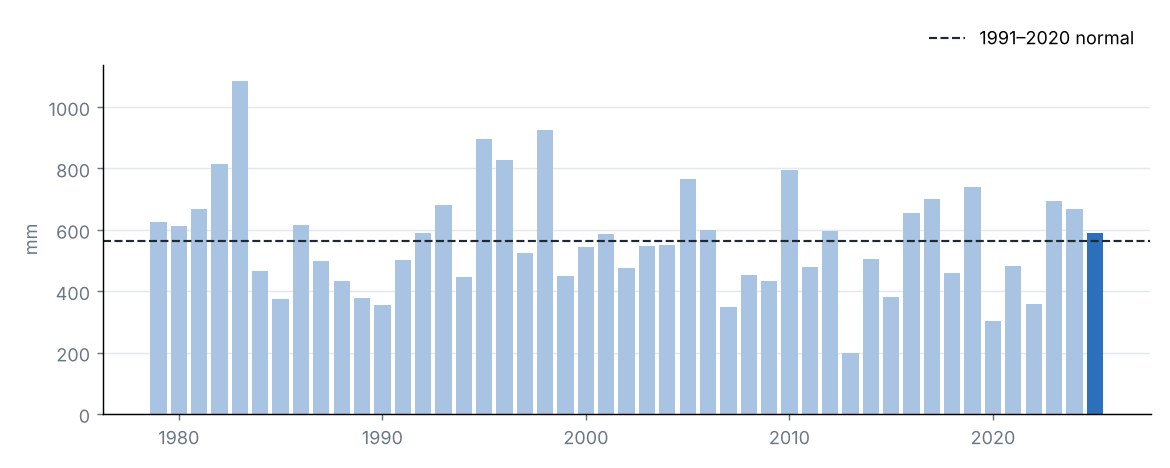
Statewide precipitation in each year
Source: NOAA NCEI
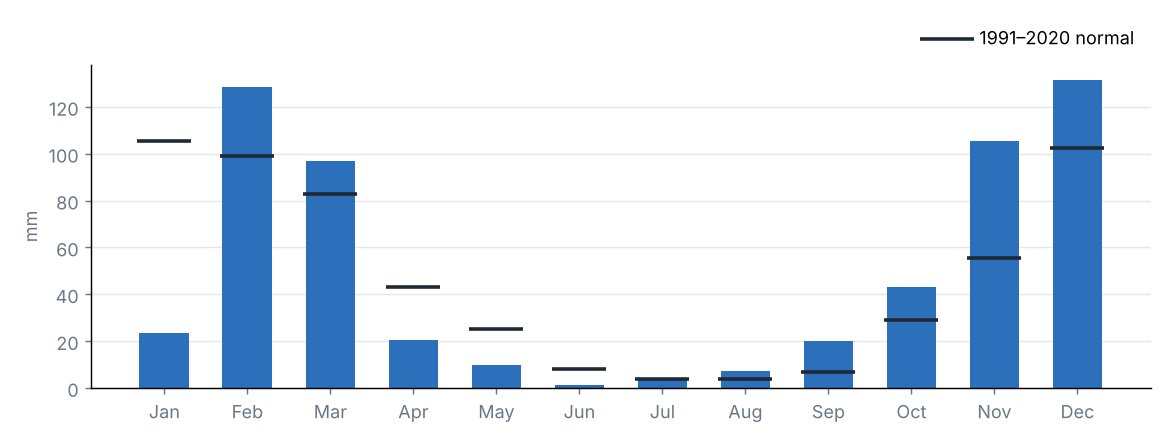
Monthly precipitation and 1991–2020 normal
Source: NOAA NCEI
Statewide accumulated precipitation was 591.3 mm, 105% of the 1991–2020 average (565.3 mm), category “Near normal”. It was the 20th wettest year in the 1979–2025 series.
The region with the highest percentage of normal was South Coast Drainage (123%) and the lowest was Central Coast Drainage (94%).
Source: NOAA NCEI
4 Temperature
Source: NOAA NCEI
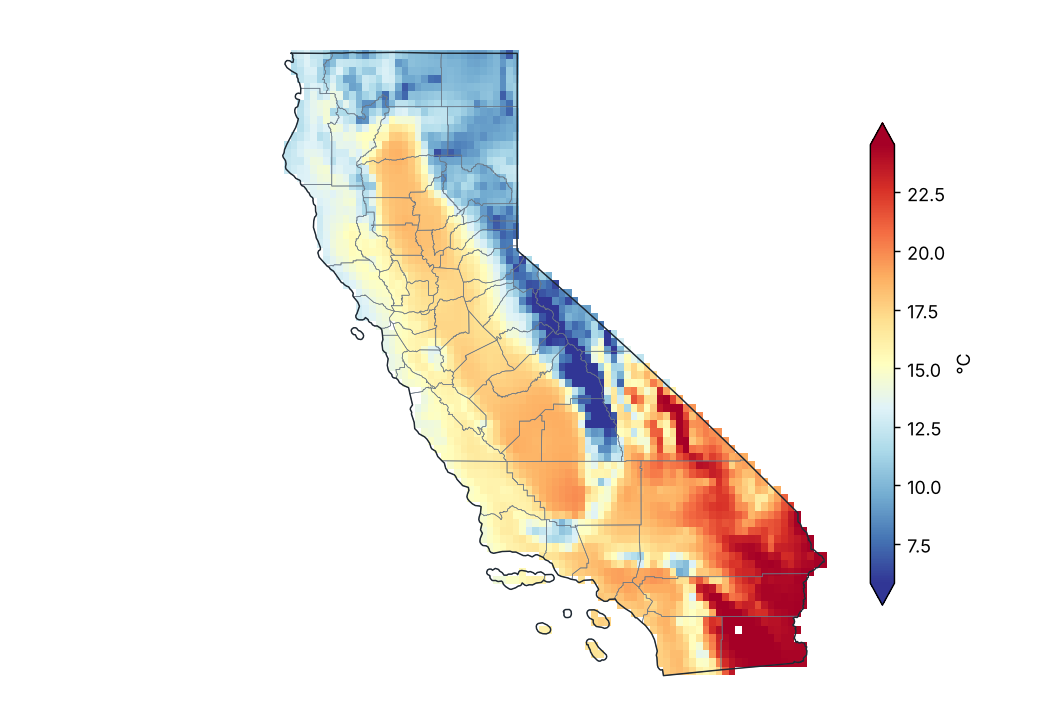
Mean temperature
Source: NOAA NCEI
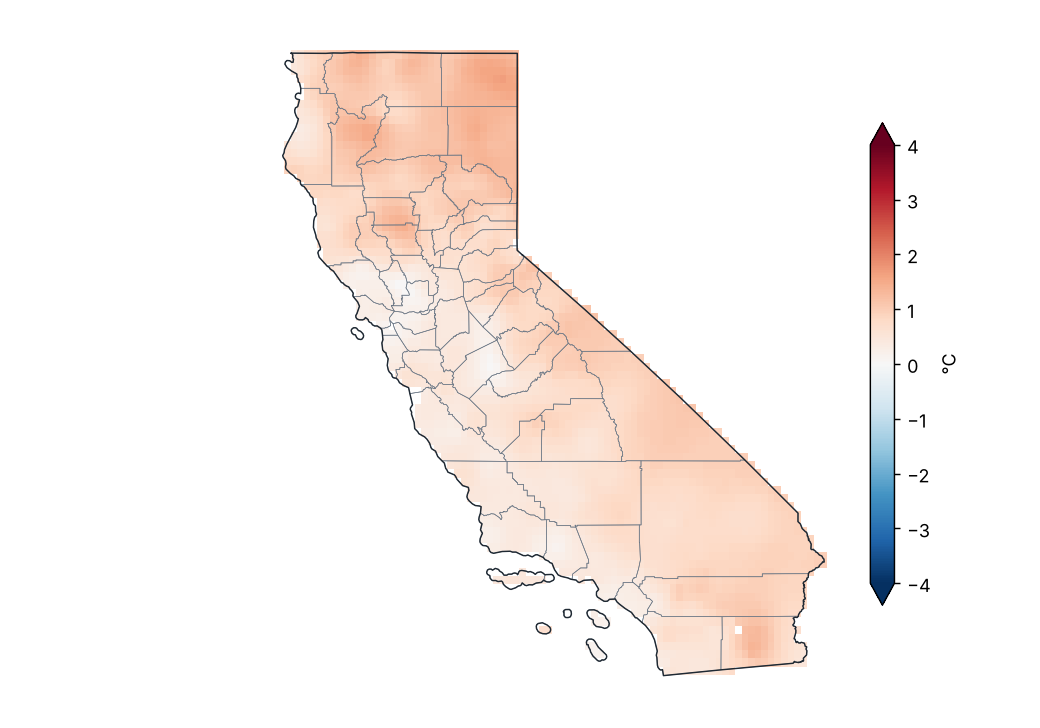
Mean temperature anomaly (1991–2020)
Source: NOAA NCEI
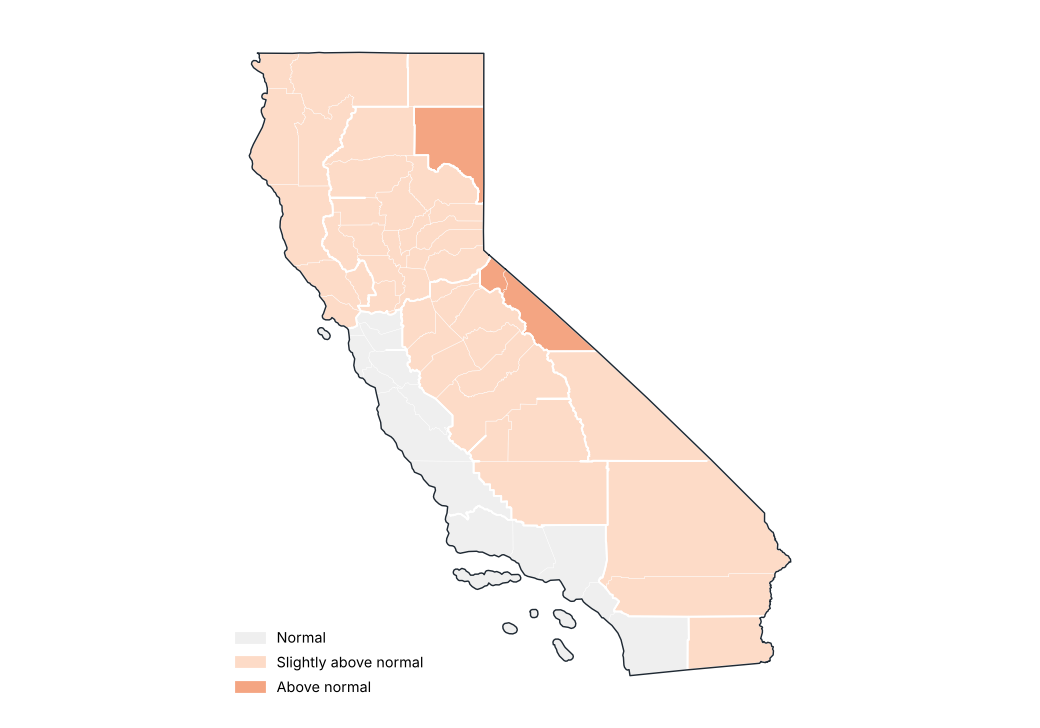
Mean temperature anomaly by region
Source: NOAA NCEI
Stations with the largest positive anomaly
| Region | County | Station | Altitude (m) | Anomaly (°C) |
|---|---|---|---|---|
| Southeast Desert Basin | Riverside | Desert Resorts Rgnl AP | −36.0 | 2.4 |
| Sacramento Drainage | Shasta | Whiskeytown Rsvr | 395.0 | 2.1 |
| Sacramento Drainage | Nevada | Boca | 1699.0 | 2.1 |
| North Coast Drainage | Trinity | Trinity Rvr Hatchery | 567.0 | 1.8 |
| Central Coast Drainage | San Mateo | Skyline Ridge Preserve | 692.0 | 1.8 |
| Southeast Desert Basin | San Bernardino | Parker Rsvr | 225.0 | 1.6 |
| Sacramento Drainage | Yolo | Davis 2 WSW Exp Farm | 18.0 | 1.6 |
| Southeast Desert Basin | Imperial | Imperial | −20.0 | 1.6 |
| Sacramento Drainage | Nevada | Nevada City | 848.0 | 1.6 |
| San Joaquin Drainage | Merced | Newman | 27.0 | 1.5 |
Source: NOAA NCEI
Stations with the largest negative anomaly
| Region | County | Station | Altitude (m) | Anomaly (°C) |
|---|---|---|---|---|
| North Coast Drainage | Napa | Markley Cove | 146.0 | −1.2 |
| Central Coast Drainage | Alameda | Fremont | 12.0 | −0.8 |
| South Coast Drainage | San Diego | N Is Nas | 4.0 | −0.8 |
| North Coast Drainage | Napa | Angwin Pacific Union College | 523.0 | −0.7 |
| Central Coast Drainage | San Francisco | San Francisco Oceanside | 2.0 | −0.6 |
| South Coast Drainage | Ventura | Ojai | 227.0 | −0.5 |
| South Coast Drainage | San Diego | San Diego Miramar Nas | 145.0 | −0.5 |
| South Coast Drainage | Los Angeles | Burbank Valley Pump Plt | 200.0 | −0.4 |
| South Coast Drainage | Los Angeles | Los Angeles Downtown/Usc | 55.0 | −0.4 |
| North Coast Drainage | Siskiyou | Yreka | 827.0 | −0.3 |
Source: NOAA NCEI
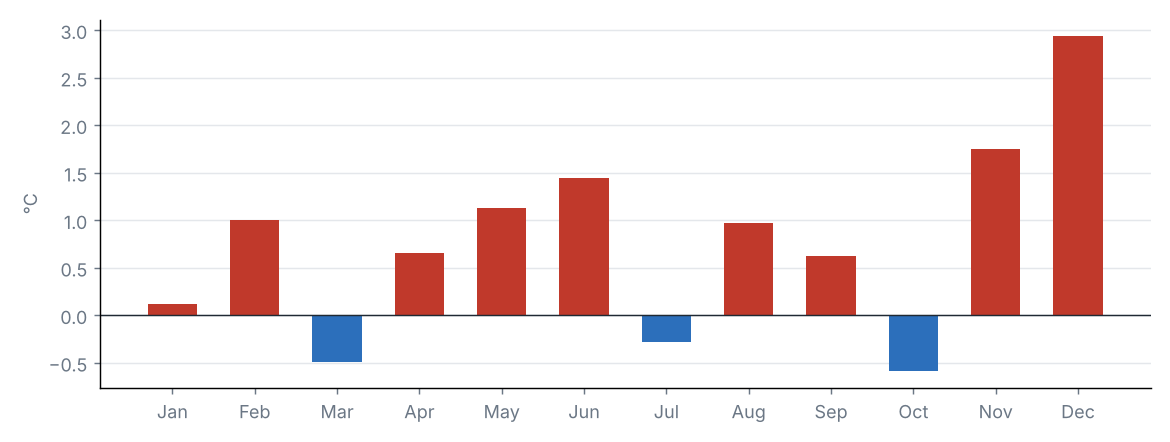
Monthly statewide mean temperature anomaly
Source: NOAA NCEI
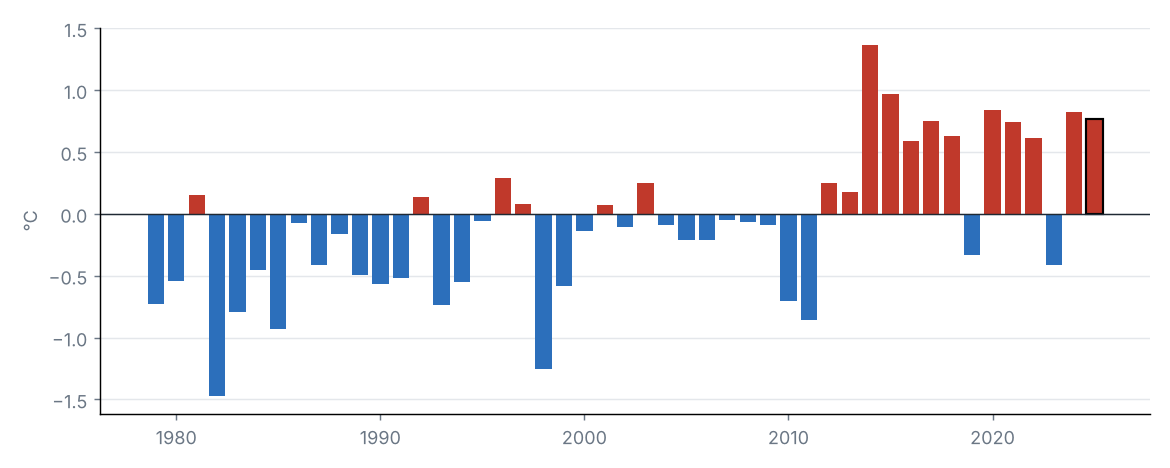
Statewide mean temperature anomaly in each year
Source: NOAA NCEI
The statewide mean temperature was 15.8 °C, 0.8 °C above the 1991–2020 average (15.0 °C), category “Slightly above normal”. It was the 5th warmest year in the 1979–2025 series (tied with 2017, 2021).
By region, the largest anomaly was in Northeast Interior Basins (+1.2 °C) and the smallest in Central Coast Drainage (+0.4 °C).
Source: NOAA NCEI
Source: NOAA NCEI
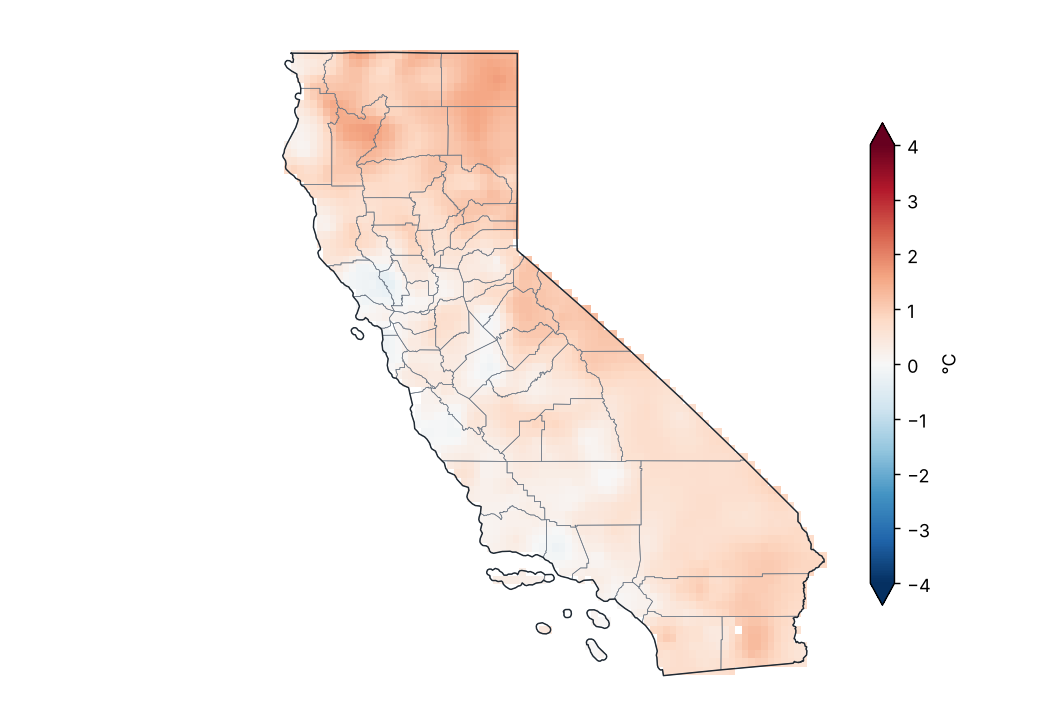
Maximum temperature anomaly (1991–2020)
Source: NOAA NCEI
Lowest and highest monthly mean maximum temperature by region
| Region | Lowest value (°C) | Station | Highest value (°C) | Station |
|---|---|---|---|---|
| North Coast Drainage | 15.0 | Crescent City Mcnamara AP | 24.9 | Potter Valley Powerhouse |
| Sacramento Drainage | 13.3 | Tahoma | 26.8 | Colusa 2 SSW |
| Central Coast Drainage | 14.9 | San Francisco Oceanside | 25.2 | Tracy Pumping Plt |
| San Joaquin Drainage | 13.4 | Tuolumne Meadows Rs | 28.1 | Newman |
| South Coast Drainage | 18.4 | Mt Laguna #3 | 32.9 | Ocotillo Wells 2W |
| Southeast Desert Basin | 12.9 | Aspendell | 34.2 | Desert Resorts Rgnl AP |
Station monthly means (GHCN-Daily, ≥ 80% of days with data).
Source: NOAA NCEI
The statewide maximum temperature was 22.6 °C, 0.6 °C above the 1991–2020 average (22.0 °C), category “Slightly above normal”. It was the 7th warmest year in the 1979–2025 series (tied with 2017, 2018).
By region, the largest anomaly was in Northeast Interior Basins (+1.2 °C) and the smallest in Central Coast Drainage (+0.2 °C).
Source: NOAA NCEI
Source: NOAA NCEI
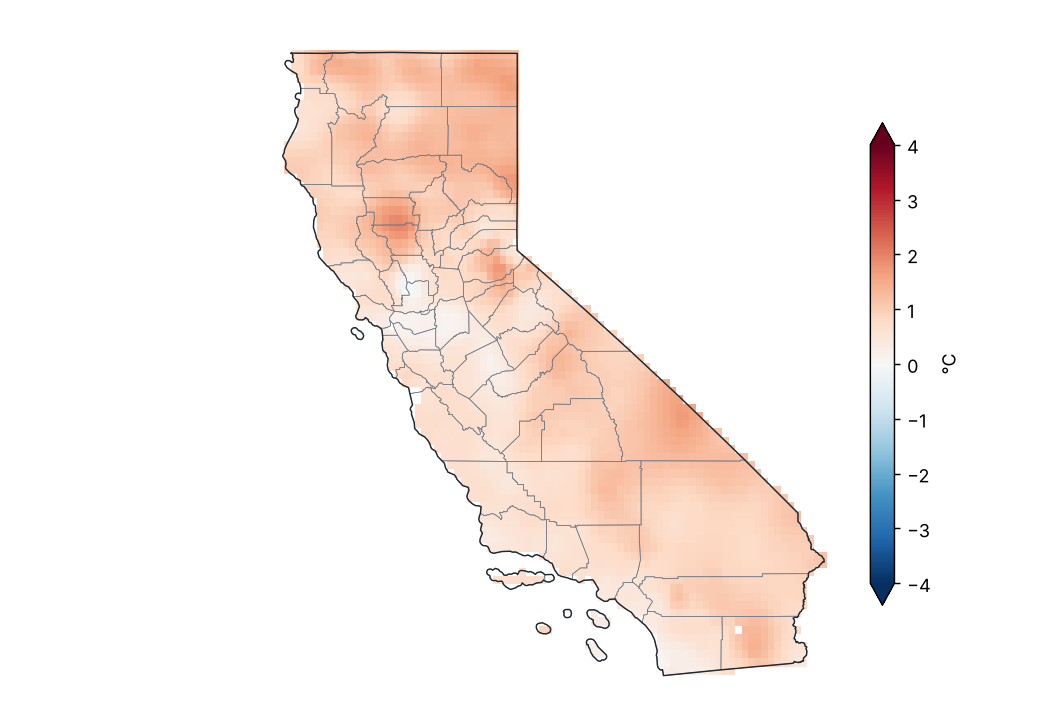
Minimum temperature anomaly (1991–2020)
Source: NOAA NCEI
Lowest and highest monthly mean minimum temperature by region
| Region | Lowest value (°C) | Station | Highest value (°C) | Station |
|---|---|---|---|---|
| North Coast Drainage | 0.7 | Tulelake | 9.7 | San Rafael-Civic Ctr |
| Sacramento Drainage | −3.0 | Truckee-Tahoe AP | 11.9 | Whiskeytown Rsvr |
| Central Coast Drainage | 5.9 | Pinnacles Np | 11.4 | Hearst Castle |
| San Joaquin Drainage | −3.1 | Tuolumne Meadows Rs | 13.0 | Bakersfield AP |
| South Coast Drainage | 5.1 | Campo | 18.4 | Ocotillo Wells 2W |
| Southeast Desert Basin | 2.2 | Aspendell | 20.0 | Death Valley Np |
Station monthly means (GHCN-Daily, ≥ 80% of days with data).
Source: NOAA NCEI
The statewide minimum temperature was 9.0 °C, 0.9 °C above the 1991–2020 average (8.1 °C), category “Slightly above normal”. It was the 2nd warmest year in the 1979–2025 series (tied with 2015, 2017, 2024).
By region, the largest anomaly was in Northeast Interior Basins (+1.2 °C) and the smallest in South Coast Drainage (+0.6 °C).
Source: NOAA NCEI
5 Climate extremes and records
Source: NOAA NCEI
Highest maximum temperature by county
| County | Station | Temperature (°C) | Date |
|---|---|---|---|
| Inyo | Death Valley Np | 51.1 | 2025-07-14 |
| San Diego | Ocotillo Wells 2W | 50.0 | 2025-08-07 |
| Riverside | Indio Fire Stn | 48.9 | 2025-07-09 |
| San Bernardino | Parker Rsvr | 48.3 | 2025-08-08 |
| Imperial | El Centro 2 SSW | 47.8 | 2025-08-08 |
| Kern | China Lake Naf | 45.0 | 2025-08-12 |
| Merced | Newman | 44.4 | 2025-07-03 |
| Trinity | Trinity Rvr Hatchery | 43.9 | 2025-08-12 |
| Fresno | Coalinga | 43.3 | 2025-09-02 |
| Humboldt | Orleans | 43.3 | 2025-08-10 |
| Los Angeles | Woodland Hills Pierce College | 43.3 | 2025-08-22 |
| Shasta | Whiskeytown Rsvr | 43.3 | 2025-07-14 |
| Yolo | Davis 2 WSW Exp Farm | 43.3 | 2025-09-02 |
| Siskiyou | Happy Camp Rs | 42.8 | 2025-08-12 |
| Kings | Lemoore Reeves Nas | 42.2 | 2025-07-12 |
| Napa | Markley Cove | 42.2 | 2025-06-01 |
| Santa Barbara | Gibraltar Dam #2 | 42.2 | 2025-08-23 |
| Tulare | Lemon Cove | 42.2 | 2025-08-11 |
| Butte | Chico Univ Farm | 41.7 | 2025-09-15 |
| Glenn | Stony Gorge Rsvr | 41.7 | 2025-08-24 |
The 20 most extreme of 56.
Source: NOAA NCEI
Lowest minimum temperature by county
| County | Station | Temperature (°C) | Date |
|---|---|---|---|
| Siskiyou | Tulelake | −29.4 | 2025-02-12 |
| Tuolumne | Tuolumne Meadows Rs | −25.0 | 2025-02-09 |
| Modoc | Alturas Muni AP | −22.1 | 2025-02-12 |
| Lassen | Susanville 2SW | −17.8 | 2025-12-17 |
| Mono | Bodie California St Historic P | −17.2 | 2025-03-09 |
| Nevada | Truckee-Tahoe AP | −17.2 | 2025-12-30 |
| Shasta | Hat Creek | −15.6 | 2025-02-12 |
| El Dorado | S Lake Tahoe AP | −13.9 | 2025-12-29 |
| Placer | Tahoe City | −13.3 | 2025-02-12 |
| Plumas | Portola | −13.3 | 2025-12-29 |
| Inyo | Aspendell | −12.8 | 2025-02-09 |
| Sierra | Verdi 2W | −12.8 | 2025-02-12 |
| Tehama | Mineral | −12.8 | 2025-02-12 |
| San Bernardino | Big Bear Lake | −9.4 | 2025-01-14 |
| Tulare | Grant Grove | −9.4 | 2025-03-07 |
| Los Angeles | Lancaster | −9.3 | 2025-01-13 |
| Kern | Edwards Afb N Aux Airfield | −9.2 | 2025-01-22 |
| Mariposa | Yosemite Village 12 W | −7.9 | 2025-03-14 |
| San Diego | Campo | −7.8 | 2025-01-17 |
| Riverside | Idyllwild Fire Dept | −6.7 | 2025-03-08 |
The 20 most extreme of 55.
Source: NOAA NCEI
Station records broken
| Station | County | Variable | New value | Date | Previous record | Previous date |
|---|---|---|---|---|---|---|
| Bowman Dam | Nevada | Highest 24 h rainfall | 286.3 | 2025-12-22 | 252.2 | 2022-12-31 |
| Fall Rvr Mills | Shasta | Highest 24 h rainfall | 87.9 | 2025-02-03 | 84.3 | 2019-01-17 |
| Redding AP | Shasta | Highest 24 h rainfall | 110.0 | 2025-02-02 | 100.6 | 1990-01-07 |
| Alturas Muni AP | Modoc | Highest 24 h rainfall | 54.1 | 2025-02-02 | 46.0 | 2023-06-25 |
Most extreme daily value of the period against the same period in all earlier years of record (at least 20 years; for weeks, the same calendar month).
Source: NOAA NCEI
Climate-extremes indices (statewide mean)
| Index | Description | Value | Normal | Difference | Unit |
|---|---|---|---|---|---|
| TX90p | Warm days (Tmax > 90th percentile) | 14.1 | 10.0 | 4.1 | % |
| TN90p | Warm nights (Tmin > 90th percentile) | 17.0 | 10.0 | 7.0 | % |
| TX10p | Cool days (Tmax < 10th percentile) | 9.1 | 10.0 | −0.9 | % |
| TN10p | Cold nights (Tmin < 10th percentile) | 4.9 | 10.0 | −5.1 | % |
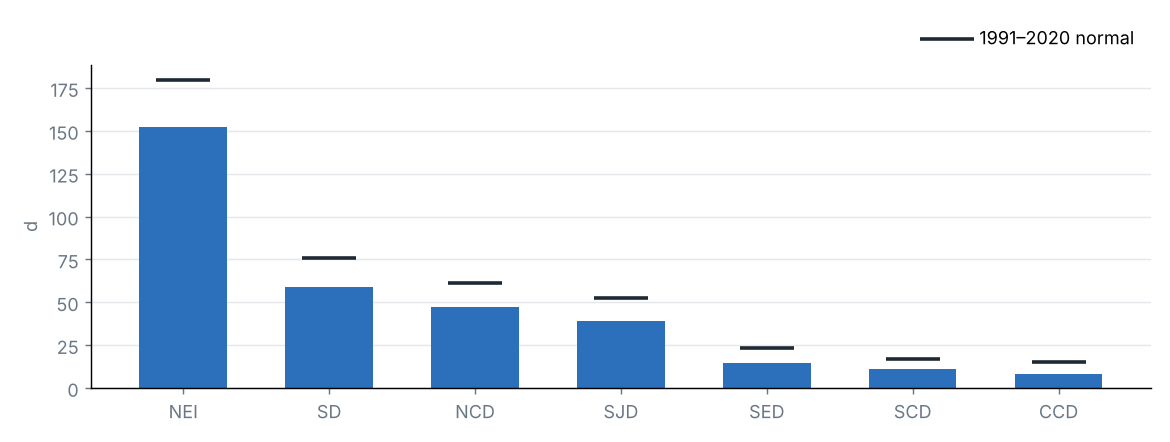
| FD | Frost days (Tmin < 0 °C) | 38.2 | 50.6 | −12.4 | d |
| SU | Summer days (Tmax > 25 °C) | 150.0 | 142.0 | 8.1 | d |
| TR | Tropical nights (Tmin > 20 °C) | 26.5 | 25.2 | 1.3 | d |
| WSDI | Warm spell days (≥ 6 days) | 11.5 | — | — | d |
| CSDI | Cold spell days (≥ 6 days) | 3.9 | — | — | d |
| Rx1day | Maximum 1-day precipitation | 47.3 | 45.9 | 1.4 | mm |
| Rx5day | Maximum 5-day precipitation | 113.5 | 95.9 | 17.5 | mm |
| CDD | Consecutive dry days (< 1 mm) | 99.4 | 115.5 | −16.1 | d |
| CWD | Consecutive wet days (≥ 1 mm) | 7.0 | 7.3 | −0.3 | d |
Percentile indices relative to calendar-day percentiles of 1991–2020 (5-day window); counts and maxima averaged over the state's grid cells.
Source: NOAA NCEI
Frost days by region
Source: NOAA NCEI
Heat and cold waves
| Dates | Type | Details |
|---|---|---|
| 2025-02-27 – 2025-03-01 | Heat wave | Up to 74% of the state above the 90th percentile of Tmax. Regions: North Coast Drainage, Sacramento Drainage, Northeast Interior Basins, Central Coast Drainage, San Joaquin Drainage, South Coast Drainage and Southeast Desert Basin. |
| 2025-03-25 – 2025-03-27 | Heat wave | Up to 99% of the state above the 90th percentile of Tmax. Regions: North Coast Drainage, Sacramento Drainage, Northeast Interior Basins, Central Coast Drainage, San Joaquin Drainage, South Coast Drainage and Southeast Desert Basin. |
| 2025-04-10 – 2025-04-12 | Heat wave | Up to 80% of the state above the 90th percentile of Tmax. Regions: Sacramento Drainage, Northeast Interior Basins, Central Coast Drainage, San Joaquin Drainage, South Coast Drainage and Southeast Desert Basin. |
| 2025-07-24 – 2025-07-28 | Cold wave | Up to 60% of the state below the 10th percentile of Tmin. Regions: San Joaquin Drainage, South Coast Drainage and Southeast Desert Basin. |
| 2025-08-22 – 2025-08-24 | Heat wave | Up to 98% of the state above the 90th percentile of Tmax. Regions: North Coast Drainage, Sacramento Drainage, Northeast Interior Basins, Central Coast Drainage, San Joaquin Drainage, South Coast Drainage and Southeast Desert Basin. |
| 2025-12-09 – 2025-12-19 | Heat wave | Up to 78% of the state above the 90th percentile of Tmax. Regions: North Coast Drainage, Sacramento Drainage, Northeast Interior Basins, Central Coast Drainage, San Joaquin Drainage, South Coast Drainage and Southeast Desert Basin. |
Wave: at least 3 consecutive days with at least half of the state above the 90th percentile of maximum temperature (heat) or below the 10th percentile of minimum temperature (cold). At most the 10 most intense are listed.
Source: NOAA NCEI
6 Drought
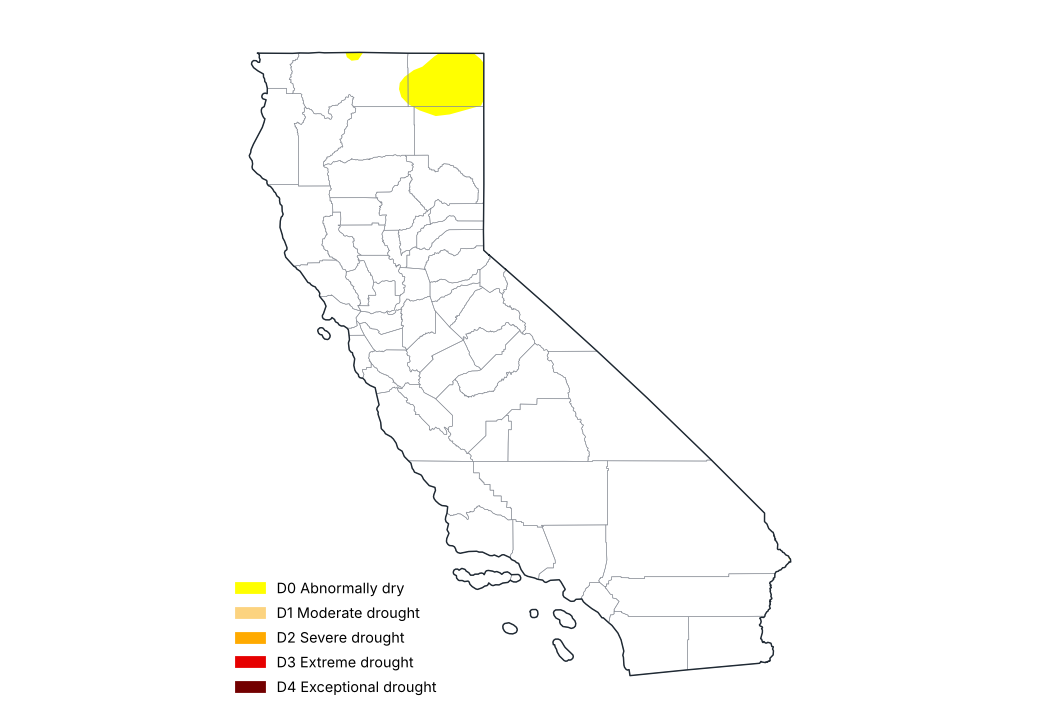
U.S. Drought Monitor, 30 December 2025
Source: National Drought Mitigation Center, USDA, NOAA
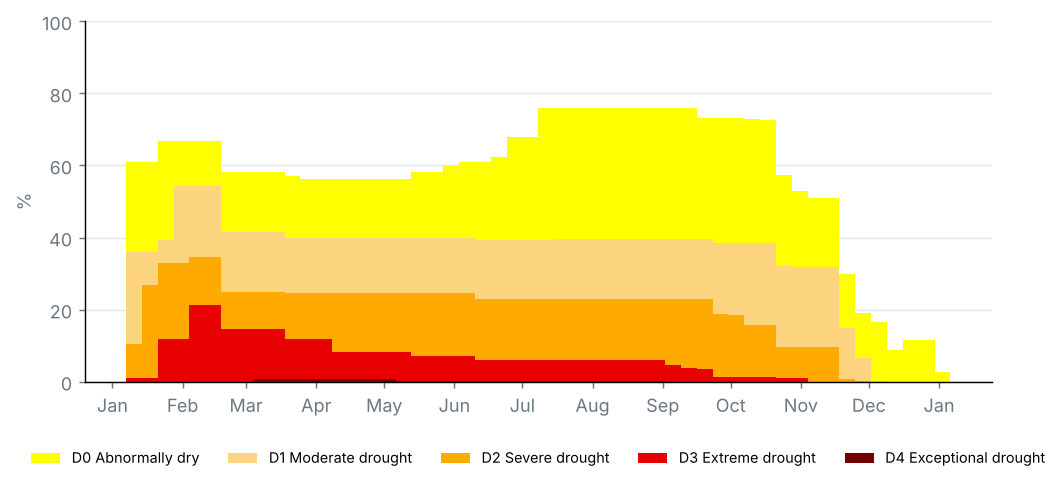
Share of the state by drought category, weekly U.S. Drought Monitor maps (%)
Source: National Drought Mitigation Center, USDA, NOAA
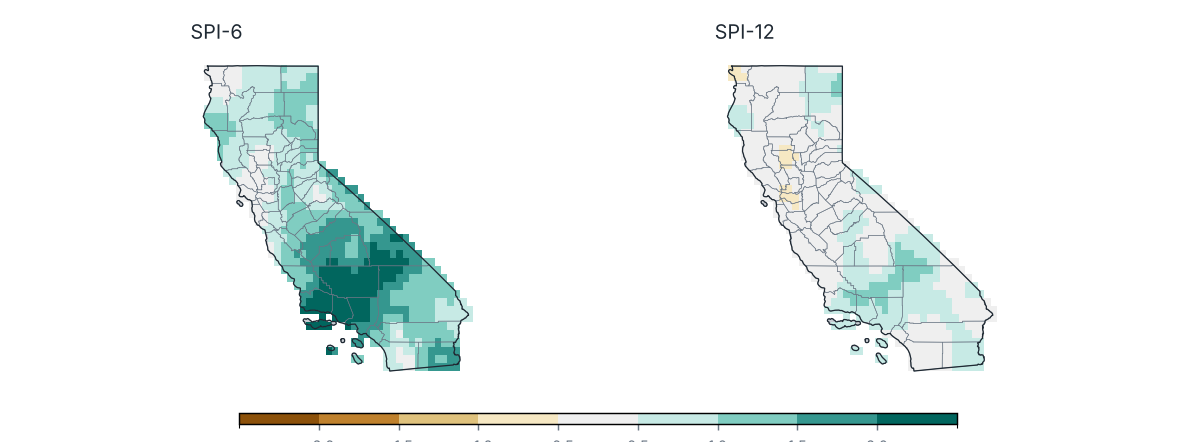
Standardized Precipitation Index (SPI) ending December 2025
Source: NOAA NCEI
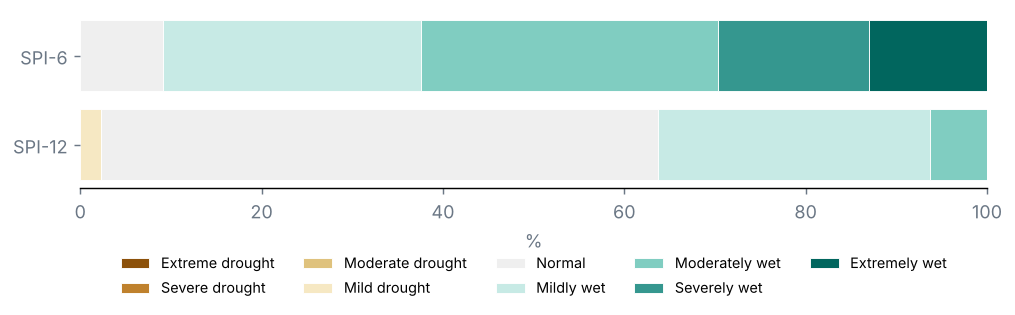
Share of the state by SPI category
Source: NOAA NCEI
Counties with the lowest SPI-12
| County | SPI-6 | SPI-12 | Category |
|---|---|---|---|
| Contra Costa | 0.3 | −0.7 | Mild drought |
| Colusa | 0.2 | −0.7 | Mild drought |
Source: NOAA NCEI
U.S. Drought Monitor, map of 30 December 2025: 0% of the state in drought (D1–D4), 0% in severe drought or worse (D2–D4) and 0% in extreme or exceptional drought (D3–D4); 3% was abnormally dry or in drought (D0–D4).
On the map of 31 December 2024, 32% of the state was in drought: a change of −32 points over the period.
No part of the state was in drought (D1–D4).
SPI-12 (Jan–Dec 2025): statewide mean +0.34; 0% of the state in drought (SPI ≤ −1.0) and 0% in severe or extreme drought.
No county averaged an SPI-12 below −1.0.
SPI-6 (Jul–Dec 2025): 0% of the state in drought.
7 Severe weather and notable events
Notable events
| Dates | Type | Area | Details |
|---|---|---|---|
| 2025-02-04 | Heavy rain | De Sabla | 169.9 mm in 24 hours. |
| 2025-03-07 | Heavy rain | Loraine 5 NNE | 172.7 mm in 24 hours. |
| 2025-11-13 | Heavy rain | Calaveras Big Trees | 170.2 mm in 24 hours. |
| 2025-11-17 | Heavy rain | Placerville 3 ENE | 157.0 mm in 24 hours. |
| 2025-12-21 | Heavy rain | Blue Canyon Nyack AP | 170.9 mm in 24 hours. |
| 2025-12-22 | Heavy rain | Bowman Dam | 286.3 mm in 24 hours. |
| 2025-12-22 | Heavy rain | Strawberry Valley 2 | 177.8 mm in 24 hours. |
| 2025-12-24 | Heavy rain | Gibraltar Dam #2 | 181.6 mm in 24 hours. |
| 2025-12-25 | Heavy rain | Mt Wilson Cbs | 157.0 mm in 24 hours. |
| 2025-12-26 | Heavy rain | Juncal Dam | 175.8 mm in 24 hours. |
GDACS alerts and station rainfall of 150 mm or more in 24 hours (after quality control).
Source: GDACS, NOAA NCEI
No tropical cyclone came within 300 km of the state.
9 Outlook
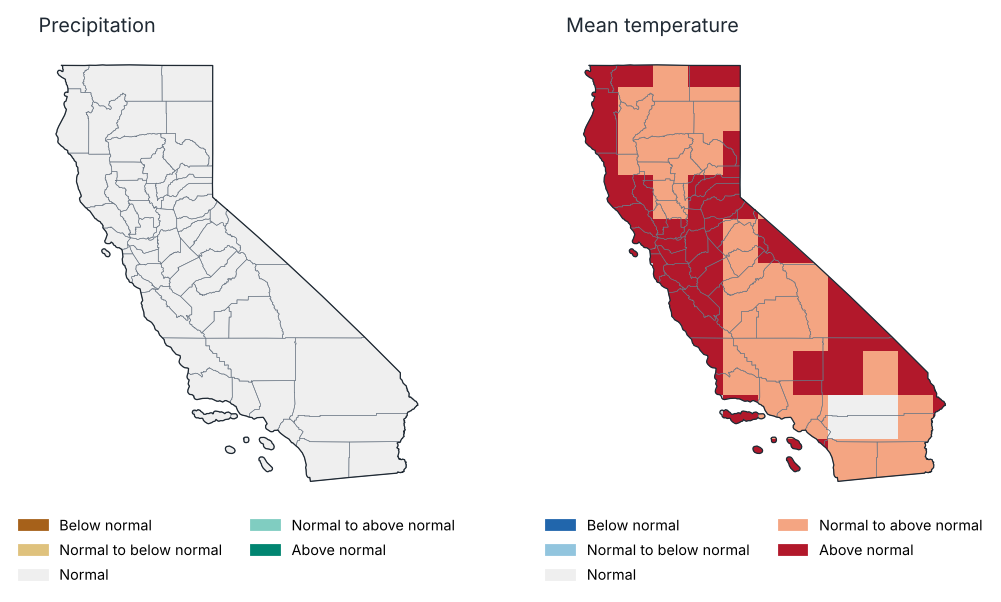
Outlook for Jan–Mar 2026: most likely tercile
Source: NOAA CPC
Probability of each tercile by region, Jan–Mar 2026 (%)
| Region | Precipitation: below | Precipitation: normal | Precipitation: above | Temp.: below | Temp.: normal | Temp.: above |
|---|---|---|---|---|---|---|
| North Coast Drainage | 34.0 | 35.0 | 31.0 | 17.0 | 30.0 | 52.0 |
| Sacramento Drainage | 33.0 | 35.0 | 33.0 | 19.0 | 32.0 | 49.0 |
| Northeast Interior Basins | 33.0 | 34.0 | 33.0 | 20.0 | 31.0 | 49.0 |
| Central Coast Drainage | 34.0 | 32.0 | 34.0 | 16.0 | 30.0 | 54.0 |
| San Joaquin Drainage | 33.0 | 33.0 | 35.0 | 22.0 | 30.0 | 47.0 |
| South Coast Drainage | 31.0 | 35.0 | 34.0 | 22.0 | 30.0 | 48.0 |
| Southeast Desert Basin | 27.0 | 38.0 | 35.0 | 22.0 | 31.0 | 46.0 |
Source: NOAA CPC
Probabilistic outlook from the North American Multi-Model Ensemble (NMME), initialised in January 2026, relative to 1991–2020 terciles. It is not an official forecast: consult the National Weather Service and NOAA's Climate Prediction Center.
Precipitation, Jan–Mar 2026: above normal is favoured over 0% of the state and below normal over 0%.
Mean temperature, Jan–Mar 2026: above normal is favoured over 95% of the state and below normal over 0%.
10 Annexes
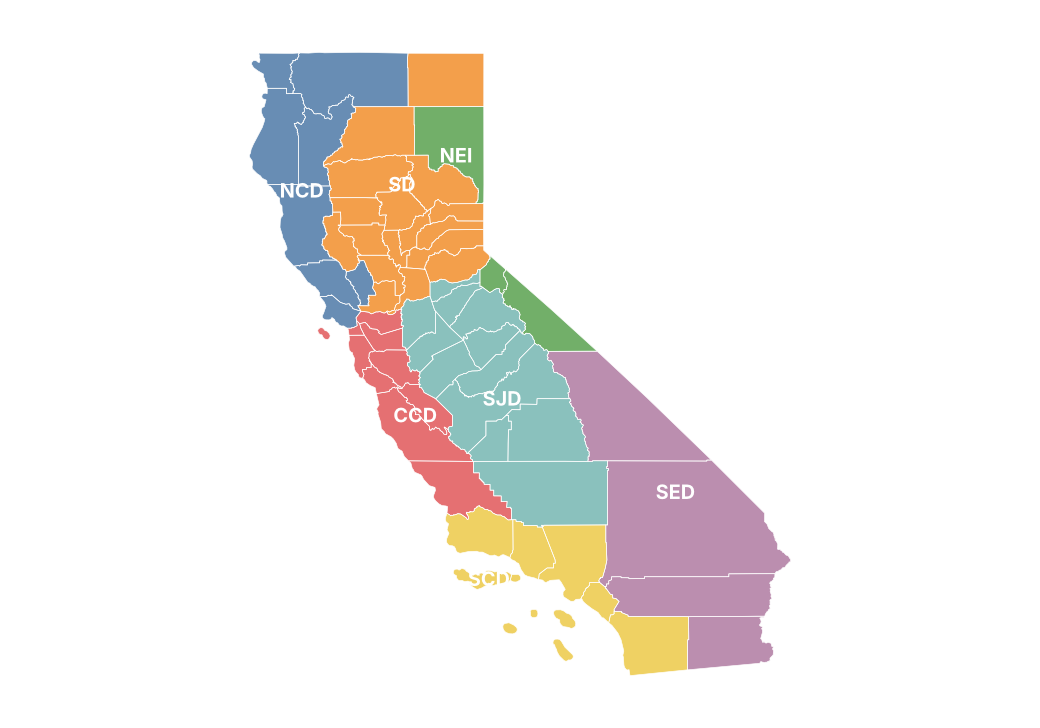
Report climate regions
Monthly precipitation by county (mm)
| County | Jan | Feb | Mar | Apr | May | Jun | Jul | Aug | Sep | Oct | Nov | Dec |
|---|---|---|---|---|---|---|---|---|---|---|---|---|
| Alameda | 6.5 | 113.7 | 59.0 | 9.7 | 4.3 | 0.0 | 0.0 | 0.0 | 3.4 | 53.6 | 74.4 | 76.6 |
| Alpine | 39.4 | 197.4 | 150.1 | 34.9 | 17.4 | 8.9 | 24.0 | 38.0 | 28.6 | 84.8 | 109.0 | 195.9 |
| Amador | 35.8 | 214.6 | 173.2 | 43.9 | 8.3 | 2.5 | 2.1 | 3.4 | 8.1 | 60.6 | 196.2 | 159.3 |
| Butte | 39.1 | 323.7 | 167.8 | 42.8 | 30.5 | 0.9 | 0.1 | 3.6 | 8.3 | 64.2 | 142.1 | 292.9 |
| Calaveras | 26.6 | 179.5 | 166.5 | 43.7 | 5.2 | 1.8 | 1.0 | 1.7 | 8.1 | 55.4 | 186.7 | 136.3 |
| Colusa | 16.2 | 141.4 | 51.1 | 17.2 | 5.1 | 0.0 | 0.2 | 0.1 | 3.1 | 32.7 | 65.3 | 127.4 |
| Contra Costa | 6.4 | 127.1 | 42.4 | 6.6 | 3.3 | 0.0 | 0.0 | 0.0 | 2.0 | 39.8 | 65.8 | 67.8 |
| Del Norte | 155.0 | 284.7 | 435.1 | 62.4 | 35.8 | 1.6 | 0.0 | 3.9 | 59.4 | 82.3 | 194.5 | 337.0 |
| El Dorado | 50.2 | 284.6 | 214.8 | 58.1 | 14.9 | 3.3 | 3.9 | 7.8 | 12.9 | 85.2 | 185.2 | 253.7 |
| Fresno | 9.0 | 80.7 | 111.0 | 23.9 | 3.0 | 0.2 | 1.3 | 8.6 | 22.7 | 56.2 | 135.3 | 92.4 |
| Glenn | 11.1 | 163.0 | 68.2 | 16.3 | 7.3 | 0.0 | 0.1 | 0.9 | 5.9 | 55.6 | 102.7 | 140.3 |
| Humboldt | 130.1 | 336.0 | 361.7 | 62.1 | 26.1 | 0.6 | 0.6 | 2.4 | 73.8 | 98.6 | 235.0 | 398.8 |
| Imperial | 0.4 | 0.9 | 9.5 | 0.1 | 1.3 | 0.5 | 0.0 | 19.0 | 21.9 | 4.3 | 24.3 | 13.4 |
| Inyo | 3.9 | 21.7 | 20.7 | 2.5 | 7.1 | 0.8 | 3.1 | 5.6 | 18.8 | 11.2 | 61.5 | 35.5 |
| Kern | 10.7 | 21.0 | 51.9 | 6.9 | 3.3 | 0.1 | 0.1 | 1.1 | 9.3 | 33.2 | 92.8 | 68.9 |
| Kings | 5.9 | 17.3 | 40.0 | 6.9 | 0.0 | 0.0 | 0.0 | 0.0 | 16.9 | 30.3 | 54.1 | 57.1 |
| Lake | 30.5 | 299.5 | 143.4 | 36.1 | 8.3 | 0.0 | 0.3 | 0.1 | 22.9 | 58.5 | 160.8 | 282.3 |
| Lassen | 25.3 | 168.9 | 65.4 | 25.5 | 23.0 | 3.5 | 14.0 | 13.9 | 10.0 | 53.5 | 51.7 | 128.2 |
| Los Angeles | 25.1 | 83.5 | 57.4 | 9.2 | 6.6 | 1.0 | 0.0 | 0.3 | 3.3 | 40.0 | 141.2 | 138.3 |
| Madera | 15.5 | 127.7 | 164.1 | 37.4 | 7.5 | 0.2 | 0.1 | 9.3 | 19.4 | 59.8 | 120.9 | 93.7 |
| Marin | 26.7 | 256.3 | 92.4 | 13.9 | 3.2 | 0.0 | 0.1 | 0.2 | 4.7 | 44.1 | 124.7 | 166.8 |
| Mariposa | 24.1 | 195.9 | 214.6 | 52.6 | 8.8 | 0.6 | 0.2 | 7.0 | 14.0 | 68.7 | 148.4 | 132.9 |
| Mendocino | 58.0 | 296.4 | 190.0 | 47.1 | 11.1 | 0.0 | 0.2 | 1.2 | 48.6 | 68.1 | 212.9 | 370.1 |
| Merced | 9.2 | 46.1 | 66.8 | 10.0 | 0.1 | 0.0 | 0.0 | 0.1 | 2.9 | 37.1 | 77.1 | 38.4 |
| Modoc | 33.9 | 158.7 | 48.9 | 32.8 | 22.7 | 3.4 | 21.1 | 17.3 | 13.9 | 46.6 | 35.2 | 92.9 |
| Mono | 13.6 | 87.0 | 58.6 | 21.3 | 8.8 | 3.3 | 7.4 | 34.2 | 23.9 | 35.3 | 69.8 | 68.2 |
| Monterey | 7.6 | 126.1 | 91.9 | 17.0 | 1.1 | 0.1 | 0.5 | 0.0 | 8.9 | 43.9 | 124.7 | 95.2 |
| Napa | 17.1 | 222.7 | 78.4 | 13.5 | 4.3 | 0.0 | 0.2 | 0.0 | 6.9 | 46.3 | 103.8 | 156.9 |
| Nevada | 46.6 | 366.5 | 222.6 | 63.5 | 18.5 | 1.8 | 2.9 | 8.3 | 12.6 | 99.9 | 169.1 | 367.4 |
| Orange | 17.2 | 66.0 | 57.0 | 6.6 | 2.4 | 1.8 | 0.6 | 0.0 | 2.7 | 19.5 | 125.2 | 67.9 |
| Placer | 45.9 | 319.8 | 209.2 | 56.1 | 16.1 | 3.3 | 2.3 | 8.8 | 12.4 | 92.9 | 164.9 | 309.3 |
| Plumas | 35.3 | 301.3 | 181.1 | 47.4 | 25.0 | 2.5 | 2.7 | 12.4 | 15.1 | 69.8 | 125.5 | 336.0 |
| Riverside | 6.0 | 24.4 | 37.0 | 1.9 | 8.3 | 1.8 | 0.3 | 8.9 | 26.3 | 9.8 | 54.0 | 24.1 |
| Sacramento | 13.5 | 122.0 | 52.6 | 8.7 | 1.2 | 0.0 | 0.0 | 0.0 | 1.3 | 49.2 | 103.1 | 74.1 |
| San Benito | 8.4 | 78.5 | 75.9 | 16.1 | 0.9 | 0.0 | 0.5 | 0.0 | 7.2 | 45.2 | 106.3 | 85.8 |
| San Bernardino | 6.8 | 20.0 | 21.7 | 1.2 | 12.6 | 1.5 | 4.7 | 9.1 | 26.2 | 9.1 | 55.5 | 27.0 |
| San Diego | 15.2 | 49.8 | 84.3 | 9.0 | 9.2 | 1.3 | 0.1 | 8.1 | 17.1 | 12.2 | 59.3 | 34.9 |
| San Francisco | — | — | — | — | — | — | — | — | — | — | — | — |
| San Joaquin | 7.2 | 84.9 | 46.6 | 11.7 | 0.5 | 0.0 | 0.0 | 0.0 | 2.3 | 49.5 | 86.6 | 47.9 |
| San Luis Obispo | 7.8 | 107.5 | 73.7 | 9.4 | 0.2 | 0.2 | 0.3 | 0.0 | 11.3 | 40.2 | 113.1 | 111.4 |
| San Mateo | 11.4 | 181.5 | 76.7 | 16.0 | 6.2 | 0.1 | 0.9 | 0.1 | 5.7 | 43.0 | 107.7 | 114.9 |
| Santa Barbara | 9.2 | 93.8 | 76.4 | 11.4 | 0.4 | 0.0 | 0.1 | 0.1 | 13.1 | 39.2 | 182.0 | 195.0 |
| Santa Clara | 5.5 | 148.2 | 101.7 | 18.7 | 5.8 | 0.0 | 0.3 | 0.0 | 7.3 | 57.9 | 106.9 | 80.1 |
| Santa Cruz | 10.4 | 221.5 | 109.1 | 22.5 | 4.7 | 0.1 | 0.9 | 0.0 | 8.1 | 59.1 | 170.6 | 97.6 |
| Shasta | 47.6 | 292.3 | 174.6 | 33.1 | 20.3 | 0.5 | 7.5 | 11.3 | 34.2 | 67.4 | 152.1 | 277.6 |
| Sierra | 42.2 | 298.1 | 183.5 | 44.4 | 23.8 | 2.0 | 4.3 | 17.7 | 11.8 | 92.2 | 139.8 | 352.9 |
| Siskiyou | 58.5 | 221.8 | 169.0 | 46.7 | 15.7 | 1.7 | 16.2 | 16.1 | 38.6 | 68.7 | 87.2 | 223.9 |
| Solano | 9.4 | 151.4 | 39.4 | 5.0 | 3.5 | 0.0 | 0.0 | 0.0 | 2.6 | 39.8 | 75.8 | 91.0 |
| Sonoma | 38.0 | 289.5 | 126.0 | 26.7 | 3.8 | 0.0 | 0.1 | 0.0 | 20.9 | 54.2 | 158.0 | 225.3 |
| Stanislaus | 7.9 | 73.7 | 67.4 | 13.3 | 0.7 | 0.0 | 0.0 | 0.0 | 3.8 | 38.4 | 82.5 | 49.6 |
| Sutter | 21.9 | 126.9 | 47.2 | 11.6 | 3.9 | 0.0 | 0.0 | 0.1 | 0.5 | 31.9 | 65.9 | 108.4 |
| Tehama | 31.6 | 248.5 | 116.4 | 25.4 | 13.5 | 1.0 | 0.9 | 5.2 | 20.3 | 68.2 | 139.3 | 243.4 |
| Trinity | 84.4 | 393.7 | 236.4 | 46.6 | 15.7 | 0.1 | 12.0 | 8.3 | 46.2 | 95.4 | 209.1 | 386.2 |
| Tulare | 7.9 | 72.2 | 136.0 | 16.6 | 2.2 | 0.0 | 0.2 | 6.4 | 19.1 | 61.3 | 134.0 | 113.8 |
| Tuolumne | 31.6 | 244.1 | 195.3 | 64.5 | 12.8 | 4.1 | 4.4 | 17.6 | 20.1 | 70.2 | 160.5 | 173.9 |
| Ventura | 21.4 | 104.7 | 71.5 | 8.9 | 1.9 | 0.2 | 0.1 | 0.6 | 10.1 | 45.6 | 195.9 | 225.1 |
| Yolo | 11.3 | 154.2 | 46.6 | 6.6 | 3.0 | 0.0 | 0.1 | 0.0 | 1.7 | 43.5 | 83.1 | 100.4 |
| Yuba | 38.2 | 266.1 | 133.3 | 42.7 | 16.4 | 0.2 | 0.0 | 2.0 | 3.6 | 63.0 | 120.6 | 236.7 |
Source: NOAA NCEI
Monthly maximum temperature by region (°C)
| Region | Jan | Feb | Mar | Apr | May | Jun | Jul | Aug | Sep | Oct | Nov | Dec |
|---|---|---|---|---|---|---|---|---|---|---|---|---|
| North Coast Drainage | 11.7 | 10.0 | 12.3 | 17.6 | 21.6 | 26.0 | 28.3 | 29.3 | 25.5 | 17.4 | 14.2 | 11.4 |
| Sacramento Drainage | 12.3 | 11.4 | 13.2 | 19.1 | 24.6 | 29.5 | 31.2 | 32.4 | 27.9 | 19.5 | 15.5 | 12.2 |
| Northeast Interior Basins | 6.9 | 7.4 | 8.9 | 14.1 | 19.5 | 25.4 | 28.1 | 28.1 | 23.2 | 15.3 | 12.1 | 9.5 |
| Central Coast Drainage | 16.5 | 17.0 | 16.8 | 19.9 | 24.6 | 27.2 | 27.7 | 30.7 | 27.8 | 22.9 | 19.2 | 16.8 |
| San Joaquin Drainage | 13.5 | 15.3 | 15.6 | 20.2 | 25.8 | 31.0 | 31.9 | 33.2 | 28.8 | 21.7 | 17.0 | 12.8 |
| South Coast Drainage | 17.2 | 19.3 | 17.4 | 20.0 | 24.0 | 27.6 | 28.8 | 30.9 | 28.2 | 24.6 | 20.8 | 20.0 |
| Southeast Desert Basin | 15.5 | 20.5 | 20.6 | 25.3 | 30.4 | 36.3 | 37.5 | 38.3 | 32.7 | 27.3 | 21.6 | 19.1 |
Source: NOAA NCEI
Monthly mean temperature by region (°C)
| Region | Jan | Feb | Mar | Apr | May | Jun | Jul | Aug | Sep | Oct | Nov | Dec |
|---|---|---|---|---|---|---|---|---|---|---|---|---|
| North Coast Drainage | 6.2 | 5.4 | 7.3 | 10.9 | 14.0 | 18.0 | 20.5 | 21.1 | 18.7 | 12.1 | 9.9 | 7.5 |
| Sacramento Drainage | 6.1 | 6.0 | 7.5 | 11.9 | 16.5 | 20.9 | 22.5 | 23.4 | 20.2 | 13.1 | 10.2 | 7.6 |
| Northeast Interior Basins | 0.1 | 1.2 | 2.7 | 6.5 | 11.3 | 16.3 | 18.9 | 18.9 | 15.2 | 8.2 | 5.9 | 3.6 |
| Central Coast Drainage | 9.5 | 11.0 | 10.9 | 13.4 | 16.9 | 19.2 | 20.2 | 22.4 | 21.0 | 16.2 | 13.6 | 11.4 |
| San Joaquin Drainage | 6.8 | 9.2 | 9.4 | 13.2 | 17.9 | 22.5 | 23.4 | 24.9 | 21.6 | 15.0 | 11.7 | 8.5 |
| South Coast Drainage | 10.5 | 12.9 | 11.7 | 13.9 | 17.5 | 20.6 | 21.8 | 23.7 | 21.9 | 17.9 | 15.0 | 14.1 |
| Southeast Desert Basin | 9.0 | 13.8 | 13.9 | 17.9 | 23.0 | 28.4 | 29.8 | 30.6 | 26.1 | 20.2 | 15.6 | 13.1 |
Source: NOAA NCEI
Monthly minimum temperature by region (°C)
| Region | Jan | Feb | Mar | Apr | May | Jun | Jul | Aug | Sep | Oct | Nov | Dec |
|---|---|---|---|---|---|---|---|---|---|---|---|---|
| North Coast Drainage | 0.8 | 0.8 | 2.4 | 4.2 | 6.5 | 9.9 | 12.7 | 13.0 | 12.0 | 6.8 | 5.6 | 3.6 |
| Sacramento Drainage | −0.1 | 0.6 | 1.9 | 4.7 | 8.4 | 12.2 | 13.8 | 14.4 | 12.6 | 6.6 | 5.0 | 3.1 |
| Northeast Interior Basins | −6.8 | −5.1 | −3.6 | −1.2 | 3.0 | 7.2 | 9.8 | 9.7 | 7.1 | 1.1 | −0.4 | −2.3 |
| Central Coast Drainage | 2.5 | 4.9 | 5.0 | 6.9 | 9.1 | 11.3 | 12.7 | 14.1 | 14.2 | 9.6 | 8.0 | 6.0 |
| San Joaquin Drainage | 0.0 | 3.1 | 3.1 | 6.2 | 9.9 | 14.0 | 15.0 | 16.5 | 14.3 | 8.3 | 6.5 | 4.3 |
| South Coast Drainage | 3.8 | 6.6 | 6.1 | 7.8 | 11.0 | 13.7 | 14.7 | 16.5 | 15.6 | 11.2 | 9.2 | 8.2 |
| Southeast Desert Basin | 2.5 | 7.1 | 7.2 | 10.5 | 15.5 | 20.5 | 22.0 | 23.0 | 19.6 | 13.1 | 9.7 | 7.1 |
Source: NOAA NCEI
Stations used
| Id | Name | County | Latitude | Longitude | Altitude (m) | Days with data (Tmax) (%) |
|---|---|---|---|---|---|---|
| USC00040010 | Acampo 5NE | San Joaquin | 38.2 | −121.2 | 26.5 | 0.0 |
| USC00040029 | Adin Rs | Modoc | 41.2 | −120.9 | 1280.8 | 0.0 |
| USC00040136 | Alpine | San Diego | 32.8 | −116.8 | 516.6 | 100.0 |
| USC00040144 | Altadena | Los Angeles | 34.2 | −118.1 | 343.5 | 0.0 |
| USC00040162 | Alturas 9 ENE | Modoc | 41.5 | −120.4 | 1617.6 | 0.0 |
| USC00040176 | Amboy | San Bernardino | 34.6 | −115.7 | 200.6 | 0.0 |
| USC00040192 | Anaheim | Orange | 33.9 | −117.8 | 70.7 | 100.0 |
| USC00040212 | Angwin Pacific Union College | Napa | 38.6 | −122.4 | 522.7 | 100.0 |
| USC00040332 | Arvin | Kern | 35.2 | −118.8 | 137.2 | 68.0 |
| USC00040383 | Auburn | Placer | 38.9 | −121.1 | 393.8 | 0.0 |
| USC00040444 | Bakersfield 5 NW | Kern | 35.4 | −119.1 | 143.3 | 99.0 |
| USC00040521 | Barstow | San Bernardino | 34.9 | −117.0 | 676.7 | 100.0 |
| USC00040673 | Ben Lomond #4 | Santa Cruz | 37.1 | −122.1 | 132.6 | 90.0 |
| USC00040693 | Berkeley | Alameda | 37.9 | −122.3 | 94.5 | 17.0 |
| USC00040741 | Big Bear Lake | San Bernardino | 34.2 | −116.9 | 2058.3 | 100.0 |
| USC00040790 | Big Sur Stn | Monterey | 36.2 | −121.8 | 61.0 | 98.0 |
| USC00040798 | Big Tujunga Dam Fc46 | Los Angeles | 34.3 | −118.2 | 709.0 | 0.0 |
| USC00040820 | Aspendell | Inyo | 37.2 | −118.6 | 2581.7 | 100.0 |
| USC00040823 | Bishop | Inyo | 37.4 | −118.4 | 1251.5 | 0.0 |
| USC00040924 | Blythe | Riverside | 33.6 | −114.6 | 81.7 | 0.0 |
| USC00040931 | Boca | Nevada | 39.4 | −120.1 | 1699.3 | 100.0 |
| USC00040943 | Bodie California St Historic P | Mono | 38.2 | −119.0 | 2551.2 | 27.0 |
| USC00040983 | Borrego Desert Park | San Diego | 33.3 | −116.4 | 246.9 | 99.0 |
| USC00041018 | Bowman Dam | Nevada | 39.5 | −120.7 | 1641.3 | 14.0 |
| USC00041072 | Bridgeport | Mono | 38.3 | −119.2 | 1972.1 | 10.0 |
| USC00041159 | Bucks Creek | Plumas | 39.9 | −121.3 | 576.4 | 0.0 |
| USC00041194 | Burbank Valley Pump Plt | Los Angeles | 34.2 | −118.3 | 199.6 | 100.0 |
| USC00041244 | Buttonwillow | Kern | 35.4 | −119.5 | 68.6 | 63.0 |
| USC00041253 | Cachuma Lake | Santa Barbara | 34.6 | −120.0 | 240.5 | 100.0 |
| USC00041277 | Calaveras Big Trees | Calaveras | 38.3 | −120.3 | 1431.0 | 35.0 |
| USC00041312 | Calistoga | Napa | 38.6 | −122.6 | 106.7 | 100.0 |
| USC00041424 | Campo | San Diego | 32.6 | −116.5 | 801.6 | 100.0 |
| USC00041428 | Camp Pardee | Calaveras | 38.2 | −120.8 | 200.6 | 0.0 |
| USC00041614 | Cedarville | Modoc | 41.5 | −120.2 | 1428.9 | 98.0 |
| USC00041697 | Cherry Valley Dam | Tuolumne | 38.0 | −119.9 | 1452.4 | 99.0 |
| USC00041700 | Chester | Plumas | 40.3 | −121.2 | 1387.1 | 50.0 |
| USC00041715 | Chico Univ Farm | Butte | 39.7 | −121.8 | 56.4 | 12.0 |
| USC00041738 | Chiriaco Summit | Riverside | 33.7 | −115.7 | 520.0 | 87.0 |
| USC00041758 | Chula Vista | San Diego | 32.6 | −117.1 | 17.1 | 99.0 |
| USC00041806 | Clearlake 4 SE | Lake | 38.9 | −122.6 | 411.2 | 97.0 |
| USC00041838 | Cloverdale | Sonoma | 38.8 | −123.0 | 121.9 | 96.0 |
| USC00041864 | Coalinga | Fresno | 36.1 | −120.4 | 204.2 | 33.0 |
| USC00041879 | Coarsegold 4SE | Madera | 37.2 | −119.7 | 676.0 | 0.0 |
| USC00041907 | Coleman Fisheries Stn | Shasta | 40.4 | −122.1 | 128.0 | 0.0 |
| USC00041912 | Colfax | Placer | 39.1 | −120.9 | 723.3 | 98.0 |
| USC00041916 | Colgate Powerhouse | Nevada | 39.3 | −121.2 | 181.4 | 0.0 |
| USC00041948 | Colusa 2 SSW | Colusa | 39.2 | −122.0 | 15.2 | 86.0 |
| USC00042012 | Corcoran Irrig Dist | Kings | 36.1 | −119.6 | 61.0 | 97.0 |
| USC00042090 | Covina City Yard Fc387B | Los Angeles | 34.1 | −117.9 | 185.0 | 0.0 |
| USC00042214 | Culver City | Los Angeles | 34.0 | −118.4 | 28.0 | 100.0 |
| USC00042239 | Cuyamaca | San Diego | 33.0 | −116.6 | 1414.3 | 100.0 |
| USC00042294 | Davis 2 WSW Exp Farm | Yolo | 38.5 | −121.8 | 18.3 | 99.0 |
| USC00042319 | Death Valley Np | Inyo | 36.5 | −116.9 | −59.1 | 100.0 |
| USC00042327 | Deep Canyon Lab | Riverside | 33.7 | −116.4 | 365.8 | 0.0 |
| USC00042346 | Delano | Kern | 35.8 | −119.3 | 92.0 | 36.0 |
| USC00042402 | De Sabla | Butte | 39.9 | −121.6 | 826.0 | 15.0 |
| USC00042500 | Downieville | Sierra | 39.6 | −120.8 | 888.5 | 100.0 |
| USC00042574 | Dunsmuir Trtmt Pl | Shasta | 41.2 | −122.3 | 661.1 | 98.0 |
| USC00042598 | Eagle Mtn | Riverside | 33.8 | −115.5 | 296.6 | 73.0 |
| USC00042706 | El Cajon | San Diego | 32.8 | −116.9 | 150.9 | 100.0 |
| USC00042709 | El Capitan Dam | San Diego | 32.9 | −116.8 | 182.9 | 0.0 |
| USC00042713 | El Centro 2 SSW | Imperial | 32.8 | −115.6 | −9.1 | 90.0 |
| USC00042805 | Elsinore | Riverside | 33.7 | −117.3 | 386.5 | 100.0 |
| USC00042863 | Escondido #2 | San Diego | 33.1 | −117.1 | 182.9 | 100.0 |
| USC00042920 | Exchequer Dam | Mariposa | 37.4 | −120.2 | 128.0 | 0.0 |
| USC00042934 | Fairfield | Solano | 38.3 | −122.1 | 12.2 | 90.0 |
| USC00042941 | Fairmont | Los Angeles | 34.7 | −118.4 | 932.7 | 100.0 |
| USC00042964 | Fall Rvr Mills | Shasta | 41.0 | −121.4 | 1005.8 | 0.0 |
| USC00043038 | Fiddletown Dexter Rch | Amador | 38.5 | −120.7 | 661.4 | 0.0 |
| USC00043083 | Five Points 5 SSW | Fresno | 36.4 | −120.2 | 86.9 | 100.0 |
| USC00043134 | Foresthill Rs | Placer | 39.0 | −120.8 | 919.0 | 0.0 |
| USC00043157 | Ft Bidwell | Modoc | 41.9 | −120.2 | 1444.4 | 100.0 |
| USC00043161 | Ft Bragg 5 N | Mendocino | 39.5 | −123.8 | 37.5 | 96.0 |
| USC00043182 | Ft Jones Rs | Siskiyou | 41.6 | −122.8 | 831.8 | 88.0 |
| USC00043191 | Ft Ross | Sonoma | 38.5 | −123.2 | 34.1 | 76.0 |
| USC00043244 | Fremont | Alameda | 37.5 | −122.0 | 11.6 | 100.0 |
| USC00043256 | Fresno 5 NE | Fresno | 36.8 | −119.7 | 103.0 | 96.0 |
| USC00043261 | Friant Government Camp | Fresno | 37.0 | −119.7 | 131.1 | 99.0 |
| USC00043357 | Gasquet Rs | Del Norte | 41.8 | −124.0 | 118.0 | 0.0 |
| USC00043402 | Gibraltar Dam #2 | Santa Barbara | 34.5 | −119.7 | 474.9 | 72.0 |
| USC00043463 | Glennville | Kern | 35.7 | −118.7 | 957.1 | 52.0 |
| USC00043491 | Gold Run 4 SW | Placer | 39.2 | −120.9 | 981.5 | 0.0 |
| USC00043551 | Grant Grove | Tulare | 36.7 | −119.0 | 2005.6 | 77.0 |
| USC00043573 | Grass Valley #2 | Nevada | 39.2 | −121.1 | 731.5 | 99.0 |
| USC00043578 | Graton | Sonoma | 38.4 | −122.9 | 61.0 | 100.0 |
| USC00043669 | Groveland 2 | Tuolumne | 37.8 | −120.2 | 853.4 | 7.0 |
| USC00043714 | Half Moon Bay | San Mateo | 37.5 | −122.4 | 8.2 | 100.0 |
| USC00043747 | Hanford 1 S | Kings | 36.3 | −119.6 | 72.2 | 100.0 |
| USC00043761 | Happy Camp Rs | Siskiyou | 41.8 | −123.4 | 348.1 | 52.0 |
| USC00043800 | Harry L Englebright Dam | Nevada | 39.2 | −121.3 | 243.8 | 0.0 |
| USC00043824 | Hat Creek | Shasta | 40.9 | −121.5 | 919.0 | 47.0 |
| USC00043855 | Hayfield Pumping Plt | Riverside | 33.7 | −115.6 | 417.6 | 98.0 |
| USC00043875 | Healdsburg | Sonoma | 38.6 | −122.9 | 53.9 | 100.0 |
| USC00043882 | Hearst Castle | San Luis Obispo | 35.7 | −121.2 | 465.1 | 100.0 |
| USC00043891 | Hell Hole | Placer | 39.1 | −120.4 | 1478.3 | 0.0 |
| USC00043896 | Hemet | Riverside | 33.7 | −116.9 | 552.0 | 0.0 |
| USC00043914 | Henshaw Dam | San Diego | 33.2 | −116.8 | 823.0 | 97.0 |
| USC00043939 | Hetch Hetchy | Tuolumne | 38.0 | −119.8 | 1179.6 | 90.0 |
| USC00044025 | Hollister 2 | San Benito | 36.8 | −121.4 | 83.8 | 100.0 |
| USC00044211 | Idyllwild Fire Dept | Riverside | 33.8 | −116.7 | 1639.8 | 100.0 |
| USC00044223 | Imperial | Imperial | 32.8 | −115.6 | −19.5 | 99.0 |
| USC00044259 | Indio Fire Stn | Riverside | 33.7 | −116.2 | −6.4 | 100.0 |
| USC00044297 | Iron Mtn | San Bernardino | 34.1 | −115.1 | 281.0 | 96.0 |
| USC00044303 | Irvine Rch | Orange | 33.7 | −117.7 | 164.6 | 98.0 |
| USC00044374 | Jess Valley | Modoc | 41.3 | −120.3 | 1621.2 | 32.0 |
| USC00044405 | Joshua Tree | San Bernardino | 34.1 | −116.3 | 781.2 | 100.0 |
| USC00044412 | Julian Cdf | San Diego | 33.1 | −116.6 | 1284.7 | 100.0 |
| USC00044422 | Juncal Dam | Santa Barbara | 34.5 | −119.5 | 688.8 | 0.0 |
| USC00044484 | Kelsey 1 N | El Dorado | 38.8 | −120.8 | 609.6 | 0.0 |
| USC00044500 | Kentfield | Marin | 38.0 | −122.5 | 44.2 | 100.0 |
| USC00044534 | Kettleman City | Kings | 36.0 | −120.0 | 73.2 | 85.0 |
| USC00044555 | King City | Monterey | 36.2 | −121.1 | 97.5 | 100.0 |
| USC00044710 | Lakeside 2 E | San Diego | 32.9 | −116.9 | 210.3 | 0.0 |
| USC00044712 | Lake Solano | Solano | 38.5 | −122.0 | 57.0 | 100.0 |
| USC00044838 | Lava Beds Nat Mon | Siskiyou | 41.7 | −121.5 | 1455.4 | 93.0 |
| USC00044881 | Lee Vining | Mono | 38.0 | −119.1 | 2071.7 | 99.0 |
| USC00044890 | Lemon Cove | Tulare | 36.4 | −119.0 | 156.4 | 100.0 |
| USC00044957 | Lindsay | Tulare | 36.2 | −119.1 | 132.6 | 100.0 |
| USC00044997 | Livermore | Alameda | 37.7 | −121.8 | 161.2 | 100.0 |
| USC00045026 | Lodgepole | Tulare | 36.6 | −118.7 | 2052.8 | 0.0 |
| USC00045064 | Lompoc | Santa Barbara | 34.7 | −120.5 | 22.9 | 100.0 |
| USC00045091 | Long Valley 2 | Riverside | 33.8 | −116.6 | 2554.2 | 0.0 |
| USC00045100 | Loraine 5 NNE | Kern | 35.4 | −118.4 | 1290.8 | 77.0 |
| USC00045118 | Los Banos | Merced | 37.1 | −120.9 | 36.6 | 100.0 |
| USC00045119 | Los Banos Arburua Rch | Merced | 36.9 | −120.9 | 256.9 | 0.0 |
| USC00045151 | Lost Hills | Kern | 35.6 | −119.7 | 87.8 | 0.0 |
| USC00045311 | Manzanita Lake | Shasta | 40.5 | −121.6 | 1752.6 | 12.0 |
| USC00045360 | Markley Cove | Napa | 38.5 | −122.1 | 146.3 | 100.0 |
| USC00045449 | Mccloud | Siskiyou | 41.3 | −122.1 | 985.4 | 73.0 |
| USC00045502 | Mecca Fire Stn | Riverside | 33.6 | −116.1 | −55.8 | 0.0 |
| USC00045532 | Merced | Merced | 37.3 | −120.5 | 46.9 | 99.0 |
| USC00045598 | Middletown | Lake | 38.7 | −122.6 | 341.7 | 0.0 |
| USC00045679 | Mineral | Tehama | 40.3 | −121.6 | 1485.9 | 59.0 |
| USC00045739 | Modesto Irrig Dist | Mariposa | 37.6 | −120.0 | 26.8 | 0.0 |
| USC00045795 | Monterey | Monterey | 36.6 | −121.9 | 37.2 | 99.0 |
| USC00045866 | Morro Bay Fire Dept | San Luis Obispo | 35.4 | −120.8 | 36.0 | 0.0 |
| USC00045915 | Mt Diablo Junction | Contra Costa | 37.9 | −121.9 | 661.4 | 100.0 |
| USC00045933 | Mt Hamilton | Santa Clara | 37.3 | −121.6 | 1286.3 | 99.0 |
| USC00045968 | Mt Laguna #3 | San Diego | 32.9 | −116.4 | 1804.4 | 100.0 |
| USC00045983 | Mt Shasta | Siskiyou | 41.3 | −122.3 | 1101.2 | 100.0 |
| USC00046006 | Mt Wilson Cbs | Los Angeles | 34.2 | −118.1 | 1740.4 | 79.0 |
| USC00046027 | Muir Woods | Marin | 37.9 | −122.6 | 67.1 | 0.0 |
| USC00046074 | Napa State Hospital | Napa | 38.3 | −122.3 | 10.7 | 92.0 |
| USC00046136 | Nevada City | Nevada | 39.2 | −121.0 | 847.6 | 98.0 |
| USC00046154 | New Cuyama Fire Stn | Santa Barbara | 34.9 | −119.7 | 658.4 | 100.0 |
| USC00046168 | Newman | Merced | 37.3 | −121.0 | 27.4 | 100.0 |
| USC00046174 | New Melones Dam Hq | Tuolumne | 38.0 | −120.5 | 292.6 | 100.0 |
| USC00046175 | Newport Beach Harbor | Orange | 33.6 | −117.9 | 3.0 | 100.0 |
| USC00046194 | Nicolaus #2 | Sutter | 38.9 | −121.5 | 13.1 | 0.0 |
| USC00046197 | Niland | Imperial | 33.3 | −115.5 | −18.3 | 0.0 |
| USC00046252 | N Fk Rs | Madera | 37.2 | −119.5 | 806.2 | 48.0 |
| USC00046328 | Oak Knoll W C | Siskiyou | 41.8 | −122.9 | 603.5 | 0.0 |
| USC00046336 | Oakland Museum | Alameda | 37.8 | −122.3 | 9.1 | 100.0 |
| USC00046377 | Oceanside Marina | San Diego | 33.2 | −117.4 | 3.0 | 100.0 |
| USC00046386 | Ocotillo Wells 2W | San Diego | 33.2 | −116.2 | 118.9 | 100.0 |
| USC00046399 | Ojai | Ventura | 34.4 | −119.2 | 227.1 | 100.0 |
| USC00046506 | Orland | Glenn | 39.7 | −122.2 | 77.4 | 53.0 |
| USC00046508 | Orleans | Humboldt | 41.3 | −123.5 | 122.8 | 98.0 |
| USC00046521 | Oroville | Butte | 39.5 | −121.6 | 52.1 | 73.0 |
| USC00046572 | Oxnard Wfo | Ventura | 34.2 | −119.1 | 15.8 | 100.0 |
| USC00046602 | Pacoima Dam Fc33A-E | Los Angeles | 34.3 | −118.4 | 472.4 | 0.0 |
| USC00046624 | Palmdale | Los Angeles | 34.6 | −118.1 | 796.1 | 100.0 |
| USC00046635 | Palm Springs | Riverside | 33.8 | −116.5 | 129.5 | 0.0 |
| USC00046657 | Palomar Mtn Obsy | San Diego | 33.4 | −116.8 | 1691.6 | 100.0 |
| USC00046663 | Palos Verdes Es Fc43D | Los Angeles | 33.8 | −118.4 | 67.1 | 0.0 |
| USC00046675 | Panoche 2 W | San Benito | 36.6 | −120.9 | 426.7 | 0.0 |
| USC00046699 | Parker Rsvr | San Bernardino | 34.3 | −114.2 | 224.9 | 96.0 |
| USC00046719 | Pasadena | Los Angeles | 34.1 | −118.1 | 263.3 | 100.0 |
| USC00046730 | Paso Robles | San Luis Obispo | 35.6 | −120.7 | 222.5 | 100.0 |
| USC00046773 | Pearblossom | Los Angeles | 34.5 | −117.9 | 945.2 | 100.0 |
| USC00046826 | Petaluma AP | Sonoma | 38.3 | −122.6 | 6.1 | 99.0 |
| USC00046926 | Pinnacles Np | San Benito | 36.5 | −121.2 | 398.4 | 100.0 |
| USC00046940 | Piru 2 ESE | Ventura | 34.4 | −118.8 | 217.0 | 0.0 |
| USC00046946 | Pit Rvr Ph 5 | Shasta | 41.0 | −122.0 | 444.4 | 0.0 |
| USC00046961 | Placerville 3 ENE | El Dorado | 38.8 | −120.7 | 810.2 | 68.0 |
| USC00047085 | Portola | Plumas | 39.8 | −120.5 | 1478.3 | 96.0 |
| USC00047109 | Potter Valley Powerhouse | Mendocino | 39.4 | −123.1 | 310.3 | 99.0 |
| USC00047111 | Poway Valley | San Diego | 33.0 | −117.0 | 197.5 | 0.0 |
| USC00047195 | Quincy | Plumas | 39.9 | −120.9 | 1042.4 | 100.0 |
| USC00047248 | Rancho Bernardo | San Diego | 33.0 | −117.1 | 210.3 | 100.0 |
| USC00047270 | Raymond | Madera | 37.2 | −119.9 | 280.1 | 0.0 |
| USC00047298 | Redding Cdf | Shasta | 40.5 | −122.3 | 153.0 | 0.0 |
| USC00047306 | Redlands | San Bernardino | 34.0 | −117.2 | 429.8 | 0.0 |
| USC00047326 | Redondo Beach | Los Angeles | 33.8 | −118.4 | 43.3 | 100.0 |
| USC00047339 | Redwood City | San Mateo | 37.5 | −122.2 | 9.4 | 100.0 |
| USC00047414 | Richmond | Contra Costa | 37.9 | −122.4 | 6.1 | 76.0 |
| USC00047470 | Riverside Fire Stn 3 | Riverside | 34.0 | −117.4 | 256.0 | 0.0 |
| USC00047672 | Salinas Dam | San Luis Obispo | 35.3 | −120.5 | 424.3 | 0.0 |
| USC00047681 | Salsipuedes Gaging Stn | Santa Barbara | 34.6 | −120.4 | 77.4 | 0.0 |
| USC00047702 | San Andreas 2 | Calaveras | 38.2 | −120.7 | 335.3 | 0.0 |
| USC00047741 | San Diego Seaworld | San Diego | 32.8 | −117.2 | 4.3 | 100.0 |
| USC00047767 | San Francisco Oceanside | San Francisco | 37.7 | −122.5 | 2.4 | 85.0 |
| USC00047776 | San Gabriel Canyon Ph | Los Angeles | 34.2 | −117.9 | 226.8 | 0.0 |
| USC00047779 | San Gabriel Dam Fc425B-E | Los Angeles | 34.2 | −117.9 | 451.4 | 0.0 |
| USC00047785 | San Gabriel Fire Dept | Los Angeles | 34.1 | −118.1 | 110.6 | 0.0 |
| USC00047813 | San Jacinto | Riverside | 33.8 | −117.0 | 464.8 | 99.0 |
| USC00047821 | San Jose | Santa Clara | 37.4 | −121.9 | 14.9 | 100.0 |
| USC00047851 | San Luis Obispo Poly | San Luis Obispo | 35.3 | −120.7 | 93.9 | 100.0 |
| USC00047880 | San Rafael-Civic Ctr | Marin | 38.0 | −122.5 | 36.6 | 98.0 |
| USC00047888 | Santa Ana Fire Stn | Orange | 33.7 | −117.9 | 41.1 | 100.0 |
| USC00047902 | Santa Barbara | Santa Barbara | 34.4 | −119.7 | 4.9 | 100.0 |
| USC00047933 | Santa Margarita Boost | San Luis Obispo | 35.4 | −120.6 | 349.9 | 0.0 |
| USC00047965 | Santa Rosa | Sonoma | 38.5 | −122.7 | 50.6 | 95.0 |
| USC00048014 | Saugus Pwr Plt 1 | Los Angeles | 34.6 | −118.5 | 658.7 | 0.0 |
| USC00048045 | Scotia | Humboldt | 40.5 | −124.1 | 41.5 | 100.0 |
| USC00048122 | Shafter 6E | Kern | 35.5 | −119.1 | 123.1 | 100.0 |
| USC00048135 | Shasta Dam | Shasta | 40.7 | −122.4 | 327.7 | 79.0 |
| USC00048218 | Sierraville Rs | Sierra | 39.6 | −120.4 | 1516.4 | 24.0 |
| USC00048273 | Skyline Ridge Preserve | San Mateo | 37.3 | −122.2 | 691.9 | 98.0 |
| USC00048351 | Sonoma | Sonoma | 38.3 | −122.5 | 29.6 | 98.0 |
| USC00048353 | Sonora | Tuolumne | 38.0 | −120.4 | 510.5 | 91.0 |
| USC00048380 | So Entrance Yosemite Np | Mariposa | 37.5 | −119.6 | 1538.3 | 66.0 |
| USC00048407 | S Lake Fs | Kern | 35.6 | −118.4 | 808.9 | 24.0 |
| USC00048587 | Stony Gorge Rsvr | Glenn | 39.6 | −122.5 | 243.8 | 100.0 |
| USC00048606 | Strawberry Valley 2 | Butte | 39.5 | −121.2 | 1130.8 | 74.0 |
| USC00048702 | Susanville 2SW | Lassen | 40.4 | −120.7 | 1283.8 | 61.0 |
| USC00048713 | Sutter Hill Cdf | Amador | 38.4 | −120.8 | 483.4 | 70.0 |
| USC00048758 | Tahoe City | Placer | 39.2 | −120.1 | 1898.9 | 99.0 |
| USC00048760 | Tahoma | El Dorado | 39.1 | −120.1 | 1924.8 | 100.0 |
| USC00048829 | Tehachapi 4 SE | Kern | 35.1 | −118.4 | 1286.3 | 76.0 |
| USC00048839 | Tejon Rancho | Kern | 35.0 | −118.7 | 434.3 | 67.0 |
| USC00048999 | Tracy Carbona | San Joaquin | 37.7 | −121.3 | 41.1 | 93.0 |
| USC00049001 | Tracy Pumping Plt | Alameda | 37.8 | −121.6 | 18.6 | 98.0 |
| USC00049026 | Trinity Rvr Hatchery | Trinity | 40.7 | −122.8 | 567.2 | 100.0 |
| USC00049035 | Trona | San Bernardino | 35.8 | −117.4 | 516.6 | 98.0 |
| USC00049040 | Truckee-Tahoe AP | Nevada | 39.3 | −120.1 | 1798.3 | 98.0 |
| USC00049053 | Tulelake | Siskiyou | 42.0 | −121.5 | 1230.8 | 95.0 |
| USC00049063 | Tuolumne Meadows Rs | Tuolumne | 37.9 | −119.3 | 2649.9 | 89.0 |
| USC00049073 | Turlock #2 | Stanislaus | 37.5 | −120.8 | 31.4 | 49.0 |
| USC00049099 | Twentynine Palms | San Bernardino | 34.1 | −116.0 | 602.0 | 99.0 |
| USC00049111 | Twitchell Dam | Santa Barbara | 35.0 | −120.3 | 177.4 | 100.0 |
| USC00049152 | U C L A | Los Angeles | 34.1 | −118.4 | 131.1 | 100.0 |
| USC00049185 | Upper San Leandro Filters | Alameda | 37.8 | −122.2 | 120.1 | 0.0 |
| USC00049219 | Vallejo | Solano | 38.1 | −122.2 | 103.9 | 99.0 |
| USC00049226 | Valley Ctr 1N | San Diego | 33.2 | −117.0 | 393.2 | 0.0 |
| USC00049298 | Verdi 2W | Sierra | 39.5 | −120.0 | 1654.8 | 100.0 |
| USC00049325 | Victorville | San Bernardino | 34.5 | −117.3 | 850.1 | 0.0 |
| USC00049367 | Visalia | Tulare | 36.3 | −119.3 | 92.4 | 88.0 |
| USC00049378 | Vista | San Diego | 33.2 | −117.2 | 131.1 | 99.0 |
| USC00049390 | Volta Ph | Shasta | 40.5 | −121.9 | 676.7 | 0.0 |
| USC00049452 | Wasco | Kern | 35.6 | −119.4 | 88.7 | 88.0 |
| USC00049473 | Watsonville Wtr Wks | Santa Cruz | 36.9 | −121.8 | 29.0 | 100.0 |
| USC00049582 | W Pt | Calaveras | 38.4 | −120.5 | 845.8 | 0.0 |
| USC00049621 | Whiskeytown Rsvr | Shasta | 40.6 | −122.5 | 394.7 | 83.0 |
| USC00049699 | Willows 6 W | Glenn | 39.5 | −122.3 | 71.3 | 97.0 |
| USC00049742 | Winters | Yolo | 38.5 | −122.0 | 41.1 | 100.0 |
| USC00049785 | Woodland Hills Pierce College | Los Angeles | 34.2 | −118.6 | 240.8 | 100.0 |
| USC00049855 | Yosemite Park Hq | Mariposa | 37.8 | −119.6 | 1224.7 | 77.0 |
| USC00049866 | Yreka | Siskiyou | 41.7 | −122.6 | 826.6 | 96.0 |
| USC00049884 | Yucca Mesa | San Bernardino | 34.2 | −116.4 | 1050.0 | 99.0 |
| USW00000369 | Mcolf Camp Pendleton Red Beach | San Diego | 33.3 | −117.5 | 27.1 | 0.0 |
| USW00003102 | Ontario Intl AP | San Bernardino | 34.1 | −117.6 | 281.6 | 100.0 |
| USW00003104 | Desert Resorts Rgnl AP | Riverside | 33.6 | −116.2 | −36.0 | 80.0 |
| USW00003122 | Torrance AP | Los Angeles | 33.8 | −118.3 | 27.4 | 100.0 |
| USW00003131 | San Diego Montgomery Fld | San Diego | 32.8 | −117.1 | 127.4 | 100.0 |
| USW00003144 | Imperial Co AP | Imperial | 32.8 | −115.6 | −16.8 | 88.0 |
| USW00003154 | Camp Pendleton Mcas | San Diego | 33.3 | −117.4 | 21.3 | 95.0 |
| USW00003159 | Lancaster | Los Angeles | 34.7 | −118.2 | 712.6 | 100.0 |
| USW00003166 | Fullerton Muni AP | Orange | 33.9 | −118.0 | 26.2 | 93.0 |
| USW00003167 | Hawthorne Muni AP | Los Angeles | 33.9 | −118.3 | 16.8 | 99.0 |
| USW00003171 | Riverside Muni AP | Riverside | 34.0 | −117.4 | 257.6 | 100.0 |
| USW00003177 | Carlsbad Mcclellan Palomar AP | San Diego | 33.1 | −117.3 | 95.4 | 100.0 |
| USW00003178 | San Diego Brown Fld | San Diego | 32.6 | −117.0 | 158.8 | 79.0 |
| USW00003179 | Chino AP | San Bernardino | 34.0 | −117.6 | 193.9 | 98.0 |
| USW00004222 | Redding 12 WNW | Shasta | 40.7 | −122.6 | 432.2 | 100.0 |
| USW00023110 | Lemoore Reeves Nas | Kings | 36.3 | −120.0 | 70.7 | 93.0 |
| USW00023114 | Edwards Afb | Kern | 34.9 | −117.9 | 705.9 | 96.0 |
| USW00023119 | March Afb | Riverside | 33.9 | −117.2 | 468.2 | 98.0 |
| USW00023122 | Norton Afb | San Bernardino | 34.1 | −117.2 | 338.9 | 97.0 |
| USW00023129 | Long Beach Daugherty AP | Los Angeles | 33.8 | −118.1 | 10.4 | 99.0 |
| USW00023130 | Van Nuys AP | Los Angeles | 34.2 | −118.5 | 239.3 | 100.0 |
| USW00023131 | Victorville So Ca AP | San Bernardino | 34.6 | −117.4 | 869.0 | 96.0 |
| USW00023136 | Camarillo AP | Ventura | 34.2 | −119.1 | 21.6 | 100.0 |
| USW00023152 | Burbank Glendale Pasadena AP | Los Angeles | 34.2 | −118.4 | 222.8 | 100.0 |
| USW00023155 | Bakersfield AP | Kern | 35.4 | −119.1 | 149.4 | 100.0 |
| USW00023157 | Bishop AP | Inyo | 37.4 | −118.4 | 1252.7 | 100.0 |
| USW00023158 | Blythe Asos | Riverside | 33.6 | −114.7 | 120.4 | 97.0 |
| USW00023161 | Barstow-Daggett AP | San Bernardino | 34.9 | −116.8 | 584.9 | 100.0 |
| USW00023174 | Los Angeles Intl AP | Los Angeles | 33.9 | −118.4 | 29.6 | 100.0 |
| USW00023179 | Needles AP | San Bernardino | 34.8 | −114.6 | 270.7 | 92.0 |
| USW00023182 | Palmdale AP | Los Angeles | 34.6 | −118.1 | 764.7 | 100.0 |
| USW00023187 | Sandberg | Los Angeles | 34.7 | −118.7 | 1374.6 | 100.0 |
| USW00023188 | San Diego Intl AP | San Diego | 32.7 | −117.2 | 4.6 | 99.0 |
| USW00023190 | Santa Barbara Muni AP | Santa Barbara | 34.4 | −119.8 | 2.4 | 100.0 |
| USW00023191 | Avalon Catalina AP | Los Angeles | 33.4 | −118.4 | 477.0 | 98.0 |
| USW00023199 | El Centro Naf | Imperial | 32.8 | −115.7 | −14.0 | 86.0 |
| USW00023202 | Travis Afb | Solano | 38.3 | −121.9 | 18.0 | 99.0 |
| USW00023206 | Sacramento Mather Afb | Sacramento | 38.6 | −121.3 | 39.9 | 97.0 |
| USW00023208 | Sacramento Mcclellan Afb | Sacramento | 38.7 | −121.4 | 25.0 | 99.0 |
| USW00023213 | Santa Rosa Sonoma Co AP | Sonoma | 38.5 | −122.8 | 36.3 | 100.0 |
| USW00023225 | Blue Canyon Nyack AP | Placer | 39.3 | −120.7 | 1611.2 | 98.0 |
| USW00023230 | Oakland Intl AP | Alameda | 37.7 | −122.2 | 1.5 | 100.0 |
| USW00023232 | Sacramento AP Asos | Sacramento | 38.5 | −121.5 | 5.8 | 100.0 |
| USW00023233 | Salinas AP | Monterey | 36.7 | −121.6 | 22.3 | 99.0 |
| USW00023234 | San Francisco Intl AP | San Mateo | 37.6 | −122.4 | 3.0 | 100.0 |
| USW00023237 | Stockton AP | San Joaquin | 37.9 | −121.2 | 8.2 | 100.0 |
| USW00023243 | Lompoc AP | Santa Barbara | 34.7 | −120.5 | 26.8 | 0.0 |
| USW00023244 | Moffett Fed Airfield | Santa Clara | 37.4 | −122.0 | 11.9 | 98.0 |
| USW00023254 | Concord Buchanan Fld | Contra Costa | 38.0 | −122.1 | 7.0 | 100.0 |
| USW00023257 | Merced Muni AP | Merced | 37.3 | −120.5 | 46.3 | 100.0 |
| USW00023258 | Modesto AP | Stanislaus | 37.6 | −121.0 | 26.5 | 99.0 |
| USW00023259 | Monterey Peninsul AP | Monterey | 36.6 | −121.8 | 48.8 | 100.0 |
| USW00023271 | Sacramento 5 ESE | Sacramento | 38.6 | −121.4 | 11.6 | 41.0 |
| USW00023272 | San Francisco Dwtn | San Francisco | 37.8 | −122.4 | 45.7 | 98.0 |
| USW00023273 | Santa Maria Public AP | Santa Barbara | 34.9 | −120.5 | 74.1 | 100.0 |
| USW00023275 | Ukiah Muni AP | Mendocino | 39.1 | −123.2 | 183.8 | 100.0 |
| USW00023277 | Watsonville Muni AP | Santa Cruz | 36.9 | −121.8 | 49.4 | 99.0 |
| USW00023285 | Livermore Muni AP | Alameda | 37.7 | −121.8 | 119.8 | 100.0 |
| USW00023293 | San Jose | Santa Clara | 37.4 | −121.9 | 14.9 | 100.0 |
| USW00024213 | Eureka Wfo Woodley Is | Humboldt | 40.8 | −124.2 | 6.1 | 100.0 |
| USW00024215 | Mt Shasta | Siskiyou | 41.3 | −122.3 | 1083.0 | 97.0 |
| USW00024216 | Red Bluff Muni AP | Tehama | 40.2 | −122.3 | 107.9 | 96.0 |
| USW00024257 | Redding AP | Shasta | 40.5 | −122.3 | 152.7 | 100.0 |
| USW00024259 | Montague Siskiyou AP | Siskiyou | 41.8 | −122.5 | 806.2 | 99.0 |
| USW00024283 | Arcata Eureka AP | Humboldt | 41.0 | −124.1 | 64.3 | 100.0 |
| USW00024286 | Crescent City Mcnamara AP | Del Norte | 41.8 | −124.2 | 17.1 | 100.0 |
| USW00053119 | Hanford Muni AP | Kings | 36.3 | −119.6 | 75.9 | 100.0 |
| USW00053120 | Ramona AP | San Diego | 33.0 | −116.9 | 422.1 | 100.0 |
| USW00053121 | Oceanside Muni AP | San Diego | 33.2 | −117.3 | 9.1 | 97.0 |
| USW00053139 | Stovepipe Wells 1 SW | Inyo | 36.6 | −117.1 | 25.6 | 100.0 |
| USW00053144 | Edwards Afb N Aux Airfield | Kern | 35.0 | −117.9 | 695.9 | 97.0 |
| USW00053150 | Yosemite Village 12 W | Mariposa | 37.8 | −119.8 | 2017.8 | 100.0 |
| USW00053151 | Fallbrook 5 NE | Riverside | 33.4 | −117.2 | 347.5 | 100.0 |
| USW00053152 | Santa Barbara 11 W | Santa Barbara | 34.4 | −119.9 | 5.5 | 99.0 |
| USW00053175 | Corona Municipal AP | Riverside | 33.9 | −117.6 | 162.5 | 99.0 |
| USW00093104 | China Lake Naf | Kern | 35.7 | −117.7 | 680.0 | 81.0 |
| USW00093107 | San Diego Miramar Nas | San Diego | 32.9 | −117.1 | 145.4 | 98.0 |
| USW00093110 | Oxnard Ventura Co AP | Ventura | 34.2 | −119.2 | 11.9 | 100.0 |
| USW00093111 | Pt Mugu Nf | Ventura | 34.1 | −119.1 | 3.7 | 94.0 |
| USW00093112 | N Is Nas | San Diego | 32.7 | −117.2 | 4.3 | 98.0 |
| USW00093115 | Imperial Beach Ream Fld Nas | San Diego | 32.6 | −117.1 | 7.3 | 68.0 |
| USW00093116 | San Nicolas Is | Ventura | 33.2 | −119.5 | 161.2 | 75.0 |
| USW00093117 | San Clemente Is Naas | Los Angeles | 33.0 | −118.6 | 55.5 | 62.0 |
| USW00093121 | Twentynine Palms Mc | San Bernardino | 34.3 | −116.2 | 643.1 | 0.0 |
| USW00093134 | Los Angeles Downtown/Usc | Los Angeles | 34.0 | −118.3 | 54.6 | 100.0 |
| USW00093138 | Palm Springs Asos | Riverside | 33.8 | −116.5 | 124.7 | 100.0 |
| USW00093184 | Santa Ana John Wayne AP | Orange | 33.7 | −117.9 | 13.1 | 96.0 |
| USW00093193 | Fresno Yosemite Intl | Fresno | 36.8 | −119.7 | 101.8 | 100.0 |
| USW00093197 | Santa Monica Muni AP | Los Angeles | 34.0 | −118.4 | 53.3 | 100.0 |
| USW00093205 | Marysville AP (Asos) | Yuba | 39.1 | −121.6 | 18.9 | 100.0 |
| USW00093206 | San Luis Obispo Mcchesney Fld | San Luis Obispo | 35.2 | −120.6 | 55.8 | 100.0 |
| USW00093209 | Paso Robles Muni AP | San Luis Obispo | 35.7 | −120.6 | 249.9 | 100.0 |
| USW00093210 | Oroville Muni AP | Butte | 39.5 | −121.6 | 57.0 | 100.0 |
| USW00093214 | Vandenberg Afb | Santa Barbara | 34.7 | −120.6 | 116.1 | 90.0 |
| USW00093216 | Beale Afb | Yuba | 39.1 | −121.4 | 38.1 | 98.0 |
| USW00093225 | Sacramento Metro AP | Sacramento | 38.7 | −121.6 | 7.3 | 100.0 |
| USW00093227 | Napa Co AP | Napa | 38.2 | −122.3 | 4.9 | 99.0 |
| USW00093228 | Hayward Air Terminal | Alameda | 37.7 | −122.1 | 9.4 | 100.0 |
| USW00093230 | S Lake Tahoe AP | El Dorado | 38.9 | −120.0 | 1907.1 | 100.0 |
| USW00093241 | Vacaville/Nut Tree AP Asos | Solano | 38.4 | −122.0 | 31.7 | 100.0 |
| USW00093242 | Madera Muni AP | Madera | 37.0 | −120.1 | 76.5 | 100.0 |
| USW00093243 | Merced 23 WSW | Merced | 37.2 | −120.9 | 23.8 | 100.0 |
| USW00093245 | Bodega 6 WSW | Sonoma | 38.3 | −123.1 | 19.2 | 99.0 |
| USW00094299 | Alturas Muni AP | Modoc | 41.5 | −120.6 | 1335.9 | 99.0 |
Source: NOAA NCEI
11 Glossary, methodology and sources
Anomaly: difference between the observed value and its 1991–2020 normal. Percent of normal: observed total divided by the normal, times 100. Station record: most extreme daily value for the same month in all earlier years of record (at least 20 years).
Temperature: NOAA nClimGrid-Daily. Precipitation: NOAA nClimGrid-Daily. nClimGrid-Daily is the grid behind NOAA's official statewide values; it is averaged here from 1/24° to 1/8° (about 12 km). Mean temperature is (Tmax + Tmin)/2. Statewide, regional and county averages are weighted by the area of each grid cell inside each polygon. Temperature maps, frost days and annex tables are given by region; regions are NOAA NCEI climate divisions, with each county in the division of its centroid. Recent weeks use NCEI's preliminary file of the month; such reports are marked preliminary and updated when the final file is published. Normals refer to 1991-2020; ranks compare values rounded to one decimal. Stations: GHCN-Daily (NOAA NCEI) cooperative and first-order stations; values flagged by its quality control are discarded, as are daily values more than 5 robust standard deviations from the station median and variables whose monthly anomaly differs by more than 3 °C from the gridded analysis. Period means require at least 80% of days with data and station normals at least 20 complete years. This report is generated automatically and does not replace official information from the National Weather Service or the state climatologist.
| Source | Product | License | Citation |
|---|---|---|---|
| NOAA CPC | ONI, Niño-region SST indices (OISST v2.1), NAO and AO | Public domain (NOAA) | NOAA Climate Prediction Center climate indices. |
| NOAA NCEI / PSL | Extended Reconstructed SST v5 (ERSST v5), 2° | Public domain (NOAA) | Huang et al. (2017), J. Climate, doi:10.1175/JCLI-D-16-0836.1 |
| GDACS | Global Disaster Alert and Coordination System event list | See provider terms | — |
| NOAA NCEI | GHCN-Daily | Public domain (NOAA) | Menne et al. (2012), J. Atmos. Oceanic Technol., doi:10.1175/JTECH-D-11-00103.1 |
| NOAA NCEI | IBTrACS v04r01 tropical-cyclone best tracks | Public domain (NOAA) | Knapp et al. (2010), Bull. Amer. Meteor. Soc., doi:10.1175/2009BAMS2755.1 |
| NOAA NCEI | Pacific Decadal Oscillation index (ERSST v5) | Public domain (NOAA) | — |
| NOAA NCEI | nClimGrid-Daily, contiguous United States (1/24°, averaged here to 1/8°) | Public domain (NOAA) | Durre, I., et al. (2022). NOAA's nClimGrid-Daily Version 1. NOAA National Centers for Environmental Information. doi:10.25921/c4gt-r169 |
| NOAA CPC | North American Multi-Model Ensemble (NMME) tercile probabilities, 1° | Public domain (NOAA) | Kirtman et al. (2014), Bull. Amer. Meteor. Soc., doi:10.1175/BAMS-D-12-00050.1 |
| National Drought Mitigation Center, USDA, NOAA | U.S. Drought Monitor, weekly maps and area statistics | Free to use with credit (NDMC) | The U.S. Drought Monitor is jointly produced by the National Drought Mitigation Center at the University of Nebraska-Lincoln, the United States Department of Agriculture and the National Oceanic and Atmospheric Administration. Map courtesy of NDMC. |
| US Census Bureau TIGERweb | US Census Bureau, TIGERweb counties (generalised) | Public domain (US Government work) | — |
Generated by ClimaBulletin (climabulletin.org), open source. Questions and comments: [email protected].